Better Realising Direct Manipulation
C.A.D’H. Gough, R. Green, and M. Billinghurst
Hitlab NZ, University of Canterbury
Email: [email protected]
Abstract
Direct Manipulation is an approach to designing user interfaces, which forms the basis of Graphical User Interfaces. Despite the importance of the concept, no mathematical model of Direct Manipulation has yet been developed. This paper proposes a model of Direct Manipulation, which relates cognitive distance with user familiarity and the novel concepts of “tech bias”, “velocity” and “inertia”.
Keywords
: Direct Manipulation, Usability.1
Introduction
While the technology of mainstream computer-based systems has changed significantly over the last few decades, the techniques used to interact with them have remained fairly static.
Today’s Graphical User Interfaces (GUIs) are, as were the original implementations, attempts to realise the ideals of Direct Manipulation1,2 (DM).
Given the importance of the concept of DM in the context of user interface (UI) design and research, it is surprising that there is no formal mathematical model of DM.
Such a model would be invaluable for optimising and evaluating UIs and in the development of techniques for bridging of the gulfs of execution and evaluation2 further than that which is possible with traditional GUIs; such as is intended in the research fields of Tangible User Interfaces (TUIs), Perceptual User interfaces (PUI), Augmented Reality (AR) and Virtual Reality (VR).
This paper presents a model of DM that relates cognitive distance with user familiarity and concepts of “tech bias”, “velocity” and “inertia”.
2
Directness
The sensation of increased usability and interactivity provided by a good DM user interface is known as “directness”1,2. The components of directness are the cognitive “distance” between the user and the computer (S), and certain user-related factors (U) which interact to provide a sensation of “engagement” for the user.
The goal of a DM interface is therefore to provide the optimal sensation of directness by minimising cognitive distance and maximising engagement.
2.1
Cognitive Distance
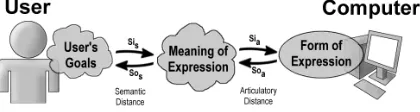
Cognitive Distance2 is a measure of the gulfs of execution and evaluation – the conceptual gap between the user’s ideas and intentions, and the way in which they are expressed to, or represented by, the system.
A large distance is representative of a large gulf of execution or evaluation, signifying that a lot of cognitive load is incurred in translating between the user’s intentions and the system’s representations, or vice versa.
[image:1.595.313.523.501.557.2]That is, a large distance of execution means it is relatively difficult for the user to express their query or desires to the system, and a large distance of evaluation indicates a lot of work for the user to interpret output from the system.
Figure 1: An overview of the various components of cognitive distance.
A simple model of cognitive distance would be the summation of the semantic (Sxs) and articulatory (Sxa)
components of both the gulf of execution (Si) and evaluation (So).
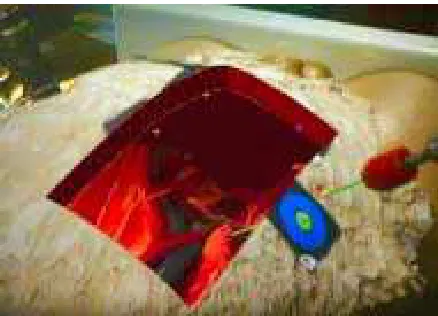
The MIT’s tangible media group has produced many excellent examples of such work, such as in the case of “Illuminating Clay”10, where the user performs landscape analysis and design work by interacting with soft, putty-like substances. The geometry of this “clay” is captured in real time using a laser scanner, and the resulting analyses are displayed both on surrounding display devices and projected directly back on to the clay itself.
Figure 2: The MIT Tangible Media Groups' “Illuminating Clay” TUI.
The field of Augmented Reality also seeks to bridge the gulfs of execution and evaluation further than that which is possible with traditional GUIs, but does so by augmenting the user’s senses with technology. For instance, there are many examples of medical research11,12,13 that utilises AR technology to assimilate information from technologies such as ultrasound scanning and presents it to the surgeon in such a manner that it appears as though they can “see inside” their patient as they perform the operation, even during procedures such as biopsies and keyhole surgery where such visibility is not possible.
Figure 3: AR-supported surgery. The surgeon is given the impression of "seeing inside" their patient. However, despite the seemingly inevitable benefits, such research often has difficulty minimising cognitive distance as much as expected.
In 2004 Claudia Nelles8 conducted a comparative analysis of two approaches to authoring content for AR/VR applications. The first system, called “iaTAR”, was a fully tangible approach. The second, “Catomir”, resembled a more traditional content authoring tool such as Macromedia’s “flash” - but added the option of viewing and performing basic interactions with scenes immersively if desired. In her conclusion, Claudia states that “[by] examining the overall outcomes for efficiency, errors and pleasurability [sic] observed with all participants, it would seem as if iaTAR [the tangible approach] is the more usable of the two tools. But, this conclusion is overly simplistic, and it is necessary to go into more detail to come to meaningful conclusions regarding the relative usability of both tools”.
The fact that the tangible approach should be the overall winner is to be expected – being provided the sensation of physically manipulating elements of the content being created is arguably more direct than that of engineering the content via a complicated software suite. The surprise is the need to “go into more detail to come to meaningful conclusions”. If iaTAR were the more direct and engaging interface, it should demonstrate a clear trend toward this in all tests. But, as stated in the conclusion, this is far from the case. Despite being the overall “winner” in terms of speed, errors, intuitiveness and being fun to use; most users stated that they would still prefer to work with the traditional approach.
A similar study into immersive content authoring by Gun Lee9 showed similarly mixed results, and further research by Oakley Buchmann18 finds that an AR system for conducting geographic surveys again fails to deliver the expected usability gains.
Such results indicate that the relationship is an inequality rather than the traditionally assumed equality:
a s a
s i o o
i S S S
S
S≥ + + +
Consideration must therefore be given to the aspects of directness that are responsible for this inequality.
2.2
Tech Bias
Tech bias (T) is a measure of how well a given device succeeds in the role for which it is intended. Mature technologies are effective at providing their intended experience and as such have a high tech bias. Conversely, less commonplace technologies often have a relatively low tech bias.
[image:2.595.71.290.531.689.2]modern CRTs are generally of high resolution and have many colours and a high refresh rate, and modern mice track user’s input very accurately. These devices would therefore all exhibit a very high tech bias in the role described.
In a typical AR scenario, the user may wear a head mounted display (HMD) with an LCD display for each eye and an attached camera. The system will process the view from the camera, overlaying computer generated graphics on the scene and displaying the result to the user. In this case, the HMD’s intended role is to augment the user’s perceptions and give the impression that the imagery is actually present in the “real world”. Due to the relatively bad image quality and field of view of current HMDs, this sensation is not as strong as might be hoped, meaning that in this case the HMD will exhibit a very low tech bias. On the other hand, if the intended role of the HMD was to simply provide a stereoscopic image then its tech bias would be higher – although still not as high as in the case of a CRT display displaying a 2D image.
By assigning a value T:(0 < T < 1) for the tech bias of the gulfs of execution (Ti) and evaluation (To) we achieve the following:
+ = i i i i T S S
S s a
+ = o o o o T S S
S s a
The minimum attainable distance is therefore determined by the semantic and articulatory components, and the degree to which it is possible to achieve this theoretical minimum is governed by the tech bias of the hardware used.
This paper uses two layers of interaction – semantic and articulatory, but other common configurations could be used14, 15, 16, 17.
2.3
User Factors
DM is a relationship between the user and the system2. Therefore there is a need to take human factors into account. There are many user-related factors that may affect perceived distance, but the most important of these that may predictably be modelled is user experience. The user’s sense of directness will be inversely proportional to their level of experience1, 2 with the system because, as users become familiar with the interface, less cognitive effort is required to express their desires2. This is, in effect, an “acquired bridging” of the gulfs by the user.
F
U= 1
2.4
Index of Distance
These relationships can be expressed with two indexes. The first of these is the Index of Distance (S), which may be used on its own to predict the distance a proposed user interface may present. In most cases the primary aim of developing an interface is to minimise distance irrespective of user experience.
+ + + = o o o i i i T S S T S S
S s a s a
2.5
Index of Directness
The second index is the Index of Directness (D), which scales the index of distance by user familiarity
F:(0 < F < 1).
F S
D=
Which, when expanded, gives us the following:
+ + + × = o o o i i i T S S T S S F
D 1 s a s a
This describes how direct a given user perceives a given implementation of a given user interface to be, rather than an indication of the theoretical cognitive distance between the user and the interface.
This is an important measure when dealing with a specific, specialised user scenario, where the overall directness may be more relevant than the cognitive distance alone.
3
Application
Due to the inherent difficulties of deriving values for coefficients in the model, evaluation of indices using this model need to be relative rather than absolute. For example, an index of directness computed for one case can be directly compared with another, only when care is taken to use the same scales, assumptions and methodology in both cases.
3.1
Velocity of Mixed Distance
Interfaces
In applications where the user is exposed to “mixed distance interfaces”, various elements of the interface have differing distances.
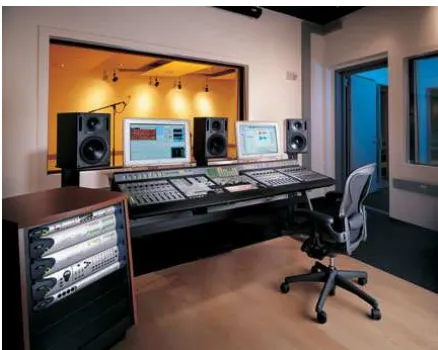
Figure 4: A typical recording studio configuration provides a good example of an effective mixed
distance user interface.
Such mixed-distance interfaces are a sensible approach to improving directness, as they allow a commonly used subset of tasks or operations to have a lessened cognitive distance without sacrificing the flexibility of a more traditional user interface for the less common tasks.
In such cases, it is useful to consider the change of distance that the user must overcome when switching focus between the interface elements. Such variations in distance within an interface can be described as “velocity”.
By taking a weighted average of the Index of Distance for each of the interface types, we can derive a single overall Index of Distance and Index of Directness for the whole interface. This in turn means the theoretically optimal “blend” of interface types can be determined using linear programming.
3.2
Inertia
If a user interface is significantly altered in order to improve distance, it must be determined if the gains in directness due to decreased distance are greater than the loss of directness caused by the decreased user familiarity. A small improvement in the distance of a system used by very expert users may not be enough to counter the expertise lost in changing the interface, resulting in a net loss of perceived directness to the user.
Thus, any reductions of distance in an existing user interface must be large enough to overcome the “inertia” of the users’ experience if it is to be a worthwhile improvement without requiring re-learning by the users.
For example, air traffic controllers spend a long time attaining expertise in using their systems. Because these systems are complex and because the safety of hundreds of lives relies on their effective use, there is much research on improving the user interfaces in
order to reduce distance. It would be possible to engineer a new interface that greatly reduced distance using the Index of Distance; but in doing so, much of the acquired directness of the system by the controller may be lost.
In this case the index of directness should be used instead, in order to assess the improvements in light of the inertia of the controller using the system. It is possible to argue that the primary focus should always be that of directness, as new systems may be re-learned and thus, with time, a new expertise may be joined with the decreased distance to achieve the most optimal possible usability. But consider that in some cases the user may have so much inertia that it is almost impossible to overcome.
For example, surgeons are provided important information via auditory cues during an operation, such as heart rate. Surgeons become so expert at using this system that their use of the interface is almost completely subconscious.
If the interface were re-engineered in such a way that this information was no longer provided, it could result in life-threatening performance decreases for the surgeon that are unable to be re-learned. Any replacement would in essence be a substitute, rather than a replacement, for the auditory approach.
4
Conclusion
This paper proposes a mathematical model for relating various aspects of Direct Manipulation in order to gain a better understanding of how to maximise perceived directness in user interfaces and design the most effective user interface.
The model introduces an “Index of Distance” and an “Index of Directness”, as well as the novel concepts of “tech bias”, “velocity”, “inertia” and a definition of “mixed user interfaces”.
The goal is to further understand how to optimise and quantitatively compare and predict user interfaces. This model is being further researched with the development and analysis of specific case studies for ongoing verification of the relationships described, identifying values for the various coefficients of the model by isolating each factor and to determine any further contributing factors to directness.
This research is also pursuing investigations to further define values for various coefficients to enable direct comparison of the case studies used.
5
References
[1] Shneiderman, B., “The Future of Interactive Systems and the Emergence of Direct Manipulation”, Behaviour and Information Technology 1982, v.1 n.3, pp. 237-256 [2] Hutchins, E. Hollan, J. Norman, D., "Direct
Manipulation Interfaces", Human-Computer Interaction, Volume 1, 1985. pp. 311-338 [3] Fitzmaurice, G. "Graspable User Interfaces",
Graduate Department of Computer Science, University of Toronto, 1996
[4] Ishii, H. and Ullmer, B., "Tangible Bits: Towards Seamless Interfaces between People, Bits and Atoms," Proceedings of Conference on Human Factors in Computing Systems (CHI '97), ACM, Atlanta, March 1997
[5] Fitzmaurice, G., Ishii, H., Buxton, W., "Bricks: Laying the Foundations for Graspable User Interfaces," Proceedings of Conference on Human Factors in Computing Systems (CHI '95), ACM, Denver, May 1995 [6] Antifakos, S. “Improving Interaction with Context-Aware Systems”, Selected Readings in Vision and Graphics, volume 35, 2005 [7] Ishii, H., Kobayashi, M., Grudin, J.
"Integration of Interpersonal Space and Shared Workspace: ClearBoard Design and Experiments," ACM Transactions on Information Systems (TOIS), ACM, Vol. 11, 1993
[8] Nelles, C. “Graphical vs Tangible User Interface”, unpublished PhD thesis, eingereicht am Fachochschul-Diplomstudiengang, Medientechnik und Design, Hagenburg, 2005
[9] Lee, G. “Immersive Authoring of Virtual Worlds”, Division of Electrical and Computer Engineering, Pohang University of Science and Tehcnology, Korea, 2005
[10] "Illuminating Clay: A 3-D Tangible Interface for Landscape Analysis"- Ben Piper, Carlo Ratti* and Hiroshi Ishii, CHI 2002, Conference on Human Factors in Computing Systems, Minneapolis, Minnesota 20-25 April 2002
[11] Rosenthal, M., A. State, J. Lee, G. Hirota, J. Ackerman, K. Keller, E. D. Pisano, M. Jiroutek, K. Muller, and H. Fuch - "Augmented Reality Guidance for Needle Biopsies: A Randomized, Controlled Trial in Phantoms," Proc. Medical Image Computing and Computer-Assisted Intervention 2001. [12] Fuchs, H., M. A. Livingston, R. Raskar, D.
Colucci, K. Keller, A. State, J. R. Crawford, P. Rademacher, S. H. Drake, and A. A. Meyer, MD. “Augmented Reality Visualization for Laparoscopic Surgery,” Proc. First International Conference on Medical Image Computing and Computer-Assisted Intervention, 934–943.
[13] State, A., M. A. Livingston, G. Hirota, W. F. Garrett, M. C. Whitton, H. Fuchs, and E. D. Pisano. “Technologies for Augmented-Reality Systems: Realizing Ultrasound-Guided Needle Biopsies.” Computer Graphics: Proc. SIGGRAPH ’96, 1996 [14] Frohlich, D, “The history and future of direct
manipulation" Behaviour & Information Technology 12, 6, 1993. pp. 315-329. [15] Neilsen, J, “A Layered Interaction Analysis
of Direct Manipulation”, 1992
[16] Hix, D. and Hartson, H., “Developing User Interfaces”. John Wiley & Sons, Inc, 1993 [17] Taylor, M., “Layered protocol for