Glossary
MASTER THESIS INDUSTRIAL ENGINEERING AND MANAGEMENT
Maximizing flexibility
through minimizing
changeover time
HEINEKEN brewery Zoeterwoude
N.W. Schreuder
I
Glossary
Glossary
Publication data:
June 2014
Author:
Niek Schreuder
II
Glossary
III
/Management summary
Management summary
As there is a declining trend in the beer market, Heineken Nederland Supply (HNS) needs to increase the innovation rate. Many markets introduce new pack types, designs, label changes etc. This results in a growing number of changeovers on the packaging lines.
Research proposal
To minimize the impact of the increasing trend of changeovers, the flexibility of the lines must increase. Therefore the management of Heineken Zoeterwoude asked for an investigation of the flexibility on the lines. In order to execute a successful research we focused this investigation to the ‘One way bottle lines’.
In this report there is a distinction between the production and planning perspective. From the planning perspective the focus is on the reliability of the plan, and a reduction of the frequency of the changeovers. From the production perspective, the improvement of the quality and the decrease of the duration of the changeovers have been investigated.
“The objective of this research is to analyze the planned down time losses generated by changeovers and to look for opportunities to minimize these losses. In addition, this research has to come up with a clear improvement for the losses due to changeovers.”
The main question guiding this research is:
What improvements can be made in the execution and planning of the changeovers on the packaging lines to minimize their total duration and maximize their quality in order to reduce the total (planned) downtime?
To answer the main research question above, this research comes up with a masterplan to improve the flexibility of the lines, clearly motivated by a structured analysis and research of the changeovers.
Research method
After an extended analysis of the current situation the factors that influence the changeovers are defined. Based on the stakeholders and literature these factors are prioritized. To enhance the relevant factors, a structured masterplan is developed based on the TPM philosophy and other literature.
Conclusions
Challenges
1) Over the year 2013 the available production time is affected by the changeovers with 5%. Over a period of one year this means more than 3600 hours. One hour downtime costed (on average) 250 euro. This means that the changeover costs are almost one million euro per year;
2) The check of the planning parameters of the changeovers isn’t performed on a regular basis. Therefore there is haziness around the real impact of the changeovers;
3) The execution of the changeovers isn’t checked on a regular basis. Therefore, the current performance of the execution of changeovers is unclear and improvements are difficult to realize.
4) The data registration is not reliable at the moment. Therefore the real duration of the changeovers is hard to get;
5) Over a period of six months (last part 2013 and beginning 2014) the label switch has the highest impact on the total changeover time. There are no clear standards, however, for the execution of a label switch;
IV
/Management summary
8) Based on their relevance and current state the relevant factors founded in the literature are analyzed on their relevance for Heineken. These relevant can be improved by the following main interventions; Standards, training and clear responsibilities for every stakeholder.
Recommendations
Long term
1) Develop a continual improvement by performing the 4 steps of the PDCA circle as follows
Plan: Defining masterplan (june 2014) a. Answer research questions
b. Fill in masterplan Planned Downtime-Pillar (TPM) c. Ask all stakeholders to be a part of the Pillar
d. Explain and check the check the masterplan together with stakeholders
Do: Give priorities to Masterplan and divide them over stakeholders (june 2014) a. Priorities brewery and stakeholders
b. Focus with the implementation
Check: Meetings PD-Pillar (september-december 2014)
a. Communicate together about the developments. b. Clear problem and targets
Act: Re-define priorities and set new deadlines for the masterplan (december 2014)
Short term
2) Team-leader rayon 2: In order to get more reliable data an organized report for the SMED-operator should be developed where the performance of the switches and changeovers can be discussed in the weekly meeting with special attention to data registration.
3) Rayon-manager rayon 3: In order to reduce the impact of the switches standards should be developed for every workplace;
4) Team-leader rayon 5: To restore the SMED-system in the right condition the organization over the line and the evaluation of the performance of the changeover must be define by the documents and training of the SMED system;
5) Senior scheduler & Analyst tactical planning: In order to produce a reliable planning for production the planners has to use reliable planning parameters. Therefore planning has to develop a
standard to check the difference between their planning and the realization of the planning on a regular basis;
6) TPM-facilitator: To use the right standards and reintroduce the SMED system, the training material and documentation of SMED has to be updated and structured;
7) Planned Downtime pillar leader: For further development and future World Class Performance, it is important to visit some other companies and breweries who are dealing with the same
(increasing) trend of changeovers;
8) Production specialist: As a part of the changeover the washing part is not optimal at the moment. The parameters of the washing procedure have to be redefined to save time.
General
9) Collaboration between planning and production is essential for the success of the Planned Down pillar. Therefore it is important to work, as Planned Down pillar, together with the Plan pillar.
V
/Glossary
Glossary
Abbreviation
Description
Colonne
Line
CS&C
Customer Service & Control
CS&L
Customer Service & Logistics
DCS
Daily control system
DFC
Design For Changeover
DFM
Design For Maintenance
DFQ
Design For Quality
DMADV
Define Measure Analysis Improve Verify
DMIAC
Define Measure Analysis Improve Control
FI
Focused Improvement
FTE
Full Time Employee
HNS
Heineken Nederland Supply
(K)PI
(Key) Performance Indicator
OEE
Overall Equipment Effectiveness
OPI
Operational Performance Indicator
OPI-NoNa
Time of 'good product' output (based on maximum speed) as percentage of
'effective working time'.
OTIF
On Time in Full
PDCA
Plan do check act
Pillar
The TPM methodology is divided in several pillars which consists out of a
multidisciplinary team which has its own focus on improvements
PM
Preventive Maintenance
Rayon
A rayon is part of the packaging department at the Zoeterwoude brewery which
contains one or more lines
RCM
Reliability Centred Maintenance
Shift
Employees of the brewery are working in shifts of 8 hours starting at 7 AM, 3 PM or
11 PM.
SMED
Single Minute Exchange of Dies
TPM
Total Productive Maintenance
TQC
Total Quality Control
TQM
Total Quality Control
VI
/Preface
Preface
This report is the indisputable evidence of my executed research at the Heineken brewery in Zoeterwoude in order to fulfil my master degree of Industrial Engineering and Management with the specialization track ‘Production, Logistics and Management’.
First of all, I want to thank all the people at Heineken who supported me with their cooperation, providing me with useful information. It was nice to experience the general willingness to help and the enthousiasm about their craft. Special thanks to my two supervisors from Heineken, Inge Schrama and Arjen van Diepen who gave me the freedom and opportunity to investigate my own findings and develop a suitable assignment. Furthermore, I want to thank my supervisors of the University of Twente, Peter Schuur and Sipke Hoekstra. They provided me with useful feedback being flexible and critical at the same time.
Of course I want to thank my family for their support during my whole study. Special thanks to Simone who trusted in me and give me the spirit to work hard.
Last and most important of all, I want to thank God Who gave me the strength each day for what I had to do. “I will lift up mine eyes unto the hills, from whence cometh my help. My help cometh from the
LORD, which made heaven and earth. “ (Psalms 121 verse 1,2)
VII
Table of Contents
Table of Contents
Glossary ... I
Management summary ... III
Glossary ... V
Preface ... VI
Table of Contents ... VII
Chapter 1: Research proposal ... 1
1.1 History and facts Heineken... 1
1.2 Research topic ... 2
1.3 Research questions... 3
1.4 Scope ... 4
1.5 Deliverables ... 4
1.6 Outline report ... 5
Chapter 2: Current situation ... 6
2.1 What are the main causes of downtime and what is their contribution to the total downtime?
...
Fout! Bladwijzer niet gedefinieerd.
2.1.1 OPI Composition ... Fout! Bladwijzer niet gedefinieerd.
2.1.2 Quantifying OPI aspects ... Fout! Bladwijzer niet gedefinieerd.
2.1.3 Conclusion question 1 ... Fout! Bladwijzer niet gedefinieerd.
2.2 How are the packaging lines organized? ...
Fout! Bladwijzer niet gedefinieerd.
2.2.1 One way bottle lines ... Fout! Bladwijzer niet gedefinieerd.
2.2.3 Organization lines ... Fout! Bladwijzer niet gedefinieerd.
2.2.4 Products per line ... Fout! Bladwijzer niet gedefinieerd.
2.2.5 Conclusion question 2 ... Fout! Bladwijzer niet gedefinieerd.
2.3 What are the different types of changeovers? ...
Fout! Bladwijzer niet gedefinieerd.
2.3.1 Product characteristics ... Fout! Bladwijzer niet gedefinieerd.
2.3.2 Different types of changeovers ... Fout! Bladwijzer niet gedefinieerd.
2.3.3 Online and offline changeovers ... Fout! Bladwijzer niet gedefinieerd.
2.3.4 Conclusion question 3 ... Fout! Bladwijzer niet gedefinieerd.
VIII
Table of Contents
2.4.3 Conclusion question 4 ... Fout! Bladwijzer niet gedefinieerd.
2.5 How is the quality of the changeovers on the packaging lines measured? ..
Fout! Bladwijzer niet
gedefinieerd.
2.5.1 Measured parameters ... Fout! Bladwijzer niet gedefinieerd.
2.5.2 Defining changeover quality ... Fout! Bladwijzer niet gedefinieerd.
2.5.3 Current way of measuring quality ... Fout! Bladwijzer niet gedefinieerd.
2.5.4 Conclusion question 5 ... Fout! Bladwijzer niet gedefinieerd.
2.6 How is the current planning system organized? ...
Fout! Bladwijzer niet gedefinieerd.
2.6.1 Tactical planning changeovers ... Fout! Bladwijzer niet gedefinieerd.
2.6.2 Operational planning (scheduling) changeovers ... Fout! Bladwijzer niet gedefinieerd.
2.6.3 Conclusion question 6 ... Fout! Bladwijzer niet gedefinieerd.
2.7 Conclusion chapter 2 ... 7
Chapter 3: Relevant factors ... 9
3.1 Which factors affect the impact of the changeovers on the throughput of the packaging lines?
...
Fout! Bladwijzer niet gedefinieerd.
3.1.1 Factors duration changeover ... Fout! Bladwijzer niet gedefinieerd.
3.1.2 Factors quality changeover ... Fout! Bladwijzer niet gedefinieerd.
3.1.3 Conclusion question 7 ... Fout! Bladwijzer niet gedefinieerd.
3.2 Which factors affect the total planned changeover time? ....
Fout! Bladwijzer niet gedefinieerd.
3.2.1 Factors tactical planning ... Fout! Bladwijzer niet gedefinieerd.
3.2.2 Factors scheduling ... Fout! Bladwijzer niet gedefinieerd.
3.2.3 Conclusion question 8 ... Fout! Bladwijzer niet gedefinieerd.
3.3 Which factors affect the impact of the changeovers based on the literature? ... 10
3.3.1 Improvement systems manufacturing ... 10
3.3.2 Total Productive Maintenance ... 12
3.3.3 TPM Heineken ... 15
3.3.4 FI-Pillar Heineken ... 16
3.3.5 Project management ... 17
3.3.8Conclusion question 9 ... 20
3.4 Conclusion chapter 3 ... 21
Chapter 4: Preferred situation ... 23
IX
Table of Contents
4.2 Which interventions improve the factors in order to decrease the total impact of the
changeovers on the throughput of the packaging lines? ...
Fout! Bladwijzer niet gedefinieerd.
4.2.1 Interventions factors with improvement potential ... Fout! Bladwijzer niet gedefinieerd.
4.2.2 Improvements ‘Plan’ ... Fout! Bladwijzer niet gedefinieerd.
4.2.3 Improvements ‘Do ... Fout! Bladwijzer niet gedefinieerd.
4.2.4 Improvements ‘Check’ ... Fout! Bladwijzer niet gedefinieerd.
4.2.5 Improvements ‘Act’ ... Fout! Bladwijzer niet gedefinieerd.
4.2.6 Conclusion question 11 ... Fout! Bladwijzer niet gedefinieerd.
4.3 Which steps have to be taken to achieve a world class level changeover performance? ...
Fout!
Bladwijzer niet gedefinieerd.
4.3.1 Overview steps ... Fout! Bladwijzer niet gedefinieerd.
4.3.2 Plan: Defining Masterplan ... Fout! Bladwijzer niet gedefinieerd.
4.3.3 Do: Give priorities and divide... Fout! Bladwijzer niet gedefinieerd.
4.3.4Check: Meetings PD-Pillar ... Fout! Bladwijzer niet gedefinieerd.
4.3.5 Act: Re-define priorities and set new deadlines for the masterplan ... Fout! Bladwijzer niet
gedefinieerd.
4.3.6 Conclusion question 12 ... Fout! Bladwijzer niet gedefinieerd.
4.4 Conclusion chapter 4 ... 24
Chapter 5: Conclusions and recommendations ... 26
5.1 Conclusions ... 26
5.2 Recommendations... 27
5.3 Results ... 29
5.4 Evaluation ...
Fout! Bladwijzer niet gedefinieerd.
References ... 30
Appendix 1: Data problems ... 32
Problems data reliability... 32
Refresh and check all the planning parameters ... 35
Appendix 2: Boxplot analyse ... 38
Appendix 3: TPM Routes FI changeover ... 72
1
Chapter 1: Research proposal
•History HEINEKEN •Brewery Zoeterwoude Intro company (§1.1) •Problem description •Objective •Research questions Context research
(§1.2-3) •Research scope
•Deliverables •Outline report
Scope and Outline(§1.1)
Chapter 1: Research proposal
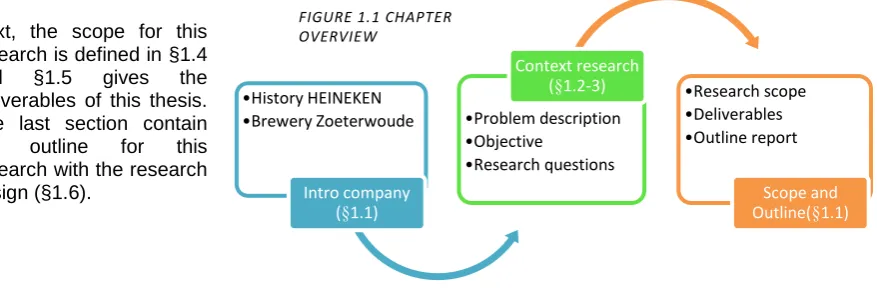
This chapter contains the research proposal for a master thesis of the master Industrial Engineering and Management at the University Twente. The main subject of this research is about changeovers at the Heineken Company in Zoeterwoude.
The chapter starts with a short introduction of HEINEKEN (§1.1). In §1.2 the research topic is described with a short problem description and the main objective of the research. In §1.3 the main research question and the sub questions are revealed.
Next, the scope for this research is defined in §1.4 and §1.5 gives the deliverables of this thesis. The last section contain the outline for this research with the research design (§1.6).
1.1 History and facts Heineken
Heineken is one of the leading companies in the brewery industry worldwide. They have an annual turnover of more than 18 billion euros and employ 76.191 people of which 4.053 FTE’s are working in the Netherlands. The rich history of Heineken dates back to 1864, the year when the company was founded. In 1928 Heineken started to become a truly international player, starting with export to Asia in 1929 and to the United States in 1933. In the past 15 years numerous mergers and acquisition changed the brewery landscape significantly, resulting in an increase in market share for the 4 main global players from 22% in 2000 to 41% in 2012.The most recent major acquisition was in 2012, when Heineken acquired APB (Asian Pacific Breweries). Today, Heineken has 165 breweries worldwide, serving customers in no less than 178 countries.
Besides Heineken, the world’s leading brand in the International Premium Segment (IPS), the company offers an extensive range of products comprising approximately 250 brands (some examples in figure 1.2), including various beers, cider and other beverages. The export of Heineken beer almost a century ago created a solid foundation for becoming a strong international brand. In addition, Heineken has many global marketing campaigns that maintain its global and premium image and to outperform its competitors. This is why Heineken is by far the beer with the highest export volume throughout the world, accounting for 29.1 million HL.
Brewery Zoeterwoude
More than 10 million hectoliters of beer is brewed within the Netherlands to be transported over the globe. In total, this is about 7% of the HEINEKEN beer volume worldwide.
[image:11.595.86.525.186.331.2]The beer is brewed and packed in three breweries in Zoeterwoude, Den Bosch and Wijlre and then transported to the customer by different means of transport. The breweries produce the Heineken brands in all kinds of packing types and for all kinds of
FIGURE 1.1 CHAPTER OVERVIEW
[image:11.595.280.528.574.734.2]2
Chapter 1: Research proposal
The brewery at Zoeterwoude is divided into five divisions: brewing, packaging, technical service, service business technology and Safety, Environment & Health. The organization of the brewery is displayed in figure 1.3.
1.
2 Research topic
Because of the declining trend in the beer market HEINEKEN needs to increase the innovation rate. Many markets introduce new pack types, designs, label changes etc. This results in an increase in the number of changeovers on the packaging lines.
“The increase of changeovers has a negative impact on the production capacity.”
To minimize the impact of this increasing trend of changeovers a thorough research is needed. This can be done from two perspectives. In this report the distinction will be made between a production and planning perspective. Figure 1.4 visualizes the two different perspectives
The planning perspective looks to the planning point of view and focuses on the reduction of the frequency of the changeovers. The production perspective looks from the production point of view and focuses on the improvement of the quality and the decrease of the duration of the changeovers. Both perspectives will be included in the research project.
“The objective of this research is to analyze the planned down time losses generated by changeovers and to look for opportunities to minimize these losses. In addition, this research has to come up with a clear improvement for the losses due to changeovers.”
Figure 1.5 gives a visual explanation of the trend in Heineken Zoeterwoude. The increasing complexity and number of New Product Innovations (NPI’s) require a higher level of flexibility which means more changeovers.
Zoeterwoude brewery
Brewing Packing Technical service Service business technology
Safety, Environment &
Health Secretary
FIGURE 1.3 ORGANISATION CHART HEINEKEN ZOETERWOUDE
[image:12.595.210.390.621.770.2]FIGURE 1.4 RESEARCH TOPIC
3
Chapter 1: Research proposal
1.
3 Research questions
The main question guiding this research is:
What improvements can be made in the execution and planning of the changeovers on the packaging lines to minimize their total duration and maximize their quality in order to reduce the total (planned) downtime?
There are several different stages to answer the main research question, visualized in figure 1.6. First of all the packaging lines are described shortly. Then the data is analyzed to get a clear view of the current down time. After the current situation is clear the factors that can judge the current situation are defined and used to judge the current situation and make a current performance. After that this research will give some the possible improvements.
FIGURE 1.6 STAGES RESEARCH
In order to answer the main research question 10 sub-questions will be answered.
Current situation and analysis (Ch. 2):
1. What is the contribution of the changeover time to the total downtime?
Production
2. How are the packaging lines organized? 3. What are the different types of changeovers?
4. What is the frequency and duration of the changeovers on the packaging lines? 5. How is the quality of the changeovers on the packaging lines measured?
Planning
6. How is the current planning system organized?
Relevant factors/variables (Ch. 3):
7. Which factors affect the impact of the changeovers on the throughput of the packaging lines? 8. Which factors affect the total planned changeover time?
Literature study
9. Which factors affect the impact of the changeovers based on the literature?
Preferred situation (Ch. 4):
10. Which improvements are most relevant and applicable for Heineken?
11. Which interventions improve the factors in order to decrease the impact of the changeovers on the throughput of the packaging lines?
12. Which steps have to be taken to achieve a world class level changeover performance
Current
situation &
Analysis
Relevant
factors
Preferred
situation
Conclusions
4
Chapter 1: Research proposal
1.4 Scope
Changeover time
Because of the declining trend in the beer market HEINEKEN needs to increase the innovation rate. Therefore, in many markets they are introducing new packaging types, designs, label changes etc. more often. This results in an increase in the number of changeovers on the packaging lines and a decreasing length of the runs.
This research focuses on the impact of the changeovers on the planning and on the production lines.
One way bottle lines
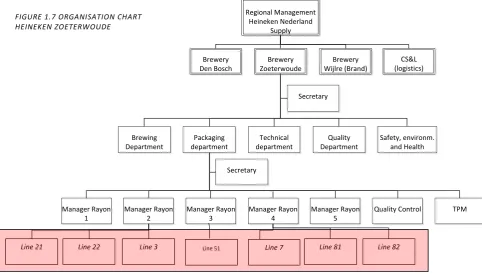
To limit the size of this investigation this research will only focus on the ‘One way bottle lines’ in Zoeterwoude. A ‘One way bottle line’ is a line that produces bottles for the export markets. They call it a ‘one way line’ because the empty bottles don’t come back. Since these export markets were always quite constant, the batch sizes on these lines were very long. The new development of new introductions and changes to these products are a big change for these lines. Figure 1.7 shows the seven one way bottle lines.
Regional Management Heineken Nederland Supply Brewery Zoeterwoude Brewery Wijlre (Brand) Brewery Den Bosch Technical department Quality Department Packaging department Safety, environm. and Health Brewing Department Secretary Manager Rayon 4 Manager Rayon 5 Manager Rayon 3 Quality Control Manager Rayon 2 TPM Manager Rayon 1 Secretary CS&L (logistics)
Line 21 Line 22 Line 3 Line 51 Line 7 Line 81 Line 82
1.5 Deliverables
The purpose of this research is to analyze the planned down time losses generated by changeovers and to look for opportunities for improvement. In addition, this research has to come up with a clear improvement for the losses due to changeovers.
The deliverables will therefore include:
1. Research on the planned downtime of production lines
[image:14.595.71.554.279.553.2]2. Analysis of the number of changeovers, the duration, the frequency, the complexity and the startup curve after the changeover to define the priority workplaces to start improving 3. Proposal with solution directions and key findings to reduce the planned down time 4. Implementation and developing of a masterplan ‘planned downtime’
5
Chapter 1: Research proposal
1.6 Outline report
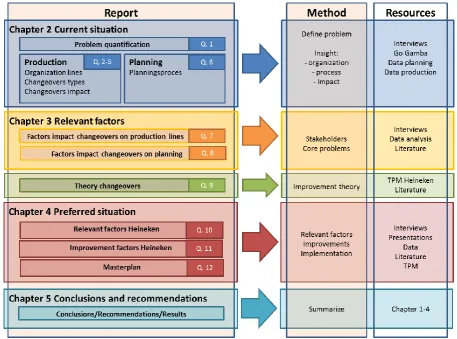
Figure 1.8 shows the outline of this research with the different chapters and questions which are answered in these chapters. Furthermore the method and used resources are mentioned in the right part of the figure.
[image:15.595.69.527.157.496.2]6
Chapter 2: Current situation
•Downtime •OPI composition
Problem quatification (§2.1)
•Organisation lines •Changeover types •Duration & Quality
Process analysis §2.2-2.5)
•Tactical planning •Scheduling
Planning (§2.6)
Chapter 2: Current situation
In order to get some insight in the problems and possible improvements for the changeovers this chapter explains the current situation at the Heineken Company in Zoeterwoude. It begins with a problem quantification to get some insight in the impact of the subject. After that a process analysis is done to understand of the process and get more detailed insight about the changeovers. Furthermore the planning process is explained. In this chapter the answer is given to the first six sub-questions.
In the first section (§2.1) the main causes of downtime and their contribution to the total downtime are given. In §2.2 the organization of the lines is shortly described. In §2.3 the different types of changeover are described. In §2.4 the frequency and the duration of the different changeovers are analyzed. In §2.5 the quality of a changeover is described. Section 2.6 gives insight in the current planning system.
7
Chapter 2: Current situation
2.7 Conclusion chapter 2
This chapter has explained the current situation of the Heineken Company in Zoeterwoude with respect to planning and execution of the changeovers on the one way bottle lines.
Problem quantification
The planned downtime is 9% of the total time available (manned time). Changeovers are part of this planned downtime with a total of 5%. This means that yearly 3600 hours is spend on changeovers over the one way bottle lines in Zoeterwoude and Den Bosch. One hour downtime cost (on average) 250 euro which gives an approximate total costs of almost one million euro per year.
Process analysis
Based on activities on the different machines on the lines and the different types of products we conclude that the 21, 22, 03 and 07 are the ‘changeover-lines’. In general they have the most changeovers.
The different changeovers are divided by code with 7 binary numbers which give insight in the type of changeovers. Based on this code the frequency and duration of the different changeovers is analyzed. The label switch and the label switch in combination with a carton change are the two changeovers with the highest frequency.
Because the realization of the time needed for the changeover is hard to get we take average of the planned times as an approximation for the duration of the changeovers. With these approximation we calculated the total changeover time per changeover type. We conclude that the label switch is also the changeover type with the highest total changeover time.
The quality of the changeovers is measured by 7 variables. Unfortunately it is hard to measure their current performance because the data is not reliable. At the moment the most common way to measure the quality of the changeover is the number of short stops per hour. On line 3 this is measured per hour by the operators for 10 hours after the changeovers.
Planning
Tactical planning calculates the production time on basis of global averages of the total planned downtime and changeover-time and several other values. They discuss these planning parameter with the rayon-managers of production. Based on these parameters and forecasting they make a plan for the coming 13 weeks. On Tuesday, when tactical planning has calculated the production, they fill the software program of scheduling ‘AS’ and give it to scheduling.
9
Chapter 3: Relevant factors
Chapter 3: Relevant factors
This chapter explains the relevant factors with respect to the changeovers. Answer is given to the two sub-questions about the factors.
First of all the factors which have an impact on the throughput of the packaging lines are defined (§3.1). The second section gives insight in the factors which influence the planning of the changeovers (§3.2). The last section gives insight in the factors which influence the changeovers based on the literature (§3.3).
•Duration changeover •Quality changeover
Production factors (§3.1)
•Scheduling •Tactical planning
Planning factors (§3.2)
•TPM general •TPM Heineken •Other aspects
Literature factors (§3.3)
10
Chapter 3: Relevant factors
3.3 Which factors affect the impact of the changeovers based on the literature?
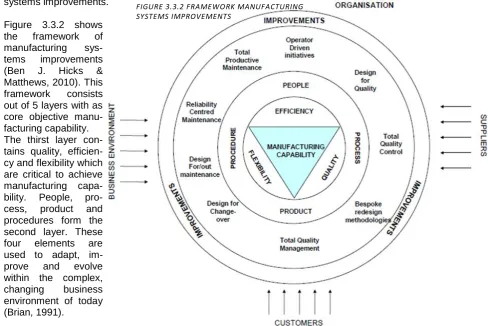
First of all an overview is given of the improvement systems of manufacturing. Secondly the improvement method TPM is discussed in general and the usage of TPM inside Heineken is explained. Furthermore several other subjects are researched on their impact on the changeovers.Figure 3.3.1 gives an overview of these different subjects. From the manufacturing systems improvement of Hick and Matthew (2010) TPM and PDCA are further explained. Also the usage of TPM at Heineken is discussed.
Furthermore we found some literature interesting because of their practical usage during the execution of this research. This literature has to do with project management and data management.
3.3.1 Improvement systems manufacturing
In order to get an overview of the paradigms for manufacturing systems improvement we use the investigation of Hicks and Matthews (2010). These researchers researched the causes of failed implementations, using these different paradigms. For this investigation they used a framework of methods and tools. This framework is based on all relevant earlier researches about manufacturing systems improvements.
[image:20.595.67.556.404.730.2]Figure 3.3.2 shows the framework of manufacturing sys-tems improvements (Ben J. Hicks & Matthews, 2010).This framework consists out of 5 layers with as core objective manu-facturing capability. The thirst layer con-tains quality, efficien-cy and flexibility which are critical to achieve manufacturing capa-bility. People, pro-cess, product and procedures form the second layer. These four elements are used to adapt, im-prove and evolve within the complex, changing business environment of today
FIGURE 3.3.2 FRAMEWORK MANUFACTURING SYSTEMS IMPROVEMENTS
11
Chapter 3: Relevant factors
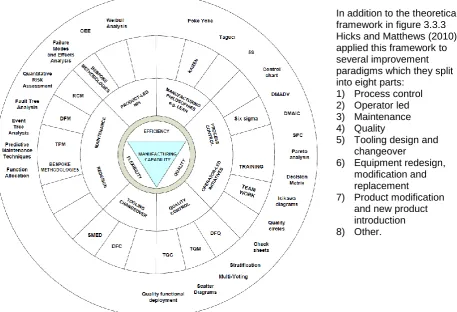
In addition to the theoretical framework in figure 3.3.3 Hicks and Matthews (2010) applied this framework to several improvement paradigms which they split into eight parts:
1) Process control 2) Operator led 3) Maintenance 4) Quality
5) Tooling design and changeover
6) Equipment redesign, modification and replacement 7) Product modification
and new product introduction 8) Other.
Figure 3.3.3 has the same core and first layer as the theoretical framework. The eight paradigms stated above form the second layer. The third layer supplements the second layer with the accompanying methods and the fourth layer contains their corresponding tools. The eight paradigms are shortly described below.
1) Process control.
Because the levels of automation (of changeovers and machine setup) increase it is necessary to explicitly define parameters an setup rules. Although there are several successful examples of intelligent monitoring and controlling (Hou, Liu, & Lin, 2003; Landers, Liang, & Hecker, 2004; Murdock & Hayes-Roth, 1991; Uraikul, Chan, & Tontiwachwuthikul, 2000) it requires profound knowledge of the relationship (upstream and downstream) between product variation and process variation.
2) Operator-led.
Successful training of the staff is an important element to the effective manufacturing process. An effective training gives an in-depth understanding of the content to develop a common and shared understanding across all the trainees in order to generate the same intended learning outcome(s) (Adebanjo & Kehoe, 2001; Davis, Davis, & Van Wert, 1998).
3) Maintenance.
[image:21.595.60.518.89.401.2]Especially in today’s just-in-time production environment with the reduced stock levels, maintenance (corrective and preventive) is important (Eti et al. 2006). Design for Service (DfS), Total Productivity Maintenance (TPM) and Reliability Centered Maintenance (RCM) are some of the approaches for these types of maintenance. The use of this approach depends on the understanding of the function of the process, the influence of machine settings on process performance, the impact of wear on the process, and the effect of operating conditions (Ben J. Hicks & Matthews, 2010).
12
Chapter 3: Relevant factors
5) Tooling design and changeover.
“The ultimate aim of improving tooling design is to improve production performance and in particular flexibility without compromising efficiency.” (Ben J. Hicks & Matthews, 2010).Two examples of methods using this principle are Single-Minute Exchange of Die (SMED) (Shingo, 1985) and Design for Changeover (DFC) (McIntosh, Culley, Mileham, & Owen, 2001). Hereby it is important to specify in advance the range of variation that is necessary to determine the most appropriate design or configuration of tooling in order to process all product variances and minimize the number of changeover and/or changeover time. The design is defined both in terms of physical geometry (size, profile and number of) and control of the tooling (kinematics - motion, velocity and acceleration, timing and clearances) (B. J. Hicks, Medland, & Mullineux, 2001).
6) Equipment redesign, modification and replacement.
Where an increase in manufacturing capability has the consequence that the equipment is not sufficient anymore it must be modified or redesigned (Ding, Matthews, McMahon, & Mullineux, 2009; Matthews, Singh, Mullineux, & Medland, 2007). The factors that determine the limitations of the current equipment must be converted to rules which are necessary for successful improvement manufacturing capability.
7) Product modification and new product introduction.
In today’s market new sizes, materials and modified configurations are quite common. Central to achieving these changes is the need to determine the machine settings that enable the product to be produced. Both, the determination of settings for a new product and the improvement in process capability through product modification give the need to understand the capability of the production process and its relationship with the properties and characteristics of the product (Frey, Wysocki, & Otto, 2000).
8) Other philosophies.
In addition to the seven areas mentioned above there are a number of philosophies existing to support improvements in manufacturing and management. Lean thinking and Business Process Reengineering are the two most common used. The term ‘lean’ describes the main aim of the philosophy, the reduction of waste throughout a company’s value stream (Womack, Jones, & Roos, 2007). Elimination of waste guarantees that every part of the value stream (process) adds value to the product. In contrast to lean, business process reengineering (BPR) focuses on improving the efficiency and effectiveness of the overall business processes that exist within and across an organization (Hammer & Champy, 1993).By assigning responsibility for those processes to teams and systems this effectiveness is achieved.
This section gives an overview of all the improvement systems manufacturing. Because Heineken uses Total Productive Maintenance (TPM) as improvement methodology, the next section will discuss the development and usage of TPM in general.
3.
3.2 Total Productive Maintenance
Total Productive Maintenance (TPM) is a maintenance methodology which is developed in Japan (Nakajima,1988). Nakajima (1988) gave the following description: “TPM has been accepted as the most promising strategy for improving maintenance performance in order to succeed in a highly demanding market arena”. Tsuchiya (1992) defined TPM as follows: “TPM is designed to maximize equipment effectiveness (improving overall efficiency) by establishing a comprehensive productive-maintenance system covering the entire life of the equipment, spanning all equipment-related fields (planning, use, maintenance, etc.) and, with the participation of all employees from top management down to shop-floor workers, to promote productive maintenance through motivation management or voluntary small-group activities.”(Tsuchiya, 1992). Nowadays the methodology is still a very useful and successful manufacturing strategy, for achieving core competence in the competitive environment (Ahuja, Singh, Sushil, & Wadood, 2004).
13
Chapter 3: Relevant factors
maintenance personnel (McKone, Schroeder, & Cua, 1999). The long term approach focuses on new equipment design and elimination of sources of lost equipment time. Nakajima (1988) defined TPM as: “an approach to maintenance that optimizes equipment effectiveness, eliminates breakdowns, and promotes autonomous maintenance by operators through day-to-day activities involving the total workforce.” So the underlying fundament of the maintenance part of TPM seems to be a structured basis for continual improvement of the production effectiveness.
TPM as management principle
Nowadays TPM is not just a maintenance program but an effective management principle. This management principle can be devided into five different parts (Waeyenbergh & Pintelon, 2002).
The goal of TPM is to maximize the efficiency , and improve the overall effectiveness of the equipment.
TPM gives an entire productive maintenance program for the whole lifetime of equipment. TPM stimulates the participation of all the different stakeholoders in the whole organisation
and focusses on teambuilding.
TPM has influence on all levels of the organization; from the production floor operators to the top management.
TPM promotes productive maintenance and implement autonomous maintenance.
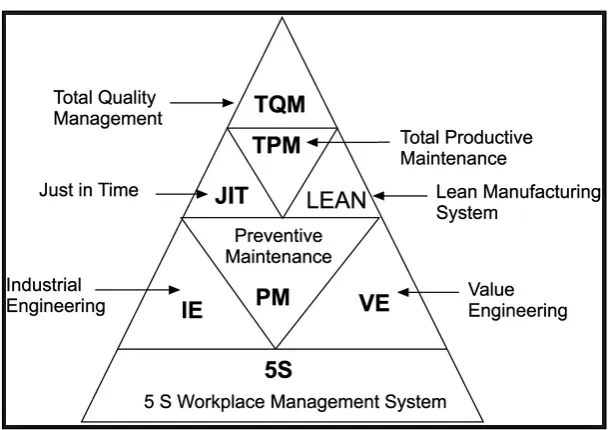
The concepts of Six Sigma, Lean manufacturing and TQM are combined in the philosophy of TPM. TPM continuously manage, optimize and improve a supply chain by eliminating all losses, involving all employees of the organization (Ahuja et al., 2004). The major differences between TPM and other concepts is that the operators are also made to involve in the process; it is not just a method for the maintenance department, the whole company needs to be involved (Chan, Lau, Ip, Chan, & Kong, 2005). Ahuja & Kamba (2008) state that the TPM methodology forms the corner stone activity of Lean manufacturing. Figure 3.3.4 shows the relationships between Lean philosophies and TPM.
TPM has several pillars which are the basis of the methodology. The 5S forms the foundation for the TPM pillars and they are required for implementing TPM (Venkatesh, 2005; Assen et al., 2007). These are the 5S:
- Sorting (Seiri): eliminate all unnecessary tools, parts and elements by sorting the essential ones.
[image:23.595.124.429.395.610.2]- Straightening (Seiton): Arrange all tools in standard order to eliminate waste to find a tool - Sweeping (Seiso): A clean workplace gives insight in the way things are organized
14
Chapter 3: Relevant factors
TPM Pillars
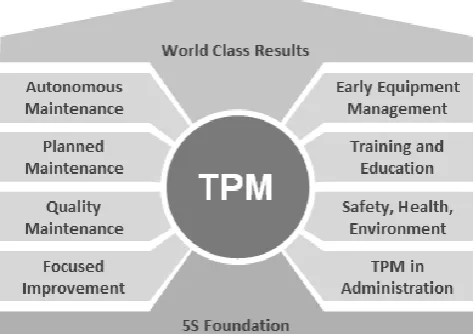
TPM consists of eight different pillars and, as mentioned before, based on the 5S. There are eight commonly used pillars; autonomous maintenance, focused improvement, planned maintenance, quality maintenance, education and training, safety, health and environment, office TPM, and development management (Rodrigues, Hatakeyama 2006).
Figure 3.3.5 gives a graphical presentation of the pillars. The different pillars together are the basis for World Class Results.
Some of the main results of successful TPM implementations are a longer equipment life, lower maintenance costs and therefore also lower operating costs. There is a method to score all aspects of the equipment manufacturing in one measurement. This system is called Overall Equipment Effectiveness (OEE) and help to check the current performance.
Autonomous maintenance (AM) : This pillar focuses on the development of operators to take care of several maintenance tasks. This means that the maintenance people have more time to do their specialized maintenance (or there are less specialized maintenance people needed). Examples of tasks the operators can do are cleaning, lubricating, tightening and inspection.
Focused improvement (FI): This pillar performs analysis to identify the different forms of loss types at a strategic level. It divides their TPM deployments over several autonomous teams who eliminate the losses. Therefore the pillars trust their workforce to achieve the objective by using the right skills and motivation.
Planned maintenance (PM): Planned maintenance focuses on the development from a reactive approach to a proactive method. Hereby the maintenance specialists can help the operators to do the maintenance as well as possible.
Quality maintenance (QM): This pillar has as goal to deliver the highest quality by producing with zero defects. Hereby is a focus on the tracking of the root causes of the (equipment) problems. By checking the conditions of the machines and time between defect standard values are achieved to avoid break downs. Also there is the trend from reactive to a proactive approach.
Training and Education (T&E): The goal of good, motivated, multi-skilled employees with objectives corresponding to the organization goals can only be achieved by the right training and education. Not only know what to do but also why is important. These skills and trainings have to be evaluated and updated periodically.
Safety, health and environment (SHE): This pillar has to ensure a safe working environment for all the staff in the organization. They want to eliminate the incidents, injuries and accidents. Therefore they make standard operating procedures.
TPM office: The TPM office have to coordinate the communication between the different pillars with a focus on productivity and efficiency in the administrative functions. They also apply the 5S in the office working areas. Of course the TPM department is also responsible for the measurement of the TPM performance.
[image:24.595.282.520.85.252.2]Development management (DM): This pillar works to minimize the problems of introducing new product on new equipment. They try to learn from existing developments on the current systems to
15
Chapter 3: Relevant factors
WCOM
Lean Management Total Productive
Maintenance Six Sigma
Employee Development
Change in Working Culture
Better Processes
(Zero Loss) Result
3.3.3 TPM Heineken
Heineken wanted to improve the effective use of their resources. They want to create a perfect process and an excellent way of working. In order to accomplish these targets they need a process of continuous improvement. Therefore the started in 2003 with the implementation of TPM in the brewery in Zoeterwoude
The four phases are of implementation are: 1) Preparation
2) Pilot 3) Expansion 4) Stabilization
Current situation TPM
Based on these phases, Heineken developed criteria for 3 awards: bronze, silver and gold. For the bronze award all pillars must be developed completely. The Zoeterwoude brewery gained the Bronze Award in 2013. The Silver award can be obtained by showing good results, based on trained employees. The Gold award can be obtained by showing the ability to perform at a World Class Brewery Organization (WCBO) level.
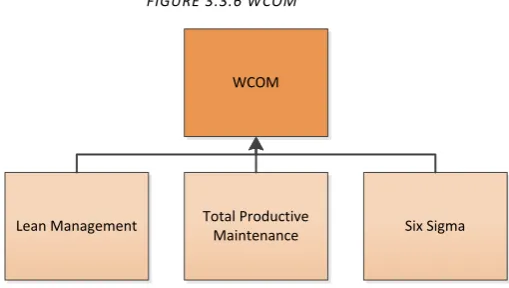
the aim of TPM at Heineken is to perceive one common language for running operations and improvement of processes. TPM at Heineken is the methodology for achieving: World Class Operations Management (WCOM).
The three pillars of WCOM at Heineken consist of Lean Management, TPM and Six Sigma. In the years following 2003, the TPM methodology is tested and fine-tuned for the Heineken organization.
By structuring processes, setting up standards and by minimizing waste, the variability in production performance will be minimized. Looking at the supply chain, this has an enormous impact on suppliers, in-house stakeholders and customers.
TPM focuses first on the basis of the production company. A good basis is necessary for further improvements and final results will also come. By training employees (People Development Pillar) in the TPM-philosophy of continuous improvement and preventive maintenance, the aim is to create a mind-shift in the working culture(TPM-Heineken, 2010).
This culture shift will lead to better processes with a zero-loss goal. And better processes will enable the organization to perform at its best.
[image:25.595.273.528.336.480.2]In order to get shopfloor excellence through developing the culture they use several different methods (5S, AM/PM, DCS). Importantly, this development is a continual process.
FIGURE 3.3.6 WCOM
16
Chapter 3: Relevant factors
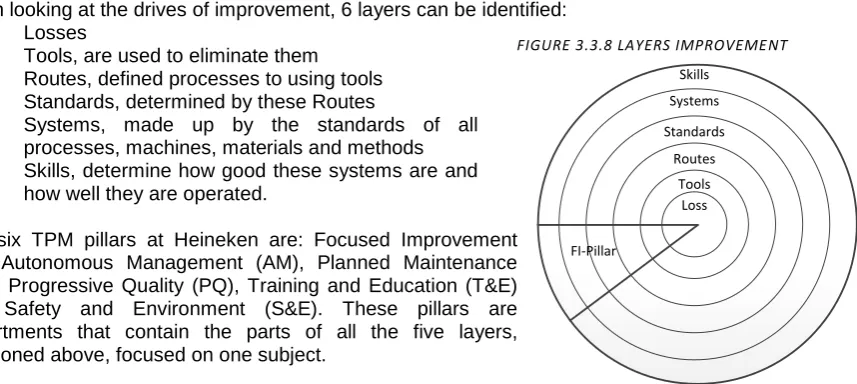
Loss Tools Routes Standards Systems Skills FI-Pillar
When looking at the drives of improvement, 6 layers can be identified: - Losses
- Tools, are used to eliminate them
- Routes, defined processes to using tools - Standards, determined by these Routes
- Systems, made up by the standards of all processes, machines, materials and methods - Skills, determine how good these systems are and
how well they are operated.
The six TPM pillars at Heineken are: Focused Improvement (FI), Autonomous Management (AM), Planned Maintenance (PM), Progressive Quality (PQ), Training and Education (T&E) and Safety and Environment (S&E). These pillars are departments that contain the parts of all the five layers, mentioned above, focused on one subject.
Figure 3.3.8 shows the structure of the organization and the place of the pillar. As a consequence of the new structure, all production lines interfere with the pillars. By performing the processes in the different pillars, the organization can improve its skills.
With these skills, the production line can improve its processes and consequently its performance, therefore increasing result. This structure also has the advantage that the lines communication and collaborate with each other which means that the best practices of the lines are shared.
3.3.4 FI-Pillar Heineken
The improvement method TPM consists out of several pillars which can be divided into several layers (see figure 3.1.1). The pillar where changeover time belongs to is the Focuses Improvement-Pilaar (FI). This pillar has several different steps where the planned downtime belongs to step 2; ‘Standardize, deploy and attack planned activities’ which consists out of 4 different steps.
1) Restore basic conditions
2) Define visual management standards for the site
3) Deploy line/machine losses and define priorities for improvement
4) Manage horizontal expansion of solutions and long term actions to achieve world class level.
These steps first of all focus on the work standards, then the visual standards and good practices, then the data deployment and Pareto analysis and the last step is to retain the improvements and keep further improving.
SMED: COTR Team Route)
In order to get a more detailed view of the vision of TPM figure 3.1.2 shows the roadmap of a ‘Change Over Time Reduction’ team (COTR-team). Based on the steps there are several factors which are important for changeovers.
The COTR Team reduction route steps 2 till 6 are interesting with respect to the question answering in this section. Step 2 suggests that it is important to have some insight in the performance of the current changeovers and emphasis the need for good data and a performance checker.
[image:26.595.95.524.72.264.2]Step 3 shows the importance of standards and dividing the changeover into three categories; pre,- internal and post-changeover.
[image:26.595.395.537.543.790.2]FIGURE 3.3.8 LAYERS IMPROVEMENT
17
Chapter 3: Relevant factors
Pillar
Production Line Result
Skills
Production Line Result
Production Line Result
sustainability of the solutions and improvements and looks for horizontal expansion of the good/best practices.
TPM tools
Inside Heineken there are several commonly used tools. Table 3.3.1 shows these tools with their objective.
Objective Tools
Standardize improvement method Kaizen
Minimize changeover time Single minute exchange of die (SMED)
Finding main problem 5x why
Solving main problem Break down analysis (BDA)
Reduction minor stops Minor stop analysis sheet(MSAS)
Eliminate chance errors Poka Yoke
Improve quality Six sigma
Improve effectiveness operator Team Effectiveness inventory(TEI)
Find category problem 4M Method
Knowledge management One point lessen(OPL)
Optimizing location CILT
Increase safety Almost accident labels
These tools are commonly used because they are simple to use because of their stepwise approach. They also need a multidisciplinary team that increases the chance of success (Eti, Ogaji, & Probert, 2004).
Masterplan
The FI-Pilaar consists out of several steps. The second step is the planned downtime with the changeovers. This step can be divided in the following steps and sub steps which are summarized in a masterplan (TPM-Heineken, 2010)
1) Restore basic conditions
1.1 Re-introduction of the importance of standards 1.2 Collect standards and check them
1.3 Re-introduce standards if necessary 1.4 Implement standards/ sops
2) Define visual management standards for the site
2.1 Get insight in standard for visualisation 2.2 Determine visual standards for the future (communicate with AM, PM, PQ)
2.3 Look for new standards and ideas (Poka Yoke, etc.)
2.4 Look in organization for best practices line/machine/product
3) Deploy line/machine losses and define priorities for improvement
3.1 Loss-deployment for product/line/machine 3.2 Define priorities for improvement
3.3 Improve standards using appropriate standards
4) Manage horizontal expansion of solutions and long term actions to achieve world class level. 4.1 Knowledge management
[image:27.595.67.537.154.322.2]4.2 World class level
[image:27.595.74.560.444.661.2]18
Chapter 3: Relevant factors
PDCA Circle
The plan-do-check-act (PDCA) cycle is a well-known model for continual process improvement. It teaches organizations a structured method by following these four steps; plan an action, do it, check to see how it conforms to the plan and act on what has been learned (Johnson, 2002). Since the model is applicable to all types of organizations and to all groups and levels in an
Organization the model supports improvement efforts in a full range from the very informal to the most complex (e.g. introduction of a new product line or service for a major organization) (Moen & Norman, 2006).
The PDCA cycle enables two types of corrective action,
temporary and permanent. The temporary action is aimed at results by practically tackling and fixing the problem. The permanent corrective action, on the other hand, consists of investigation and eliminating the root causes and thus targets the sustainability of the improved process(Sokovic, Pavletic, & Pipan, 2010). This is why the PDCA cycle is effective in both doing a job and managing a program.
The four steps for improvement or change in the PDCA cycle are: 1. Plan: Recognize an opportunity, and plan the change.
2. Do: Test the change.
3. Check: Review the test, analyze the results and identify learn-tings.
4. Act: Take action based on what you learned in the check step. If the change was successful,
incorporate the learnings from the test into wider changes. If not, go through the cycle again with a different plan.
The continual application of the PDCA cycle has been found far more effective than adopting “the right first time” approach. Deming's PDCA cycle is also the most appropriate method to use in this case because of the effectiveness in the development and deployment of quality policies. Other continuous improvement tools as DMAIC (Six Sigma) and DMADV (DFSS) focuses more on the project life-cycle (PLC) and the implementation and close-out of Six Sigma projects(Sokovic et al., 2010).
Stakeholder engagement
Today almost every project takes place in a context where stakeholders play a major role in the accomplishment of the tasks. Often the project is sensitive to actions and decisions taken by the stakeholder (Karlsen, 2002). In order to implement a project or program it is necessary to think about the stakeholders which are involved and who have influence on the final result.
“Large-scale supply management initiatives can easily fail when they neglect to engage key stakeholders early and often. Too often, project
teams sped months gathering data and
developing strategies that are never implemented due to insufficient internal and external support. The key is to follow a disciplined process for identifying, wooing an continuing to engage stakeholders” (Sharma, 2008).
[image:28.595.373.514.74.216.2] [image:28.595.306.532.531.758.2]Figure 3.3.11 shows a stakeholder prioritization matrix with four categories. The categories are based on the influence and the support of the stakeholders. When these two variables are high it is necessary to engage this stakeholder actively in the plans because they can seriously harm or
FIGURE 3.3.10 PDCA CIRCLE
19
Chapter 3: Relevant factors
1) Get to know your stakeholders (vertical and horizontal in the organization) 2) Engage as early as possible (in phase that changes in plan are quite easy)
3) Listen with both ears open (take opinions serious, also when they are not in line with the plan) 4) Communicate
a. Awareness communication (everybody knows about developments) b. Change management communication (Clear explanation of changes) c. Knowledge transfer communication (Training, best practices, learnings)
5) Use policy as carrot, not stick (policy must support underlying vision, not the rules which have to be followed)
6) Create communities (how to share best practices with partners on the other side of the world?)
3.3.6 Data integrity
As part of this research also the data management is important. This section gives some attention to the quality of data.
Dirty data
Dirty data is defined as follows; The sources of dirty data include data entry error by a human or computer system, data update error by a human or computer system, data transmission error by a computer system, and even bugs in a data processing computer system (Kim, Choi, Hong, Kim, & Lee, 2003).
The life cycle of data includes its capture, storage, update, transmission, access, archive, restore, deletion, and purge. The focus of dirty data is not on the ‘access’ aspect by a user or application. As such, the data is dirty if the user or application ends up with a wrong result or is not able to derive a result due to certain inherent problems with the data(Kim et al., 2003).
Relevance data
Besides the dirty data, data quality assessment should take into account how user requirements with the accessed service can vary. It is not sufficient to evaluate data quality by considering only the source in which data are contained (dirty data). Indeed, user expectations vary along different variables and the same data can be perceived in different ways by different users (Francalanci & Pernici, 2004). For a more complete view of the data quality and their ‘fitness for use’ Vaziri and Mohsenzadeh developed a phase in order to achieve useful list of dimensions which assess the data quality (Vaziri & Mohsenzadeh, 2012).
3.3.7 Factors changeovers
[image:29.595.98.503.540.768.2]Given from the several subjects of the literature the given factors from the stakeholders (section 3.1 and 3.2) are reviewed. When a factor is not in the literature it is not relevant to look at that factor. Table 3.3.2 gives an overview of the already mentioned factors and the new factors given from the literature. Categories factors Sub-categories factors T P M P DC A Ci rc le D ata int eg rity S tak eh ol de rs
1. Flexibility operators X
2. Usage of SMED standards X X
3. Technical knowledge X
4. Cleaning changeover parts X
5. Number of (skilled) operators X
6. Timing changeover X
[image:29.595.97.499.541.768.2]20
Chapter 3: Relevant factors
12. Fixed sequence products (type) X X
13. Dynamic sequence orders X X
14. Accuracy parameters (changeover rules / matrix) X X X
New factors based on literature
15. Visual standards X X
16. Tracking performance X X X
17. Reliable data X
18. Relevant data X X
19. Communication X X
20. Engaging stakeholders X
21. Horizontal expansions best practices X X
Table 3.3.2 shows that almost all the factors given by the stakeholders are part of the literature. Especially the theory of TPM supports most of the factors. This is quite logical because TPM is the used improvement method at Heineken. Only the number of switches and changeovers in a period is eliminated. But these factors are also influenced by other factors like reliable data and accuracy parameters planning. Furthermore there are several new factors which influence the changeovers. In the next chapter the factors are analyzed on their relevance for Heineken.
3.3.8Conclusion question 9
This section gives insight in factors out of the literature that have influence on the changeovers The factors are divided over the methodology TPM, PDCA, data quality and stakeholder engagement. The following new factors are found; visual standards, tracking performance, reliable data, relevant data, communication, engaging stakeholders and horizontal expansions best practices.
The factors of the stakeholders given in section 3.1 and 3.2 are evaluated based on the literature. Almost all the factors are supported by the literature, only the number of switches and changeover in a period is not relevant based on the literature.
Next question
Answers are given to the questions about the impact of the changeovers, the organizations of the lines, the different types of changeovers, the volume and duration of the changeovers, the quality of the changeovers, the organization of planning with respect to the changeovers and the factors that influence the impact of the changeovers (from literature).
The next section gives the answer to question 10; “Which factors affect the total planned changeover
New factors influence impact changeovers
literature TP
M P DCA Cir cl e Dat a Int egrit y S tak eh o lders
Visual standards X X
Tracking performance X X X
Reliable data X
Relevant data X X
Communication X X
Engaging stakeholders X
Horizontal expansions best practices X X
Question 9: “Which factors affect the impact of the
changeovers based on the literature?”
[image:30.595.97.498.70.211.2]Question 10: “Which factors are most relevant and applicable for Heineken?”
[image:30.595.65.532.406.558.2]21
Chapter 3: Relevant factors
3.4 Conclusion chapter 3
Chapter 3 gives insight in the factors that (may) have an influence on the flexibility of the lines. These factors are divided over three different categories; production, planning and literature. The factors of production and planning are gathered by the stakeholders. Because the factors from the stakeholders can be irrelevant we will also look at the literature.
Production factors
The factors are given by the stakeholders of production and are divided over two categories. The duration and the quality of the changeover. The following factors may affect the (duration and quality of the) changeovers:
1. Flexibility operators (Duration) 2. Usage of SMED standards (Duration) 3. Technical knowledge (Duration + Quality) 4. Cleaning changeover parts (Duration + Quality) 5. Number of (skilled) operators (Duration) 6. Timing changeover (Duration)
7. Organization (Duration)
8. # switches/changeover in a period (Quality) 9. Standards of SMED (Quality)
10. Differences in material (Quality)
Planning factors
The factors which may influence the planning are given by the stakeholders of tactical planning and scheduling.
11. Production cycle (Tactical planning)
12. Fixed sequence products (Tactical planning + Scheduling) 13. Dynamic sequence orders (Scheduling)
14. Accuracy parameters (Scheduling)
Literature factors
The factors given in the literature are based on the improvement methods which are generally used in manufacturing. These improvement methods give several factors which may improve the current situation. Therefore these factors affect the current performance of the changeovers:
15. Visual standards (TPM & PDCA) 16. Tracking performance (TPM) 17. Reliable data (TPM)
18. Relevant data (TPM & PDCA)
19. Communication (Data quality & Stakeholders theory) 20. Engaging stakeholders (Stakeholders theory)
21. Horizontal expansions best practices (TPM & Stakeholders theory)
23
Chapter 4: Preferred situation
•Factors
•Quantifying
potential
Relevance Heineken(§4.1)•PDCA phases
•Interventions
Improving factors
(§4.2)
•Steps
•Masterplan
World Class Level(§4.3)
Chapter 4: Preferred situation
This chapter gives insight into the preferred situation with respect to the changeovers.
[image:33.595.232.520.116.246.2]Answer is given to question 10. First of all the different factors found in chapter 3 are mentioned and their improvement potential is discussed (§4.1). The second section gives the interventions which will improve the factors with improvement potential (§4.2).
24
Chapter 4: Preferred situation
4.4 Conclusion chapter 4
This chapter gives insight into the preferred situation by analyzing the factors given by the literature and stakeholders in chapter 3. Looking at the opinion of the members of the PD-pillar, the future development (trends) and the possibility to improve, the relevant factors are chosen. The most relevant factors are; Usage of SMED standards, Organization, Accuracy parameters (changeover rules / matrix), Tracking performance, Reliable data and Communication.
The factors that are less important but also relevant for Heineken are; Cleaning changeover parts, Timing changeover, Working standards SMED, Engaging stakeholders and Horizontal expansions best practices.
Remarkably the factors which are most important are both in the middle of the planning part and the production part. These factors are important because at the moment the collaboration between planning and production isn’t optimal. The production department and the planning department don’t know from each other what they do and why they do it.
The several important and relevant factors have to be improved to decrease the total changeover time. Therefore interventions are developed for the relevant factors, based on the PDCA methodology. Since several different factors improve by doing the same intervention, the number of interventions can be limited to the following:
Plan: Training, clear working instruction and realistic planning parameters
Do: Usage of the standards
Check: Check performance and check realistic planning parameters Act: Horizontal expansion new developments
The interventions of the Plan phase and the Check phase both need a collaboration between planning and production. Therefore all the different stakeholders have to be involved in the development of the steps to execute these interventions
Based on factors and the interventions, the steps, needed to achieve a world class level changeover performance, are developed. The standard format for the masterplan of the PD-pillar is filled with the insights given from the PDCA circle of the founded interventions. Although the masterplan is an important part to achieve the WCL there are other steps important as well. Therefore we defined a new PDCA to support the PDCA inside the masterplan.
1. Plan: Defining masterplan
2. Do: Give priorities to Masterplan and divide them over stakeholders 3. Check: Meetings PD-Pillar