International Journal of Clinical Medicine, 2012, 3, 446-458
http://dx.doi.org/10.4236/ijcm.2012.36083 Published Online November 2012 (http://www.SciRP.org/journal/ijcm)
Improving Laboratory Test-Ordering with Information
Technology
Adnan Ali Baddour1, Anas Serag Dablool2, Saeed Saeed Al-Ghamdi3
1
College of Applied Medical Science, Umm Al-Qura University, Makkah, KSA; 2Makkah Public Health Laboratory, Ministry of Health, Makkah, KSA; 3Faculty of Medicine, Umm Al-Qura University, Makkah, KSA.
Email: [email protected]
Received June 7th, 2012; revised August 12th, 2012; accepted September 8th, 2012
ABSTRACT
The overuse of clinical laboratory services has been documented for many years. This overuse use does not contribute to the quality of medical care, does not shorten hospital stay, nor reduce mortality. The utilization of diagnostic labora-tories has increased over the last decade around the world. This increased laboratory use is appropriate if it allows ac-curate diagnoses to be made, ideal treatment to be identified and monitored, acac-curate prognoses to be established, and patients’ hospital stays to be shortened. Thus, improving the appropriateness of testing behavior and reducing the num-ber of laboratory tests have been recognized as essential parts of quality improvement program. In this study, the effec-tiveness of a computer-based system in improving the laboratory test-ordering in a general hospital was investigated. The study was conducted through four stages, the preparation stage, the pre-intervention stage, the post-intervention 1) stage and post-intervention 2) stage.Guideline and computer system were developed during preparation stage. Medical records were reviewed against guideline recommendations before any intervention during the pre-intervention stage, after guideline dissemination through educational workshops during the post intervention 1) stage, and after implemen-tation of the computer system with the new requesting form during the post intervention 2) stage. The study revealed that the computer-based system achieved a statistically significant increase in the percentage of appropriate use from 44.6% in the post-intervention 1) stage to 55.6%, and a statistically significant increase in the compliance with guide-line by prescriber as well as increased in guideguide-line conformity rate from 16.7% in the post-intervention 1) stage to 32.5% in the post-intervention 2) stage, and decreased in the percentage of prescribers whose level was unsatisfactory from 85.4% the post-intervention 1) stage to 66.7% in the post-intervention 2) stage.
Keywords: Computer-Based System; Laboratory Test-Ordering; Guideline; Conformity Rate; Compliance Level
1. Introduction
Appropriate laboratory services utilization is a corner- stone of optimal medical practice. Laboratory services utilization is appropriate if it allows accurate diagnoses to be made, ideal treatment to be identified and moni- tored, accurate prognoses to be established, and patients’ hospital stays to be shortened [1,2].
Appropriate laboratory utilization—as an ongoing proc- ess of making the best use of laboratory resources— could be defined as ordering the right tests and interpret- ing them properly to complete the diagnosis and evalua- tion of the patient disease [3,4].
Laboratory services utilization could be measured in term of number of tests per admission, average tests or- dered per patient per day, median number of tests per physician per year, per clinical problem, number of re- quests per practice per months, number of tests ordered per visit, or tests ordered by primary care practitioners
[5].
The appropriateness of laboratory utilization could be assessed based on implicit as opposed to explicit criteria. The implicit review is based on subjective criteria and relies on interpretation by the reviewer. Medical record review or a summary of the medical record review should be used to apply the criteria. All audit criteria require the chart reviewer to identify each patient’s symptoms or diagnoses to determine test appropriateness [6,7].
The explicit criteria are based on testing frequency, timing of the test in relation to previous medications and tests, test choice compared with possible alternatives, clinical indications for the test, or probability that a test result was abnormal. With explicit criteria, it is often possible to collect the necessary data from databases or requisition forms completed by the ordering physician, thus avoiding many of the problems associated with ret- rospective medical record review [8,9].
ized, under-utilized, or mal-utilized. Each can contribute to an increase in costs [10]. Over utilization would be from the tests that were ordered during a patient disease workup that do not provide information about the disease. while, under-utilization would be from the tests that do provide critical information for the diagnosis and evalua- tion of patient disease that were not ordered [1,10]. If appropriate laboratory utilization is adopted, the number of test ordered for some disorders would go up (presuma- bly the right tests) and for other disorders (presumably the uninformative tests) would go down. Ultimately, the appropriate laboratory utilization could be achieved when clinicians order the right tests, at the right time, in the right order [1,2].
Many studies and reports indicated that a significant proportion (25% - 40%) of laboratory testing performed throughout all tiers of the health system is inappropriate [11].
A systematic review of clinical laboratory audit built on thirty-one studies from the US and six studies from Europe. This review cited large variations in the esti- mates of inappropriate laboratory use (4.5% - 95%). The review indicated that 15% of ordered general biochemist- try and haematology tests, 46% of microbiology tests, 39% of cardiac enzymes tests, 30% of thyroid function tests, and 46% of drug monitoring tests were inappropri- ate tests [6].
laboratory utilization have been analyzed extensively, and inappropriate practices test ordering found to be a primary reason for increased inappropriate laboratory utilization [12].
Several strategies to improve laboratory test-ordering have been proposed but none has been widely adopted. The successful strategy should initiate changing in the request behavior of physicians, should be able to main- tain this change, and should assess long term effects of the change. Strategies to improve laboratory test-ordering could be categorized into five main categories; clinical practice guideline and clinical algorithms, education, feedback, computer-based systems, and administrative strategies [13-15].
The objective of this study was to assess the effec- tiveness of a Computer-Based System (CBS) in improv- ing the laboratory test-ordering in a general hospital.
The researcher conducted developing consensus guide- line for appropriate ordering and reordering of selected tests; developing a computerized system for detecting inappropriate test ordering based on the developed guide- line; implementing an intervention to improve test-or- dering, that comprised three integrated components: dis- semination of guidelines for test ordering, discussions with medical staff, and feedback process; and finally assessing the effectiveness of the intervention in terms of improving ordering laboratory tests.
2. Material and Methods
Study Setting:
The study was conducted at a general governmental hospital. The number of beds is 597 beds, and number of physicians is 318 physicians.
Study Design:
Pretest/posttest intervention study.
Study Stages and Data Collection:
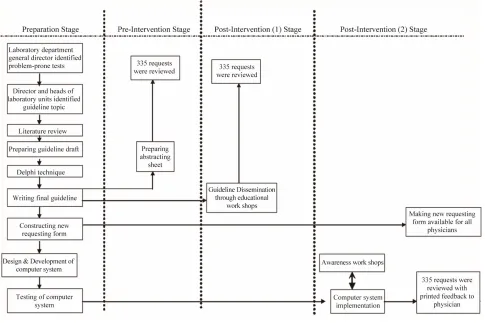
Study was conducted through four stages, the prepara- tion stage, the pre-intervention stage, the post-interven- tion 1) stage and post-intervention 2) stage (Figure 1).
Guideline and computer system were developed during preparation stage. Medical records were reviewed against guideline recommendations before any intervention dur- ing the pre-intervention stage, after guideline dissemina- tion through educational workshops during the post in- tervention 1) stage, and after implementation of the com- puter system with the new requesting form during the post intervention 2) stage.
Preparing Period:
Development of evidence-based guidelines for appro- priate ordering and reordering of selected laboratory tests: Guideline was developed on the basis of expert opinion of the participants, as well as on available published in- formation. Guideline development consisted of the fol- lowing steps:
Selecting guideline topic;
Literature review;
Delphi technique;
Finalizing of guideline recommendations.
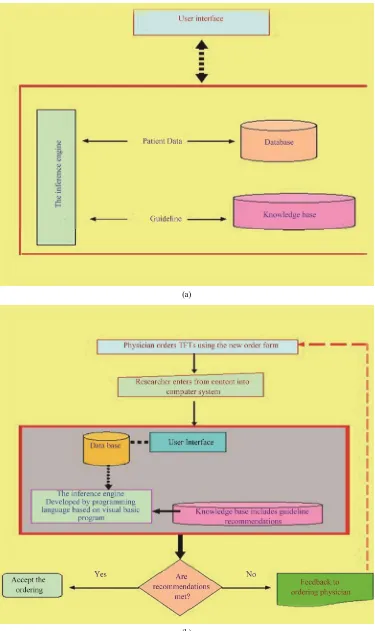
Design and Development of computerized system: During design phase, functional requirements of the sys- tem were specified. All inputs to and outputs from the system, and transfer functions that produce the outputs from inputs were described in detail. During develop- ment phase, decision on the appropriate types of applica- tion software including languages and packages, as well as software required to support the system were made. The program was written, tested and information was converted into computer stored files.Design and devel- opment of computer system consisted of the following steps:
Identifying of Computer System Structure based on the system functions (Figure 2).
Creating the Database:
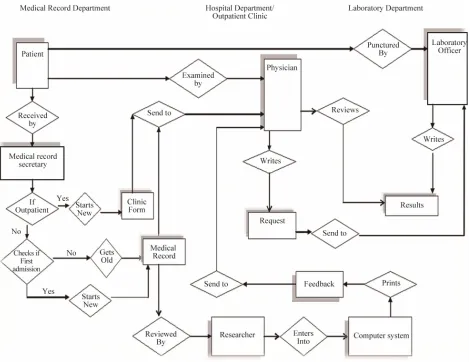
Data Modeling (Mapping) (Figure 3).
Conversion Map to a Specific Database Management System.
Creating of Computer System Tables. Development of the inference engine. Development of User interface.
Improving Laboratory Test-Ordering with Information Technology 448
Figure 1. Study stages.
Assessment of Effectiveness of the Intervention:
will be opened once the user opens the computer system for data entry. The main screen contains two buttons: open patient database and exit from the system.
Guideline Conformity Rate (GCR):
The main measure for effectivenessof the intervention was the percentage of ordered requests that met the guideline recommendations (Guideline Conformity Rate). Nonconformity types included:
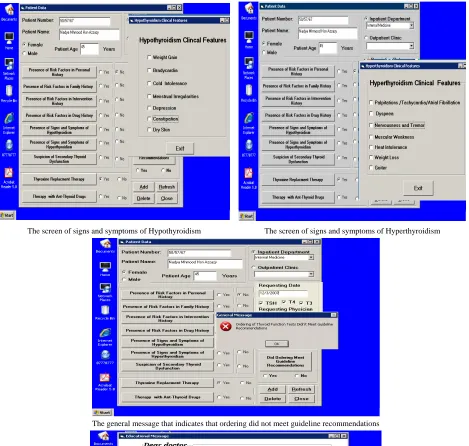
Messages of Computer-Based System: The general massage that should be printed when ordering did not meet guideline recommendations after the computer sys- tem had compared the guideline recommendations and purpose of tests ordering and the tests were ordered, and the specific educational message that should be printed according to the clinical data related to the patient and the thyroid functions tests that were ordered for this pa- tient (specific ordering purpose). This message com- prised the name of requesting physician, the patient name and the ordering date in addition to guideline recom- mendations for specific patient case (appropriate order- ing strategy).
All requests where the ordering purpose was not justi- fied.
Ordering was repeated within less than monthly inter- vals.
Ordering was justified and not repeated within less than monthly intervals, but physician did not follow guideline recommendations when he or she selected the tests.
Appropriate Use of TFTs
To determine the appropriateness (necessity) of TFTs, the analytical results of the tests (normal, high, low or undetectable) of the combinations of TFTs in the request were considered in addition to the purpose of ordering.
Post-Intervention (1) Period:
Dissemination of guideline to all hospital physicians. Educational Workshops:
Medical records review. Guideline Compliance Level of Each Prescriber Post-Intervention (2) Period: Guideline Compliance Rate =
Number of conformed requests per prescribe × 100. Testing and implementing computer system.
Number of all requests per prescriber. Adopting of new requesting form.
Guideline compliance rate could range from 0 to 100. Prescriber’s guideline compliancelevel was categorized Awareness Workshop.
(a)
(b)
[image:4.595.111.486.83.714.2]Improving Laboratory Test-Ordering with Information Technology 450
Figure 3. Data modeling.
based on guideline compliance rate as follows: Guideline Compliance Rate
0 60<
Guideline Compliance Level Unsatisfactory
Average
60+ Satisfactory
Statistical Design and Analysis: Sample Size:
Assuming the percentage of unnecessary tests sent to the laboratory is 30% and the application of the proposed system will change the utilization by 10%, and to be 90% confident of detecting a true effect of the program at 5% level of significance the minimum required sample size should be 335 requests before and after the implementation of the intervention. Thus, the sample size was 335 requests that included any test of TFTs namely; TSH, T4, or T3, during each of the pre-intervention stage, after guideline dissemination (post-intervention 1) stage) and after implementation of the new request form with com- puter system implementation (the post-intervention 2)).
Sampling Technique:
All consequent requests were included in the sample until the required number was obtained.
3. Main Results of the Study
The results will be presented as three main sections; the first section will cover the pattern of thyroid function tests-ordering (Tables1-2), the second section will com-prise the appropriate use of thyroid function tests & guideline conformity rate (Tables 3-4), the last section will show the guideline compliance level (Tables 5-7).
[image:5.595.65.535.82.444.2]3.1. Pattern of Thyroid Function Tests-Ordering
The main screen The patient data screen
The personal history screen The family history screen
The intervention history screen The drug history screen
Improving Laboratory Test-Ordering with Information Technology 452
The screen of signs and symptoms of Hypothyroidism The screen of signs and symptoms of Hyperthyroidism
The general message that indicates that ordering did not meet guideline recommendations
The specific feedback message
(b)
[image:7.595.58.527.86.532.2]Table 1. Distribution of ordered thyroid function tests during the different study stages.
Study Stage
Pre- Post-1 Post-2 Pre-Post Comparison
Characteristic
No. % No. % No. % X2 p
Thyroid Function Test
TSH 178 21.4 250 31.9 266 39.5
T4 329 39.5 292 37.3 234 34.7
T3 326 39.1 241 30.8 174 25.8
Total 833 100 783 100 674 100
[image:8.595.112.482.268.520.2]64.9 0.000
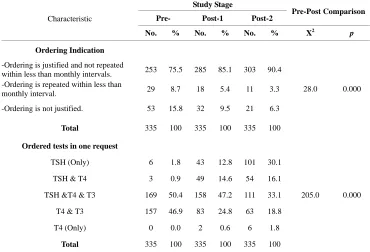
Table 2. Distribution of ordered requests during the different study stages according characteristics of ordered thyroid func-tion test requests.
Study Stage
Pre- Post-1 Post-2 Pre-Post Comparison
Characteristic
No. % No. % No. % X2 p
Ordering Indication
-Ordering is justified and not repeated
within less than monthly intervals. 253 75.5 285 85.1 303 90.4
-Ordering is repeated within less than
monthly interval. 29 8.7 18 5.4 11 3.3
-Ordering is not justified. 53 15.8 32 9.5 21 6.3
Total 335 100 335 100 335 100
28.0 0.000
Ordered tests in one request
TSH (Only) 6 1.8 43 12.8 101 30.1
TSH & T4 3 0.9 49 14.6 54 16.1
TSH &T4 & T3 169 50.4 158 47.2 111 33.1
T4 & T3 157 46.9 83 24.8 63 18.8
T4 (Only) 0 0.0 2 0.6 6 1.8
Total 335 100 335 100 335 100
205.0 0.000
Table 3. Appropriate use of thyroid function tests during the different study stages.
Appropriate Use Study Stage Total No.
No. %
95% CI X2 p
Pre-Intervention 833 311 37.3 0.34 - 0.40
Post-Intervention (1) 783 349 44.6 0.41 - 0.48
Post-Intervention (2) 674 375 55.6 0.52 - 0.59
[image:8.595.113.482.659.735.2]50.6 0.000
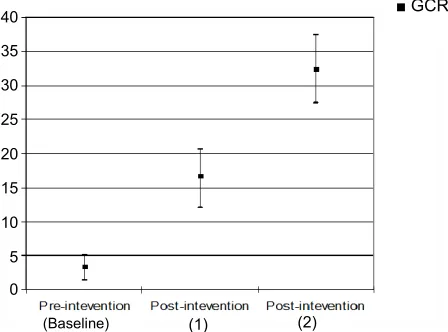
Table 4. Overall guideline conformity rate (GCR) during the different study stages.
Study Stage Total
No. GCR 95% CI X
2 p
Pre-Intervention (Baseline) 335 3.3 1.4 - 5.0
Post-Intervention (1) 335 16.7 12.0 - 20.6
Post-Intervention (2) 335 32.5 27.5 - 37.5
Improving Laboratory Test-Ordering with Information Technology 454
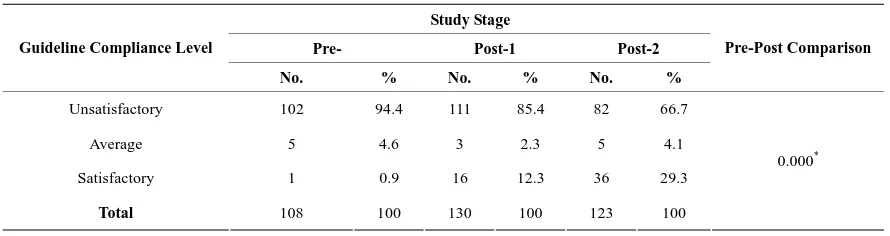
Table 5. Distribution of prescribers who ordered thyroid function tests during the different study stages according to their guideline compliance level.
Study Stage
Pre- Post-1 Post-2
Guideline Compliance Level
No. % No. % No. %
Pre-Post Comparison
Unsatisfactory 102 94.4 111 85.4 82 66.7
Average 5 4.6 3 2.3 5 4.1
Satisfactory 1 0.9 16 12.3 36 29.3
Total 108 100 130 100 123 100
0.000*
[image:9.595.76.520.276.425.2]* MCEP.
Table 6. Distribution of prescribers who ordered thyroid function tests at all stages of the study according to their ordering pattern.
Study Stage
Pre-(Baseline) Post-1 Post-2
Friedman Test
Variables No. % No. % No. % X2 p
Number of Conformed Requests 0 1 2 3 4 5 85 2 3 1 0 0 93.4 2.2 3.3 1.1 0.0 0.0 74 8 2 6 1 0 81.3 8.8 2.2 6.6 1.1 0.0 57 2 10 17 4 1 62.6 2.2 11.0 18.7 4.4 1.1
Total 91 100 91 100 91 100 44.7 0.000
[image:9.595.75.523.464.557.2]Mean SD 0.12 0.49 0.56 1.25 1.03 1.4
Table 7. Distribution of prescribers who ordered thyroid function tests at all stages of the study according to their guideline compliance level.
Study Stage
Pre- Post-1 Post-2 Friedman Test
Guideline Compliance Level
No. % No. % No. % X2 p
Unsatisfactory Average Satisfactory 85 5 1 93.4 5.5 1.1 74 1 16 81.3 1.1 17.6 57 3 31 62.6 3.3 34.1
Total 91 100 91 100 91 100 50.0 0.000
Table 2 shows the distribution of ordered requests during the different study stages according to ordering indications, ordering purpose and thyroid tests ordered in one request. There was statistically significant difference among the different study stages as regards to ordering indications (p = 0.000). The proportion of requests where the ordering was justified and not repeated within less than monthly intervals was 75.5% in the pre-intervention stage, while it was 85.1% and 90.4% in post-intervention 1) and post-intervention 2) stages, respectively. A reduc-tion was noted in percent of requests that included or-dering repeated within less than monthly intervals (p = 0.000), The percent of requests where the repeated or-dering within less than monthly intervals was 8.7% in the
post-intervention 1), 5.4% in the pre-intervention stage and 3.3% post-intervention 2). Regards the ordering jus-tification, the percentage of unjustified requests was 15.8% in the pre-intervention stage, while it was 9.5% and 6.3% in post-intervention 1) and post-intervention 2) stages respectively. Difference in percent of requests that included unjustified ordering was significant (p = 0.000).
On the other hand, the percentage of requests that in-cluded TSH only increased from 1.8% in the pre-inter- vention stage to 12.8% in the post-intervention 1) stage and to 30.1% in the in post-intervention 2) stage.
[image:10.595.311.535.86.252.2]3.2. Appropriate Use of Thyroid Function Tests
Table 3 and Figure 5 showthe appropriate use of thy-roid function tests during the different study stages. The percentage of appropriate use increased from 37.3 (95% CI, 0.34 - 0.40) in the pre-intervention stage to 44.6 (95% CI, 0.41 - 0.48) in the in post-intervention 1) stage and to 55.6 (95% CI, 0.52 - 0.59) in the post-intervention 2) stage. There was a statistically significant difference among the different study stages as regards the appropri-ate use of these tests (p = 0.000)
3.3. Guideline Conformity Rate (GCR)
Table 4 and Figure 6 show the Overall Guideline Con-formity Rate (the percentage of ordered requests in ac-cordance with the guideline) during the different study stages. The guideline conformity rate increased from 3.3% (95% CI, 1.4 - 5.0) in the pre-intervention stage to 16.7% (95% CI, 12.0 - 20.6) in the in post-intervention 1) stage and to 32.5% (95% CI, 27.5 - 37.5) in the in post-intervention 2) stage. There was a statistically sig-nificant difference among the different study stages as regards to guideline conformity rate (p = 0.000).
[image:10.595.61.286.556.710.2]3.4. Guideline Compliance Level
Table 5 shows the distribution of prescribers who or-dered thyroid function tests during the different study stages according to their Guideline Compliance Level. In the pre-intervention stage, the Guideline Compliance level was unsatisfactory among 102 (94.4%) prescribers and average among 5 (4.6%), while only one prescriber (0.9%) had satisfactory compliance level. In the post- intervention 1) stage, the Guideline Compliance level
70 60 50 40 30 20 10 0
■ Appropriate Use (%)
(Baseline)
Figure 5. Appropriate use of thyroid function tests during the different study stage.
■GCR
(Baseline) (1) (2)
40 35 30 25 20 15 10 5 0
Figure 6. Overall guideline conformity rate (GCR) during the different study stages.
was unsatisfactory among 111 (85.4%) prescribers, av-erage among 3 (2.3%), and satisfactory among 16 (12.3%). In the post-intervention 2) stage, the Guideline Compli-ance level was unsatisfactory among 82 (66.7%) pre-scribers, average among 5 (4.1%), and satisfactory among 36 (29.3%) prescribers. Comparing of pre and post stages reveals that the percentage of priscribers whose GCL was unsatisfactory decreased from 94.4% in the-intervention stage to 85.4% and 66.7% in the post-intervention 1) stage and the post-intervention 2) stage respectively (p = 0.000). the percentage of priscribers whose GCL was satisfactory increased from 0.9% in the-intervention stage to 12.3% and 29.3% in the post-intervention 1) stage and the post-intervention 2) stage, respectively (p = 0.000).
Table 6 reveals that the difference in the number of conformed requests per prescriber was statistically sig-nificant among the different study stages (p = 0.000).The percentage of prescribers who did not have any con-formed request decreased from 93.4% in the pre-inter- vention stage to 81.3% in the in post-intervention 1) stage and to 62.6% in the in post-intervention 2) stage. The percentage of prescribers who had more than two conformed requests increased from 1.1% in the pre-in- tervention stage to 7.7% in the in post-intervention 1) stage and to 24.2% in the in post-intervention 2) stage.
Improving Laboratory Test-Ordering with Information Technology 456
among 31 (34.1%) prescribers. the percentage of pre-scribers whose level was unsatisfactory decreased from 93.4% in the-intervention stage to 81.3% and 62.6% In the post-intervention 1) stage and the post-intervention 2) stage respectively (p = 0.000). On the other hand, the percentage of prescribers whose level was satisfactory increased from 1.1% in the-intervention stage to 17.6% and 34.1% in the post-intervention 1) stage and the post-intervention 2) stage respectively (p = 0.000).
4. Discussion
The appropriate use of health care services (diagnostic testing and therapy) belongs firmly in the domain of quality care and clinical accountability. Donabedian, in looking at the assessment of quality care, describes “elements in the performance of practitioners”, with technical performance defined as “knowledge and judg-ment used in arriving at the appropriate strategies of care” [16]. Appropriate use and understanding of diag-nostic testing will reduce unnecessary patient discomfort while also reducing costs. The appropriateness of the services including the appropriate diagnostic testing formed the first challenge facing people who wish to improve healthcare systems in the developing world. The chal-lenge has its origin in issues that most healthcare systems face: rising healthcare costs, variations in service deliv-ery among providers, hospitals and geographic regions and the presumption that at least some of this variation stems from inappropriate care, either over- or under-use of services; and the intrinsic desire of health-care profes-sionals to offer, and patients to receive the best care pos-sible [17]. The objective of this study was to assess the effectiveness of a Computer-Based System (CBS) in im-proving the laboratory test-ordering in a general hospital. In the present study, purpose of the computer system was to detect compliance with guidelines recommendations for ordering TFTs and print feedback as message to the physician who did not follow the guideline recommenda-tions. The computer-based system achieved a statistically significant reduction (18.3%) in the percentage of un-necessary TFTs and a statistically significant increasing in the overall guideline conformity rate (29.2%). The computer-based system also achieved a statistically sig-nificant reduction in the unsatisfactory level of compli-ance with the guideline among prescribers (27.7%). This effect of the computer system was assessed by pervious studies. A systematic review covered eight studies that examined the effect of computer systems on utilization of care and showed decreased rates of health services utili-zation; computerized provider order-entry systems that provided decision support at the point of care were the primary interventions leading to decreased utilization. Types of decision support included automated
calcula-tion of pretest probability for diagnostic tests, display of previous test results, display of laboratory test costs, and computerized reminders. Absolute decreases in utiliza-tion rates ranged from 8.5 to 24 percentage points. The primary services affected were laboratory and radiology testing [18-24]. Two studies examined the effect of sys-tems on utilization of care. Both evaluated the same elec-tronic health record system at different periods through time-series designs. One study (1994-1997) showed de-creased utilization of two radiology tests after imple-mentation of electronic health records [25], while the second study (2000-2004) showed no conclusive de-creases in utilization of radiology and laboratory services [26]. The successful impact of the computer system that was investigated in the present study resulted from three basic domains; namely: scientific, administrative and technologic domain. The scientific domain included the incorporating of the developed guideline in the computer system. The administrative domain included structuring of new request form based on the developed guideline. The technologic domain included assembling of the guideline and the new request form in one computer- based system.
A systematic review indicated that the critical success-ful factors of the combination of scientific guideline with computer technology may be summarized as following [27]; the objective of guidelines should be describing the best clinical practice in a particular situation, and must be agreed locally and understood by all those with direct responsibility for patient care. If the objective of guide-lines is to improve the appropriateness of test utilization (test ordering improving) it must provide the standards for appropriate test use. On other hand, the computer systems that proactively reinforce guidelines must be able to represent guideline and to conduct a systematic audit and monitor test utilization to determine compli-ance with guideline and detect any deviation. In addition, the computer system must make that information avail-able to clinicians at the time of ordering and create an interface between the clinician and the laboratory and orders could be made directly into a computer, so the ordering in this fashion will be more efficient than writ-ing and will offer the benefit of addwrit-ing the order directly to the patient’s record while simultaneously conveying the request electronically to the laboratory [27,28].
As conclusion, the computer based system is not an objective in itself but a tool to improve appropriateness of laboratory test utilization. The present system must be considered as nucleus for building a good laboratory in-formation system (LIS). LIS have become an essential part of an efficient and effective laboratory. LIS should be developed to handle several functions, including or-der/specimen processing and results dissemination.
va-lidity and generalization the results of present study. There was no control group of prescribers and the change in the ordering pattern was reported immediately after the intervention. The availability of matched control group of prescribers could investigate the actual change in the ordering behavior of prescribers and may identify the factors related to this change. Continuously analyzing of the TFTs ordering should be conducted to assess the long term impact of the intervention.
REFERENCES
[1] S. Lewis and J. Foreman, “Low-Cost Diagnostic Tech- nologies and Clinical Outcomes. The Impact of Inappro- priate Utilization,” International Journal of Technology Assessment in Health Care, Vol. 13, No. 4, 1997, pp. 501-511.doi:10.1017/S0266462300009971
[2] M. Thamer, K. J. Fitzpatrick and S. Perry, “Medical and Surgical Supply Costs. Case Study of a Costly Low-Cost Technology,” International Journal of Technology As- sessment in Health Care, Vol. 13, No. 4, 1997, pp. 526- 536.doi:10.1017/S026646230001000X
[3] J. Kwok and B. Jones, “Unnecessary Repeat Requesting of Tests: An Audit in a Government Hospital Immunol- ogy Laboratory,” Journal of Clinical Pathology, Vol. 58, No. 5, 2005, pp. 457-462.doi:10.1136/jcp.2004.021691 [4] N. Pansini, F. Di Serio and M. Tampoia, “Total Testing
Process: Appropriateness in Laboratory Medicine,” Cli- nica Chimica Acta, Vol. 333, No. 2, 2003, pp. 141-145. doi:10.1016/S0009-8981(03)00178-5
[5] C. Van Walraven, V. Goel and B. Chan, “Effect of Popu- lation-Based Interventions on Laboratory Utilization: A Time-Series Analysis,” Journal of the American Medical Association, Vol. 280, No. 23, 1998, pp. 2028-2033. doi:10.1001/jama.280.23.2028
[6] C. Van Walraven and C. D. Naylor, “Do We Know What Inappropriate Laboratory Utilization Is? A Systematic Review of Laboratory Clinical Audits,” Journal of the American Medical Association, Vol. 280, No. 6, 1998, pp. 550-558.doi:10.1001/jama.280.6.550
[7] D. Solomon, H. Hashimoto and L. Daltroy, “Techniques to Improve Physicians’ Use of Diagnostic Tests: A New Conceptual Framework,” Journal of the American Medi- cal Association, Vol. 280, No. 23, 1998, pp. 2020-2027. doi:10.1001/jama.280.23.2020
[8] R. Conyers, “Modifying Use of Pathology Services; Par-ticipatory, Non-Punitive Involvement of Healthcare Prac-titioners Is Needed,” Medical Journal of Australia, Vol. 170, No. 1, 1999, pp. 8-9.
[9] J. Hindmarsh and A. Lyon, “Strategies to Promote Ra- tional Clinical Chemistry Test Utilization,” Clinical Bio- chemistry, Vol. 29, No. 4, 1996, pp. 291-299.
doi:10.1016/0009-9120(96)00042-2
[10] P. Shekelle and R. Kravitz, “Are Nonspecific Practice Guidelines Potentially Harmful? A Randomized Com- parison of the Effect of Nonspecific versus Specific Guidelines on Physician Decision Making,” Health Ser- vices Research, Vol. 34, No. 7, 2000, pp. 1429-1448.
[11] P. Axt-Adam, J. C. van der Wouden and E. van der Does, “Influencing Behavior of Physicians Ordering Laboratory Tests: A Literature Study,” Medical Care, Vol. 31, No. 9, 1993, pp. 784-794.
doi:10.1097/00005650-199309000-00003
[12] E. T. Wong, “Improving Laboratory Testing: Can We Get Physicians to Focus on Outcome?” Clinical Chemistry, Vol. 41, No. 8, 1995, pp. 1241-1247.
[13] C. E. Speicher and J. W. Smith, “Interpretation of Strate-gies,” Choosing Effective Laboratory Tests, WB Saunders Co., Philadelphia, 1983, pp. 37-46.
[14] R. J. Panzer, “Interpretation of Diagnostic Tests and Strategies for Their Use in Quantative Decision Making. In: R. J. Panzer, E. R. Black and P. F. Griner, Diagnostic Strategies for Common Medical Problems, American College of Physicians, Philadelphia, 1991, pp. 17-28. [15] E. R. Black, “Characteristics of Diagnostic Tests and
Principles for Their Use in Quantitative Decision Mak-ing,” In: R. J. Panzer, E. R. Black and P. F. Griner, Di-agnostic Strategies for Common Medical Problems, American College of Physicians, Philadelphia, 1991, pp. 1-21.
[16] A. Donabedian, “The Quality of Care: How Can It Be Assessed?” Journal of the American Medical Association, Vol. 260, 1988, pp. 1743-1748.
doi:10.1001/jama.260.12.1743
[17] L. Leape, “Practice Guidelines and Standards: An Over-view,” Accreditation of Healthcare Organizations, Oak-brook Terrace, Illinois.
[18] W. M. Tierney, C. J. McDonald, D. K. Martin and M. P. Rogers, “Computerized Display of Past Test Results. Ef-fect on Outpatient Testing,” Annals of Internal Medicine, Vol. 107, No. 4, 1987, pp. 569-574.
[19] W. Tierney, M. Miller and C. McDonald, “The Effect on Test Ordering of Informing Physicians of the Charges for Outpatient Diagnostic Tests,” New England Journal of Medicine, Vol. 322, 1990, pp. 1499-1504.
doi:10.1056/NEJM199005243222105
[20] G. Wilson and C. McDonald, “The Effect of Immediate Access to a Computerized Medical Record on Physician Test Ordering: A Controlled Clinical Trial in the Emer- gency Room,” American Journal of Public Health, Vol. 72, No. 7, 1982, pp. 698-702.doi:10.2105/AJPH.72.7.698 [21] D. Bates, G. Kuperman, E. Rittenberg and J. Teich, “A
Randomized Trial of a Computer-Based Intervention to Reduce Utilization of Redundant Laboratory Tests,” American Journal of Medicine, Vol. 106, No. 2, 1999, pp. 144-150.doi:10.1016/S0002-9343(98)00410-0
[22] P. Chen, M. Tanasijevic and R. Schoenenberger, “A Computer-Based Intervention for Improving the Appro- priateness of Antiepileptic Drug Level Monitoring,” American Journal of Clinical Pathology, Vol. 119, 2003, pp. 432-438.doi:10.1309/A96XU9YKU298HB2R [23] W. Tierney, C. McDonald and S. L. Hui, “Computer
Pre-dictions of Abnormal Test Results. Effects on Outpatient Testing,” Journal of the American Medical Association, Vol. 259, 1988, pp. 1194-1198.
doi:10.1001/jama.259.8.1194
Improving Laboratory Test-Ordering with Information Technology 458
tient Order Writing on Microcomputer Workstations. Ef- fects on Resource Utilization,” Journal of the American Medical Association, Vol. 269, No. 3, 1993, pp. 379-383.
doi:10.1001/jama.1993.03500030077036
[25] H. L. Chin and P. Wallace, “Embedding Guidelines into Direct Physician Order Entry: Simple Methods, Powerful Results,” Proceedings of American Medical Information Association Symposium, 1999, pp. 221-225.
[26] T. Garrido, L. Jamieson, Y. Zhou, A. Wiesenthal and L. Liang, “Effect of Electronic Health Records in Ambula-
tory Care: Retrospective, Serial, Cross Sectional Study,” British Medical Journal, Vol. 330, 2005, p. 581.
doi:10.1136/bmj.330.7491.581
[27] B. Chaudhry and J. Wang, “Systematic Review: Impact of Health Information Technology on Quality, Efficiency, and Costs of Medical Care,” Annals of Internal Medicine, Vol. 144, 2006, pp. 742-752.