ISSN Online: 2151-1969 ISSN Print: 2151-1950
MRF-Based Multispectral Image Fusion Using
an Adaptive Approach Based on Edge-Guided
Interpolation
Mohammad Reza Khosravi
1,2*, Mohammad Sharif-Yazd
3, Mohammad Kazem Moghimi
4,
Ahmad Keshavarz
2, Habib Rostami
5, Suleiman Mansouri
21Department of Electrical and Electronic Engineering, Shiraz University of Technology, Shiraz, Iran 2Department of Electrical Engineering, Persian Gulf University, Bushehr, Iran
3Department of Electrical Engineering, Yazd Branch, Islamic Azad University, Yazd, Iran 4Department of Electrical Engineering, Najafabad Branch, Islamic Azad University, Najafabad, Iran 5Departmentof Computer Engineering, Persian Gulf University, Bushehr, Iran
Abstract
In interpretation of remote sensing images, it is possible that some images which are supplied by different sensors become incomprehensible. For better visual perception of these images, it is essential to operate series of pre- processing and elementary corrections and then operate a series of main processing steps for more precise analysis on the images. There are several approaches for processing which are depended on the type of remote sensing images. The discussed approach in this article, i.e. image fusion, is the use of natural colors of an optical image for adding color to a grayscale satellite im-age which gives us the ability for better observation of the HR imim-age of OLI sensor of Landsat-8. This process with emphasis on details of fusion technique has previously been performed; however, we are going to apply the concept of the interpolation process. In fact, we see many important software tools such as ENVI and ERDAS as the most famous remote sensing image processing tools have only classical interpolation techniques (such as bi-linear (BL) and bi-cubic/cubic convolution (CC)). Therefore, ENVI- and ERDAS-based re-searches in image fusion area and even other fusion rere-searches often don’t use new and better interpolators and are mainly concentrated on the fusion algo-rithm’s details for achieving a better quality, so we only focus on the interpo-lation impact on fusion quality in Landsat-8 multispectral images. The im-portant feature of this approach is to use a statistical, adaptive, and edge- guided interpolation method for improving the color quality in the images in practice. Numerical simulations show selecting the suitable interpolation techniques in MRF-based images creates better quality than the classical in-terpolators.
How to cite this paper: Khosravi, M.R., Sharif-Yazd, M., Moghimi, M.K., Keshavarz, A., Rostami, H. and Mansouri, S. (2017) MRF-Based Multispectral Image Fusion Using an Adaptive Approach Based on Edge-Guided Interpolation. Journal of Geo-graphic Information System, 9, 114-125. https://doi.org/10.4236/jgis.2017.92008
Received: February 11, 2017 Accepted: April 27, 2017 Published: April 30, 2017
Copyright © 2017 by authors and Scientific Research Publishing Inc. This work is licensed under the Creative Commons Attribution International License (CC BY 4.0).
Keywords
Satellite Image Fusion, Statistical Interpolation, Multispectral Images, Markov Random Field (MRF), Intensity-Hue-Saturation (IHS) Image Fusion
Technique, Natural Sense Statistics (NSS), Linear Minimum Mean Square Error-Estimation (LMMSE)
1. Introduction
Processing of remote sensing images is a way for achieving information in dif-ferent usages of geosciences. These images are widely used in difdif-ferent fields such as physical geography and satellite photogrammetric studies, study of cli-mate change, earth physics and earth quick engineering, hydrology and soil ero-sion, jungle studies and different fields of agriculture. Remote sensing images contain different types such as ground photos, airborne photos and satellite im-ages. Satellite images can be divided into the images in the visible region (optical images), thermal images (infrared), radar images and laser images and so on. For better visual perception of the images, it is essential to operate series of pre- processing and elementary corrections and then operate a series of main processes for more precise analysis on the image [1]. Each of these images is provided with a special means and used for some special usages. For example visible images are appropriate in many applications which need to the natural color. The problem of visible images is that all the surface information is not reachable and this is a reason for using other sensors’ images. In visible area, image quality is inappropriate in bad climate and dark night, because passive imaging systems are used in the most optical sensors. Thermal images are often provided in infrared (IR) frequency spectrum and are usually used in warming studies and earth temperature changing. The major problem of these images is the lower spatial accuracy of IR sensors in comparison to the optical sensing. However, radar images which are often obtained from active radars have wide usages in the applications which the optical sensing is not suitable, e.g. extract-ing objects, buildextract-ings and roads, exploration if natural resources and identifyextract-ing facilities and complication of earth surface [2].
Several remote sensing satellites have been launched for different missions. One or more sensors are placed on each of these satellites for different purposes. Regarding the usages, each sensor takes images in some special frequency bands and gives us the proportional information. Landsat satellite series has been made from a group of 8 satellites (presently) by incorporation of NASA and USGS and they have been launched since 1972. Recently just Landsat-7 and Landsat-8 sa-tellites are active (available) which are launched in 1999 and 2013, respectively.
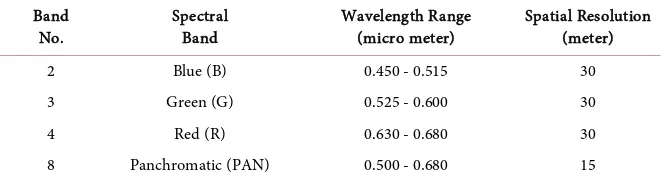
and TIRS and they provide images in nine and two frequency bands, respective-ly. The OLI sensor provides multispectral images which contain almost all of the ETM+ bands. However, they have been improved in SNR and spatial resolution. This sensor takes images in visible and IR, and the TIRS sensor which is consi-dered as a thermal sensor, just takes images in two IR bands. Some of the OLI sensor’s bands are presented in Table 1. Lansat-8 collects spatial data with me-dium resolution (30 meters). The TIRS thermal sensor has a 100 meters resolu-tion in both of its frequency bands where this resoluresolu-tion is considered a weak accuracy. Landsat-8 images are freely available and their format is Geo-TIFF, a file format for lossless storage which is geo-referenced. Therefore, they are not required to the geometrical corrections. Combination of 2nd, 3rd and 4th bands makes a visible image with 30 meters resolution and the 8th band which con-tains the widest spectrum of visible light (it concon-tains about two third of the spec-trum) has 15 meters resolution (each pixel shows 225 m2 on the ground), so it has a good resolution as seen in Table 1. This band named panchromatic and is considered as the highest resolution band in the OLI sensor [3].
[image:3.595.208.539.644.734.2]As follows, we overview some fusion approaches, however due to the concen-tration on another process (i.e. interpolation [4][5] [6]), this overview will be short. Optical/passive remote sensing satellites provide multispectral (MS) and panchromatic (PAN) images which have different spatial, spectral, radiometric, temporal resolution/accuracy. The multispectral images have high spectral in-formation and low spatial inin-formation, whereas the PAN image has lower spec-tral and high spatial information. Fusion of the low (spatial) resolution multis-pectral images and the high (spatial) resolution PAN images has been a hot problem. The synthetic high spatial and spectral resolution MS image can pro-vide increased interpretation capabilities and more reliable results [7][8]. Dur-ing the last two decades, various fusion approaches have been developed. These methods are mainly divided into four categories: projection-substitution-based methods, relative spectral contribution methods, ARSIS-based fusion methods and model-based methods [8][9]. In [9] differences among these schemes have explicitly been explained. The rest of this paper is organized as follow. Second section expresses the foundations of the proposed method, third section over-views a specific interpolation algorithm entitled linear minimum mean square error-estimation (LMMSE), the forth section evaluates the proposed idea for better image fusion in the Landsat-8 sensor and final section is conclusion of all topics discussed in this paper.
Table 1. Spectrum of OLI.
Spatial Resolution (meter) Wavelength Range
(micro meter) Spectral
Band Band
No.
30 0.450 - 0.515
Blue (B) 2
30 0.525 - 0.600
Green (G) 3
30 0.630 - 0.680
Red (R) 4
15 0.500 - 0.680
2. Fundamentals and an Insight on the Proposed Method
[image:4.595.70.538.548.700.2]There are two principle approaches in colorization of grayscale images. First ap-proach contains the ways which use virtual color to produce color images. Still the only way of colorization in some specific applications is to use these tech-niques although they are mainly ancient. The second approach contains the ways that use another color image to produce color in a grayscale image. Generally, this color image might be produced by other tools or the same tools. In this ar-ticle, the second way will be studied which means that we want to colorize the grayscale image with a color image which has been provided by the same sensor. This process is named MS image fusion or pan-sharpening and previously with emphasis on details of fusion technique has been performed, but we are going to apply the concept of interpolation process that did not have suitable attentions in the past studies. In fact, we see many important software tools such as ENVI and ERDAS as the most famous remote sensing image processing tools have on-ly classical interpolation techniques (such as BL and CC) and therefore ENVI- and ERDAS-based researches in image fusion area and even other fusion re-searches often don’t use new and better interpolators. So we only focus on in-terpolation impact in fusion quality in a specific application, i.e. Landsat multis-pectral images. Obviously, these images don’t need to the geometrical correc-tions because they have been provided by the same sensor. The important point in these images is fusing high and middle resolution images. We use an elemen-tary-based way called IHS [10] for the color production process in colorless im-ages. Figure 1 shows general processing steps in image fusion and also the IHS fusion technique used here. We have shown the importance of interpolation in this figure as an internal process. According to the IHS technique, we transform the colored image from RGB to HSI color space. Then color information which is in hue and saturation attributions, are taken and after resizing with the pan-chromatic image, they are fused with this image and the result converts to RGB space again. Color transformations have different ways in various color spaces. Due to the use of HSI (HSV) color space model in this article [11] [12],
the Kruse and Raines method [13], which is optimal for USGS images, is used for IHS processing.
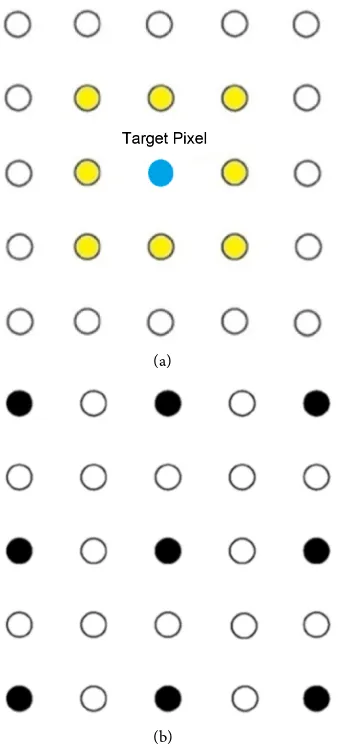
Therefore in addition to the IHS method, another question should be ans-wered which is the resizing issue [14]. This is possible with use of specific inter-polation algorithm based on a statistical linear estimation. The property of this method in comparison to the traditional interpolation technique like CC method is to consider this point that Landsat images can be considered as the images with MRF-based behavior in the most geographical regions. Totally, all the in-terpolation methods often work based on a type of statistical averaging and this action is similar to a low pass filter (LPF), so better methods must be searched in the estimation of missing data. The methods must use effective information for estimation of all the correlated pixels (with an appropriate impact coefficient, see
Figure 2(a)).
(a)
[image:5.595.291.460.279.653.2](b)
3. LMMSE Interpolator
In this section, we discuss about LMMSE interpolation method which was pre-sented in [15], this scheme is a statistical edge-guided scheme and uses four to six nearest neighbors to estimate pixels and so it has good suitability with MRF- based images, as seen in Figure 2(a). An important point about LMMSE is the adaptive approach in LMMSE in comparison to the classical schemes such as cubic convolution (CC) technique which uses sixteen nearest neighbors for pixel estimation. And bi-linear (BL) that by use of only four nearest neighbors esti-mates the target pixel, therefore it is a simple scheme and suitable for the MRF-based images in terms of computational complexity and the impact of neighboring pixels, however it is not adaptive because the experimental results based on grey-scale and color images show that BL is mainly weaker than CC in practice. Outputs of [15] prove LMMSE in grayscale images is better than CC and we will also show in IHS fusion technique (as a color space process), LMMSE is better than CC again. In this study, we should build four times bigger images from two color attributions’ images which have 30 meters resolution (namely, each of their dimensions is two times smaller than its equal grayscale image). To achieve this, we have to estimate 75% of the pixels with using 25% of them. There are several interpolation methods for this estimation but in this specific application with considering the use of affine linear transform for resiz-ing/re-sampling. Therefore, we can use a regular interpolation based on statis-tical estimation which is derived from LMMSE (in some texts entitled DFDF
[15][16][17]). Figure 2(b) shows the transmission of image’s pixels in smaller sizes to a 4-time bigger space. We discuss about LMMSE statistical estimation in continuation of this part. As seen in Figure 3(b), to calculate the directional value of non-existing pixels, firstly in two angles 45 and 135 degrees, two average amounts for sample pixel in location xh(2i, 2j) and the same positions will be calculated which are named x45 and x135 and are derived from Equation (1). Now, we can introduce two error values for these two directions and use them in the next computations. Equation (2) shows the desired error values. In Equation (2), xh(2i, 2j) or in brief xh doesn’t exist, but it can be obtained towards this point that estimation error becomes at least. We name the xh estimation x'h, and this estimation can be achieved in this way that the errors will be minimized. There-fore based on the LMMSE method, to achieve such results, according to the Eq-uation (3), x'h can be known as a linear combination of weights w45 and w135 of x45 and x135 where the estimation error reaches the least amount with choosing the appropriate weights w45 and w135.
(
) (
)
( ) (
)
45
135
, 1 1,
2
, 1, 1
2
x i j x i j
x
x i j x i j
x
+ + +
=
+ + +
=
(1)
(
)
(
)
(
)
(
)
(
)
(
)
45 45
135 135
2 , 2 2 , 2 2 , 2 2 , 2 2 , 2 2 , 2
h h
e i j x i j x i j
e i j x i j x i j
= −
Figure 3. This figure shows the steps of estimation of the non-existing pixels (parts (a) to (d), respectively) [2].
Weighs will be as Equation (4) after the necessary calculations. After the cal-culating w45 and w135, directional error variances are calculated and the variance calculations will be according to Equation (5) where u, S45 and S135 are achieved from Equations (6) and (7), respectively. For other pixels which are in other po-sitions, from two orthogonal directions (0 and 90 degrees) which the pixels amounts were available from before or achieved as the results of statistical esti-mation in Figure 3(b), we estimate the non-existing pixels. The continuation of estimation of non-existing pixels will be continued to complete interpolation of all of new pixels (75%) that are shown in Figure 3(c) and Figure 3(d).
{
}
{
(
)
}
45 135
45 45 135 135
45 135
2 45 135
1
1 , arg min
h
h h
w w
x w x w x
w w
w w E x x
+ =
′ = +
+ =
′
= −
(3)
( )
( )
( )
( )
( )
( )
2 135
45 2 2
45 135
2 45
135 2 2 45
45 135
1 e
w
e e
e
w w
e e
σ
σ σ
σ
σ σ
=
+
= = −
+
( )
(
( )
)
( )
(
( )
)
3 2
2
45 45
1
3 2
2
135 135
1
1 3 1 3
k
k
e S k u
e S k u
σ
σ
=
=
= −
= −
∑
∑
(5)45 135
2
x x
u= + (6)
(
)
(
)
{
}
( )
(
)
{
}
45 45
135 135
, 1 , , 1,
, , , 1, 1
S x i j x x i j
S x i j x x i j
′
= + +
′
= + + (7)
4. Simulations
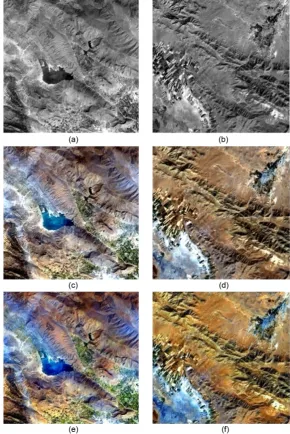
[image:8.595.226.517.277.712.2]To evaluate the proposed method, two panchromatic images shown in Figure 4(a) and Figure 4(b), with 15 meters resolution, are colorized with color images
from combination of 2nd, 3rd, and 4th bands of the OLI, with 30 meters resolu-tion, shown in Figure 4(c) and Figure 4(d). The colorized outputs (fused im-ages) are shown in Figure 4(e) and Figure 4(f), respectively. The noticeable quality of the proposed method is based on using the appropriate interpolation. Although in fusing MS images by use of IHS technique, correction for the color weights is often done because of the effect of IR band in panchromatic, see [10]
for more information, but it is not used here. For precise assessment of images quality, we should use some appropriate metrics. We know that a visual assess-ment is not enough; therefore, it is necessary to apply the metrical (computa-tional) quality assessment (QA) along the visual quality assessment. Metrical quality assessment which has two types objective QA and subjective QA, is itself an independent research field and lots of researchers have proposed many dif-ferent metrics for various applications in image QA (IQA). The used quality as-sessment metric in here named SSIM, by Wang et al. [18]. This metric is com-pletely based on human visual system (HVS) and natural sense statistics (NSS)
[image:9.595.208.538.484.704.2][19]. The SSIM which was presented by Wang is also a full reference metric (for example the PNSR as a most common quality assessment metric for similarity evaluation is a full reference metric) which means the original image has to be accessible. And in addition, it doesn’t have a good matching with HVS and therefore this application is not appropriate because the reference image is not completely accessible. This problem was solved by Yang et al. [20] and it is possible to use this metric in such applications. Figure 5 shows the collections of output image pixels for comparison to the main color image, this process is named down-sampling and is a common way for assessment in digital image processing. Totally, the metrical quality assessment has three types: full refer-ence, reduced reference and no reference [18][21]. The second state is discussed
in this article. SSIM has been shown in Equation (8). In this equation, amounts and σx and σy are standard deviations for them, respectively, and also σxy is small non-negative amounts, see more information in this respect in [18] [22]. The SSIM amount is at least equal to −1 or 0% similarity, and at most +1. In SSIM, maximum similarity is corresponding to the 1 or 100% similarity (uniformly).
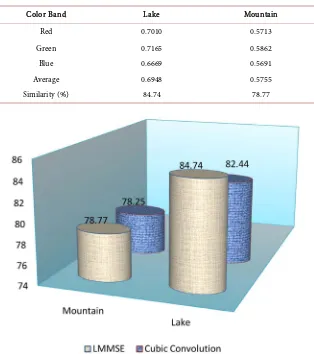
Table 2 shows the SSIM outputs for two fused images of Figure 4(e) and Figure 4(f). The quality of the fusing based on the LMMSE interpolator is obviously confirmed by SSIM. This quality just shows the matching in original image col-ors and fused ones. The color quality of LMMSE-based fusion is shown in Table 2. However, a pre-interpolation for LMMSE has been used like [15] for improv-ing the performance, see [15] in this regard (pre-interpolation may not be a real-time process). Figure 6 shows the results of the proposed method in com-parison to cubic convolution (CC) [23] as a classical method [24].
(
)(
)(
)
(
2 2)(
1 2 2 2)
(
3)
1 2 3
2 2
SSIM x y x y xy
x y x y x y
u u C C C
u u C C C
σ σ σ
σ σ σ σ
+ + +
=
+ + + + + (8)
Table 2. Quality assessment in the fused images using SSIM.
Mountain Lake
Color Band
0.5713 0.7010
Red
0.5862 0.7165
Green
0.5691 0.6669
Blue
0.5755 0.6948
Average
78.77 84.74
Similarity (%)
5. Discussion
One of the best ways for enhancing complex issues is innovative heuristic solu-tions. Almost proving these innovative solutions are not mathematically possi-ble, except with the simulation, namely, the problems are solved by using simu-lation-based solutions [25]. In this study, we see the IHS fusion like a color space process guarantees the better quality of the LMMSE interpolator than the CC. According to hard accessibility to high resolution images, it is necessary to use the easy to achieve images in the best way. The discussed subject in this article is the fusion of grayscale images with color samples with using a statistical inter-polator. The mentioned method according to the existence of certain relevance between panchromatic image dimensions and MS optical image dimensions of other sensors is easily extensible to them.
References
[1] Salari, R., Mohseni, A., Khosravi, M.R. and Rostami, H. (2015) Evaluation of Statis-tical and Nonlinear Adaptive Filters Performance for Noise Reduction of SAR Im-ages. IT2015, Tehran.
[2] Khosravi, M.R., Keshavarz, A., Rostami, H. and Mansouri, S. (2015) Statistical Im-age Fusion for HR Band Colorization in Landsat Sensors. 20th Annual Conference of Computer Society of Iran, Mashhad, 3-5 March 2015, 245-250.
[3] http://Landsat.usgs.gov
[4] Khosravi, M.R. and Rostami, H. (2016) A New Statistical Technique for Interpola-tion of Landsat Images. ICAUCAE2016, Tehran, 7 March 2016, 1-3.
[5] Khosravi, M.R. and Rostami, H. (2016) Improving the Binary Watermark-Based Data Hiding Scheme in Remote Sensing Images. ICAUCAE2016, Tehran, 7 March 2016, 1-3.
[6] Khosravi, M.R., Salari, S.R. and Rostami, H. Analysis of Modeling Error in Digital Image Spatial Estimation Based on LMMSE Algorithm. Journal of New Ideas on Science and Technology. (In Press)
[7] Pohl, C. and Genderen, J.L. (1998) Multi-Sensor Image Fusion in Remote Sensing: Concepts, Methods, and Applications. International Journal of Remote Sensing, 19, 823-854. https://doi.org/10.1080/014311698215748
[8] Thomas, C., Ranchin, T., Wald, L. and Chanussot, J. (2008) Synthesis of Multispec-tral Images to High Spatial Resolution: A Critical Review of Fusion Methods Based on Remote Sensing Physics. IEEE Transactions on Geoscience and Remote Sensing, 46, 1301-1312. https://doi.org/10.1109/TGRS.2007.912448
[9] Wang, W., Jiao, L. and Yang, S. (2014) Fusion of Multispectral and Panchromatic Images via Sparse Representation and Local Autoregressive Model. Information Fu-sion, 20, 73-87.
[10] Choi, M.J., Kim, H.C., Cho, N.I. and Kim, H.O. (2007) An Improved Intensi-ty-Hue-Saturation Method for IKONOS Image Fusion. International Journal of Remote Sensing, 1-10.
[11] Moghimi, M.K. and Pourghassem, H. (2015) Shadow Detection Based on Combina-tions of Hessenberg Decomposition and Principal Component Analysis in Surveil-lance Applications. IETE Journal of Research, 61, 269-284.
https://doi.org/10.1080/03772063.2015.1018848
[12] Moghimi, M.K. and Pourghassem, H. (2014) Shadow Detection Based on Combina-tions of HSV Color Space and Orthogonal Transformation in Surveillance Videos.
Iranian Conference on Intelligent Systems, Bam, 4-6 February 2014, 1-6.
by Contrast Stretching in Munsell Color Space. Proceedings of the International Symposium on Remote Sensing of Environment,3rd Thematic Conference: Remote Sensing for Exploration Geology, Ann Arbor, 755-760.
[14] Gonzalez, R.C. and Woods, R.E. (2008) Digital Image Processing. 3rd Edition, Prentice Hall, Upper Saddle River.
[15] Zhang, L. and Wu, X. (2006) An Edge-Guided Image Interpolation Algorithm via Directional Filtering and Data Fusion. IEEE Transactions on Image Processing, 15, 2226-2238. https://doi.org/10.1109/TIP.2006.877407
[16] Khosravi, M.R., Salari, R. and Rostami, H. (2015) Analysis of Modeling Error in Digital Image Spatial Estimation. IT2015, Tehran.
[17] Luo, L., Chen, Z., Chen, M., Zeng, X. and Xiong, Z. (2010) Reversible Image Wa-termarking Using Interpolation Technique. IEEE Transactions on Information Fo-rensics and Security, 5, 187-193.
[18] Wang, Z., Bovik, A.C., Sheikh, H.R. and Simoncelli, E.P. (2004) Image Quality As-sessment: From Error Visibility to Structural Similarity. IEEE Transactions on Im-age Processing, 13, 600-612.
[19] Sheikh, H.R. and Bovik, A.C. (2006) Image Information and Visual Quality. IEEE Transactions on Image Processing, 15, 430-444.
https://doi.org/10.1109/tip.2005.859378
[20] Yang, C., Zhang, J.Q., Wang, X.R. and Liu, X. (2008) A Novel Similarity Based Quality Metric for Image Fusion. Information Fusion, 9, 156-160.
[21] Luo, X.Y., Zhang, J. and Dai, Q.H. (2012) Saliency-Based Geometry Measurement for Image Fusion Performance. IEEE Transactions on Instrumentation and Mea-surement, 61, 1130-1132. https://doi.org/10.1109/tim.2011.2174898
[22] Khosravi, M.R., Khosravi, A., Shadloo-Jahromi, M. and Keshavarz, A. (2015) A Novel Fake Color Scheme Based on Depth Protection for MR Passive/Optical Sen-sors. KBEI2015, Tehran, 5-6 November 2015, 362-367.
[23] Keys, R. (1981) Cubic Convolution Interpolation for Digital Image Processing. IEEE Transactions on Acoustics, Speech, and Signal Processing, 29, 1153-1160.
https://doi.org/10.1109/TASSP.1981.1163711
[24] Wald, L. (1999) Some Terms of Reference in Data Fusion. IEEE Transactions on Geoscience and Remote Sensing, 37, 1190-1193. https://doi.org/10.1109/36.763269
[25] Khosravi, M.R., Basri, H., Khosravi, A. and Rostami, H. (2015) Energy Efficient Spherical Divisions for VBF-Based Routing in Dense UWSNs. KBEI2015, Tehran, 5-6 November 2015, 362-367.
Submit or recommend next manuscript to SCIRP and we will provide best service for you:
Accepting pre-submission inquiries through Email, Facebook, LinkedIn, Twitter, etc. A wide selection of journals (inclusive of 9 subjects, more than 200 journals)
Providing 24-hour high-quality service User-friendly online submission system Fair and swift peer-review system
Efficient typesetting and proofreading procedure
Display of the result of downloads and visits, as well as the number of cited articles Maximum dissemination of your research work
Submit your manuscript at: http://papersubmission.scirp.org/