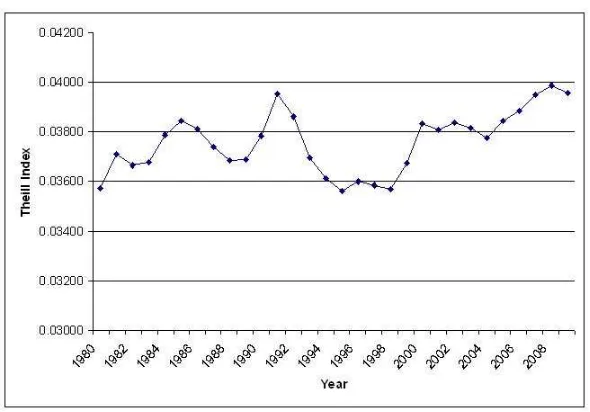
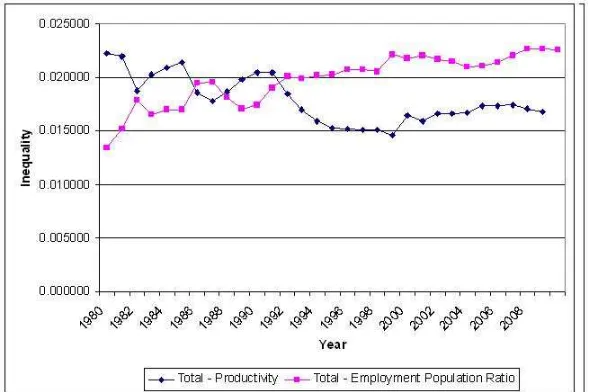
Decomposing European NUTS2 regional inequality from 1980 to 2009: national and European policy implications
Full text
Figure


Related documents
monilifer from Mar del Plata (northern Argentina), females that succeed in spawning showed significantly lower imposex incidence (imposex % and penis length) than the rest
the initial WCET estimation given by OTAWA, together with the corresponding speed-up factor which indicates how “faster” is the optimized code compared to the non-optimized one;
3 On receipt of an appeal, the Director of Academic Affairs or his/her nominee shall acknowledge receipt normally within three working days and, where appropriate to the
According to Sharif, et al (2012), an environment in which the tutee feels comfortable leads to improved speaking skills. Although this is outside the scope of this research, over the
Figure 4. VEG03-C Pillow Ground and Flight Aerobic Plate Counts for Wick Root and Soil. VEG03-C pillow bacterial APC. Standard deviation not shown for wick and root samples
Visit Clearances for unclassified meetings are not required at the TASC Crown Center Facility.. Meeting participants must alert a TASC representative at check-in if


