http://www.scirp.org/journal/epe
ISSN Online: 1947-3818 ISSN Print: 1949-243X
Practical Dynamic Security Region Based on
Phase Trajectory
Yi Gao
1, Jiangtao Chang
2, Chao Qin
2, Yuan Zeng
2, Yingying Liu
1, Shengwei Li
1 1State Grid Tianjin Power Economics & Technology Research Institute, Tianjin, China2Key Laboratory of Smart Grid of Ministry of Education, Tianjin University, Tianjin, China
Abstract
A fast method based on the phase trajectory to compute DSR is developed. Firstly, the phase trajectory sensitivity has more linear effect than power angle sensitivity. According to the phase trajectory boundary function, controlling unstable equilibrium generators could be identified. The PDSR is finally ob-tained by the sensitivity analysis between the phase and generators’ active power. Test results on the New England 10-genrator 39-bus system are pre-sented and prove the effectiveness of this approach.
Keywords
The Phase Trajectory, Sensitivity Analysis, Controlling Unstable Equilibrium Mode, PDSR
1. Introduction
The dynamic security region (DSR) is defined as the set of input power space before the accident. All the injection points in the set can guarantee the transient stability of the system after a given accident. DSR is related to the network topology and ex-pected accident of the system, but not related with the change of the base point, and can be calculated offline. For online applications, the transient stability could be quickly identified, depending on whether the current injection is within the DSR. At the same time, it is possible to compute the distance from the operating point to each boundary, which represents the security margin of the system in different directions. Compared with traditional methods such as time domain simulation, DSR can pro-vide more comprehensive security margin and auxiliary control decision for system operators.
A large number of studies have shown that [1] [2] [3], the boundary of DSR is expressed by the upper and lower active power injection limits of each bus,
How to cite this paper: Gao, Y., Chang, J.T., Qin, C., Zeng, Y., Liu, Y.Y. and Li, S.W. (2017) Practical Dynamic Security Region Based on Phase Trajectory. Energy and Power Engineering, 9, 503-514. https://doi.org/10.4236/epe.2017.94B056
and hyper planes which are composed of critical operating points injection. It is also called the practical dynamic security region (PDSR).
The methods to calculate PDSR can be divided into two categories includ-ing fittinclud-ing and analytic methods. The fittinclud-ing method uses a large number of critical injection points calculated by numerical simulation to fit the PDSR boundary expression [1]. But in the real large-scale power grid, the number of generators is large, and the direction of the critical point search will increase exponentially, which makes the PDSR face great difficulties in the practical process. And in the process of searching the critical point, the transient sta-bility is generally judged by the relative power angle difference of any two generators is greater than a certain critical value. It does not consider the change of power angle and angular velocity of the generator when adjusting active power of generators. This critical point search algorithm ignores a lot of useful information.
Analytic method is the use of transient stability direct method to quickly calcu-late the PDSR boundary [2]. In paper [2], the critical hyperplane of PDSR corres-ponds to the instability mode of the system. In paper [3], the PDSR boundary of different unstable modes is calculated. In paper [4], the analytical expression of the DSR is calculated by the applying property that the transient stable boundaries at different critical injection powers at the controlling unstable equilibrium point (CUEP) is approximate parallel. In paper [5], the approximate parallel property of the transient stability domain boundary is extended to the spillover point, and a practical method of DSR is given by applying the transient energy function, CUEP and the direct method of trajectory in the relevant fault. However, the direct me-thod generally has the drawbacks of complex meme-thod and low calculation preci-sion. Especially in the large power grid, the complex operating environment is not conducive to the establishment of the energy function.
In paper [5], the approximate parallel property of the transient stability domain boundary is extended to the spillover point, and a practical method of DSR is given by applying the transient energy function, CUEP and the direct method of trajectory in the relevant fault. However, the direct method gener-ally has the drawbacks of complexity and low calculation precision. Especigener-ally in the large power grid, the complex operating environment makes it difficult to the establishment of the energy function.
In recent years, with the construction and development of the PMU and WAMS in the electrical power system, it has become possible to obtain the generator trajectory information in real time [6] [7]. The real-time responsive trajectory of the generator directly reflects the transient stability characteris-tics of the power system. The transient stability analysis and control based on the measured trajectory information are accurate and independent of the model and parameters of generators. In papers [7] and [8], a method, is pro-posed to judge the transient stability of power system according to the
gene-rators’ phase trajectory of real-time system. It has simple and flexible features.In paper
of power angle space is proposed, which has the advantage of not relying on the result of grouping.
In this paper, a method to calculate the PDSR boundary is proposed. It uses the
ge-nerators’ phase trajectory including the power angle δ and angular velocity ω. Based on
the transient stability criterion of the phase trajectory [7] [8], it proves that the
sensitiv-ity analysis method of the phase trajectory function f has better linearity than the
pow-er angle sensitivity when approaching the unstable equilibrium point in the sin-gle-machine infinite system. Then in the multi-machine system, the sensitivity matrix
S based on the phase trajectory function f is proposed according to the multi-machine
system phase trajectory instability criterion. Finally, the practical dynamic region is es-tablished at the unstable equilibrium point according to the sensitivity of the boundary function f.
2. The Phase Trajectory Analysis
2.1. The Stability Criterion of Phase Trajectory in Single-Machine
Infinite System
The motion equation of single machine infinite system could be expressed as:
m e
M P P D
δ ω
ω ω
=
= − −
(1)
where δ is the phase angle of generators; ω is angular velocity deviation from
the synchronous electrical angular velocity. M is the inertia time constant; Pm
is the generators’ mechanical power; Pe is the generators, electromagnetic
power; D is the generators’ damping coefficient.
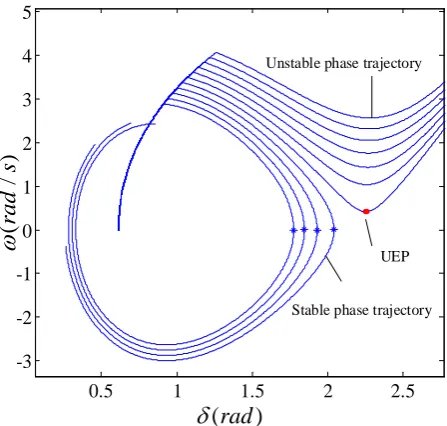
In phase trajectory analysis, the phase angle δ is the abscissa and the
angu-lar velocity ω is the ordinate. The phase trajectories of the generator are
shown in Figure 1 in different fault removal times.
0.5 1 1.5 2 2.5
-3 -2 -1 0 1 2 3 4 5
(
/)
rad
s
ω
(
rad
)
δ
UEP
[image:3.595.262.486.484.697.2]Stable phase trajectory Unstable phase trajectory
Ignoring the damping and regardless of regulator and governor role, formula-tion (1) can be written:
m e
M P P D
δ ω
ω ω
=
= − −
(2)
In order to study the relationship between the trend of phase trajectory and
the transient stability of the system, the first order derivative D1 and the second
order derivative D2 [8] of the phase trajectory are obtained:
e max 1
(Pm P sin ) /M
d D
d
δ ω
δ ω
−
= = (3)
2 2
e max e max
1
2 3 2
cos ( m sin )
MP P P
dD D
d M
ω δ δ
δ ω
+ −
= = − (4)
When the second order derivative D2 is 0, the formulation needs:
2 2
e max e max
( cos ( m sin ) ) 0
f = − MP ω δ+ P −P δ = (5)
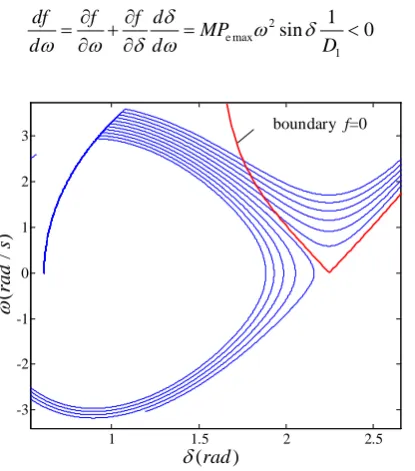
As shown in Figure 2, there is a clear boundary, affecting the trend of D1. The
phase plane is divided into two parts. The left part of the second derivative has
D2 < 0, and the right part of the second derivative has D2 > 0.
In paper [7], if there is no intersection between the phase trajectory and the
boundary function f, the system is transient stable. The system is transient
unstable when there is intersection. So for any point on the phase trajectory, the transient stability of the system can be determined according to whether the
boundary function f is less than 0. Then the transient stability criterion based on
the phase trajectory is:
m e
( , , , ) 0
f δ ω P P < (6)
In Single-machine Infinite System, when Pm and Pe remian unchanged, for-
mulation (6) shows:
2 e max
1
1
sin 0
df f f d
MP
d d D
δ ω δ
ω ω δ ω
∂ ∂
= + = <
∂ ∂ (7)
1 1.5 2 2.5
-3 -2 -1 0 1 2 3
(
/)
rad
s
ω
(rad)
δ
[image:4.595.272.480.479.715.2]boundary f=0
When ω decreases monofonicallythe phase boundary function f increases monofonically. The formulation to judge the transient stability could be writed:
min
( , ) 0
f δ ω < (8)
The maximum of function f is f
(
δr, 0)
when ω =0. If f(
δr, 0)
<0, thesystem is transient stable. Otherwise,the system is transient unstable.
2.2. The Phase Trajectory Sensitivity
The traditional formulation to judge the transient stability using the phase angle:
u
δ δ< (9)
where δu is the unstable equilibrium point (UEP);
When the power system is stable:
2 e max
( , 0, m)= ( m sin ) 0
f δ P − P −P δ < (10)
When Pm increases, δr →δu, and f increase. So, when the system is
transient stable, the two criterion is equal.
For the sake of convenience, the following Pm is denoted as P. From the above
section, we know that if the system transient stability, the maximum value of f is
the value of the the back point
(
δr, 0)
. So we havedefinition of phase trajectorysensitivity:
e max e max
( , 0, )
2( sin )(1 cos )
r
r
r r
df P
dP
d
P P P
dP
δ
δ
δ δ
= − − − (11)
When the back point closes to the unstable equilibrium point δr → δu, we
define the deceleration power Pdec = −P Pe maxsinδr:
e max
lim sin 0
r u
dec u
P P P
δ →δ = −
δ
= (12)The trajectory sensitivity formula could be writen:
e max
( , 0, )
2 (1 cos )
r r
dec r
df P d
P P
dP dP
δ δ δ
= − − (13)
When δr →δu, Phase trajectory sensitivity is a high order infinitesimal
sensitivity of the power angle.Then, as a sensitivity index, especially near the unstable equilibrium point (UEP), the phase trajectory sensitivity has a better linear effect.
It can be seen that, compared with the power angle stabilitycriterion, when the
generator’s active output changes, the phase trajectory stability criterion f has
a better linearity, which has great advantages in transient stability margin
analysis and sensitivity analysis. When the generator’ active power output Pm
changes, the unstable equilibrium point δu is shifted, the criterion of the phase
trajectory f does not change.
2.3. The Phase Trajectory Sensitivity in Multi-Machine System
, 1, 2 , ( ) i i i N mi ei i d dt i n d P P dt M δ ω ω ω = = ⋅⋅⋅ = − (14)
where δi is the phase angle of generator i, rad; ωi is angular velocity
devia-tion of generator i, rad/s; ω =N 2πfN is the synchronous electrical angular
velocity; M is the inertia time constant of generator I, s; Pmi is the
mechani-cal power of generator i; Pei is electromagnetic power of generator i; t is
time, s; In phase trajectory analysis of multi-machine system, the phase angle
i
δ is the abscissa and the angular velocity ωi is the ordinate.
According to the above analysis, the transient stability criterion of multi-ma- chine system based on phase trajectory is shown as follows:
0 1, 2, ,
i
f < i= n (15)
For the multi-machine system phase trajectory analysis, the change of active
power output of generator i cause that the power angles of all generators
changes in entire system. For different geographical location of the unit, the im-pact is also very different.
For a system with n generators, a phase trajectory sensitivity matrix is defined
for a certain operating point:
1 1 1
1 2
2 2 2
1 2 2
1 2
...
...
...
n
n n n
n
f f f
P P P
f f f
P P P
f f f
P P P
∂ ∂ ∂ ∂ ∂ ∂ ∂ ∂ ∂ ∂ ∂ ∂ = ∂ ∂ ∂ ∂ ∂ ∂
S (16)
When the active power of generators changes ΔP, the phase trajectory
formu-lation to judge the transient stability:
0
+ ∆ <
f
S P
(17)where ∆ = ∆ ∆P
[
P1, P2,,∆Pn]
represents the matrix of generators’ activepow-er change. f =
[
f1,f2,,fn]
.For the multi-machine system, how to correctly identify the cause of system instability, in other words, how to find the cause of the system instability by
0
i
f > , is the first step of multi-machine system phase trajectory.
3. Construction of PDSR Based on Phase Trajectory Analysis
3.1. Practical Dynamic Security Region
The practical dynamic security region is defined [10] in power injection space:
1
1 1
1
1, 2, , 1 n i i n i d m M
i i i
a P R
P P P i n
− − = ≤
Ω = ∈
≤ ≤ = −
∑
P (18)
ma-chine. P is the active power injection vector. Pi is the active power injection of
bus i. m
i
P and PiM is the upper limit and lower limit of the active power
injec-tion; a ii
(
=1, 2,… −,n 1)
is the coefficient of critical hyper-planes; Rn−1 is N − 1dimensional real number space.
3.2. Relationship between Phase Trajectory Criterion and PDSR
In the phase trajectory analysis, the criteria to judge transient stability of the system are as follows:min
( , ) 0 1, 2, ,
i
f δ ω < i= n (19)
From the above analysis, combined with the sensitivity matrix S, when the
generators’ active power output changes, the formula to judge transient stability system is as follows:
1
0 1, 2, ,
n i
i j
j j
f
f P i n
P
=
∂
+ ∆ < =
∂
∑
(20)The formula is deformed as follows:
1
1
1 1, 2, ,
n i j j i j f
P i n
f = P
∂
− ∆ < =
∂
∑
(21)Comparing formula (18), we can see that formula (21) is the effective defor-mation of the practical dynamic security region. From paper [3], the boundary of the security region corresponds to the unstable mode of the system.
3.3. Bus Injection Constraint
The upper and lower limit of generator’ active power:
m M
j j j
P ≤P ≤P (22)
The constraints of balancing machine’ active power:
m M
s s s
P ≤P ≤P (23)
Considering the power balance of the system:
1 1 n s j j P P − =
∆ = − ∆
∑
(24)Then the bus injection constraint is given:
m M
j j j j j
P −P ≤ ∆ ≤P P −P (25)
1
m M
1 n
s s j s s
j
P P P P P
−
=
− ≤ − ∆ ≤
∑
− (26)3.4. The Boundary of PDSR Based on Phase Trajectory Analysis
Substituting Equation (24) into Equation (21):-1
1
1
( ) 1 1, 2, ,
n
i i
j j
i j s
f f
P i n
f = P P
∂ ∂
− − ∆ < =
∂ ∂
∑
(27)the generator j: i i j j s f f P P
α = ∂ − ∂
∂ ∂ (28)
The PDSR boundary dominated by the generator i based on the phase
trajec-tory is: 1 1 m M 1 m M 1 1 1 n j j j i
j j j j j
n
s s j s s
j
P f
P P P P P
P P P P P
α
−
=
−
=
− ∆ <
− ≤ ∆ ≤ − − ≤ − ∆ ≤ −
∑
∑
(29)For the actual system, there are a large number of generators. The security region defined by formula (29) only needs to establish the boundary of the security domain where the critical generator is destabilized. In this case, the critical function f in the plane is only considered to be easy to be destabilized.
When adjusting active power output of the generator i to the upper limit, if the
sys-tem becomes transient unstable, there is unstable mode of syssys-tem controlled by
gene-rator i. And this controlling PDSR boundary is under the node injection constraint.
The dichotomy is used to search the critical point of the unstable mode. The gene-rator set with large transient influencing factor is selected according to the sensitivity S, and selected as the coordinate axis of the reduced PDSR.
3.5. Algorithmic Flow
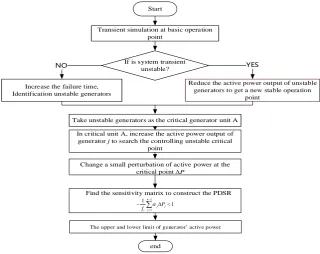
For the basic operation and a given fault, when the fault duration t, the algorithm flow
is as follows in Figure 3:
Take unstable generators as the critical generator unitA In critical unit A, increase the active power output of
generator j to search the controlling unstable critical point
Find the sensitivity matrix to construct the PDSR Increase the failure time,
Identification unstable generators
Start
end
Transient simulation at basic operation point
If is system transient unstable?
Reduce the active power output of unstable generators to get a new stable operation
point
YES NO
Change a small perturbation of active power at the critical point∆P
1 1 1 1 n j j j i P f α − =
− ∑ ∆ <
[image:8.595.206.527.458.712.2]The upper and lower limit of generator’ active power
4. Sample
In this paper, the method proposed in the paper is tested on the New England 10-generator 39-bus system. The wiring diagram is shown in Figure 4, the sys-tem model parameters is got in literature [11].
Fault 1
This system takes the bus 31 as the balancing machine. The fault state is set as three-phase short circuit fault of 15 - 16 line in the system, cleared 0.12 seconds later.
1) The phase trajectory of the generator is obtained by time-domain simula-tion of the initial operating point;
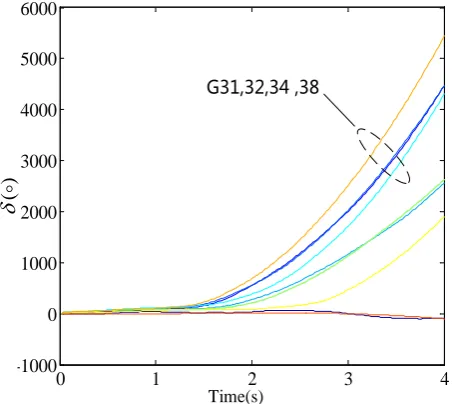
2) The power angle curve of instability is obtained by increasing the failure
time to t = 0.22 s, as shown in Figure 5. The critical set A = (G32, G34, G38)
(G31 is the balancing machine);
3) In the critical set A, the generator’ active power output is increased to the
upper limit. If the system is unstable, the controlling unstable generator G32 is identified;
4) The controlling unstable critical point of generator is searched by Dichot-omy;
[image:9.595.212.530.393.717.2]5) The sensitivity α is obtained based on the critical point as shown in Table 1.
0 1 2 3 4 -1000
0 1000 2000 3000 4000 5000 6000
Time(s)
()
δ
[image:10.595.260.487.72.274.2]G31,32,34 ,38
Figure 5. Unstable power angle curves.
Table 1. Sensitivity of generators in IEEE-39.
Generator number Sensitivityα G30
G32 G33 G34 G35 G36 G37 G38 G39
−0.2801 0.3338 −0.1282 −0.1439 −0.2073 −0.1019 −0.2675 −0.1910 −0.3085
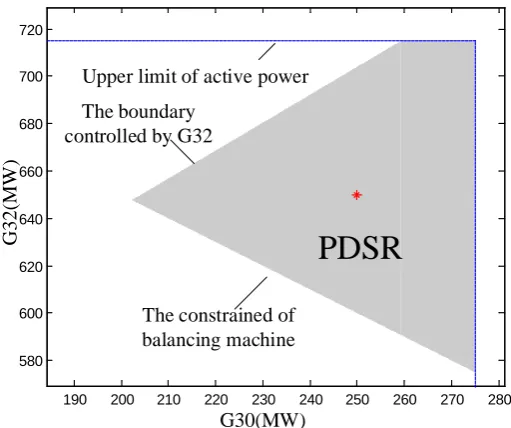
The PDSR with G32 as the controlling unstable mode is obtained. For the visual representation, the generator G30is selected as the auxiliary axis. The PDSR (shaded area) is shown in the Figure 6;
6) In the two-dimensional security region composed by G30 and G32, we consider the upper limit of active power output of balancing machine G31 and the upper limit of active power output of G30 and G32, and draw the two-di- mensional PDSR.
In order to verify the correctness of the DSR calculation results, several oper-ating points are selected in the injection space of the system. The direction to choose operating points is from the basic operating point toward the G32 con-trolling boundary. Time-domain simulation is used to prove the accuracy of PDSR.
[image:10.595.207.539.325.492.2]190 200 210 220 230 240 250 260 270 280 580
600 620 640 660 680 700 720
The boundary controlled by G32
The constrained of balancing machine
PDSR
Upper limit of active power
G30(MW)
G
32
(MW
[image:11.595.245.501.71.285.2])
Figure 6. PDSR controlled by G32.
0 0.2 0.4 0.6 0.8 1 -50
0 50 100 150 200 250 300 350 400
()
δ
Time(s)
[image:11.595.265.482.323.523.2]G32
Figure 7. Unstable power angle curves.
Table 2. The result of timing simulation.
Operating point G30/MW G32/MW Criterion of PDSR Time-domain simulation 1
2 3 4
240 235 230 220
670 680 690 710
Yes Yes No No
Stable Stable Unstable Unstable
[image:11.595.206.540.572.659.2]5. Conclusion
In this paper, a method to solve practical dynamic security region is proposed based on the phase trajectory analysis. It studies the variation of the phase angle and angular velocity when the generators’ active power changes. Based on the
analysis of phase trajectory stability function f and phase trajectory sensitivity
matrix S, an effective relation between the criterion of phase trajectory and
dy-namic security region is established. The PDSR is obtained by the analysis of the phase trajectory. The result has shown that this method does not need a lot of critical points and the calculation speed is improved greatly.
Acknowledgements
This work is supported by the National Science Foundation of China (No.51377118) and the project of State Grid Tianjin Electric Power Company (KJ15-1-08).
References
[1] Zeng, Y.L., Fan, J., Yu, Y., et al. (1990) Practical Dynamic Security Regions of Bulk Power Systems. Automation of Electric Power Systems.
[2] Yu, Y. (1990) Practical Dynamic Security Regions of Power Systems. Proceedings of the CSEE.
[3] Min, L., Yu, Y., Lee, S.T., et al. (2004) Identification Method of Instability Modes and Its Application in Dynamic Security Region. Automation of Electric Power Sys-tems, 28, 28-32.
[4] Zeng, Y. and Yu, Y. (2002) A Practical Direct Method for Determining Dynamic Security Regions of Electrical Power Systems. Power System Technology,
Proceed-ings. Power Con 2002. International Conference on. IEEE, 2, 1270-1274.
[5] Xue, A.C., Mei, S.W., Qiang, L.U., et al. (2005) Approximations for the Dynamic Security Region of Network-reduction Power System. Automation of Electric Power Systems, 29, 18-23.
[6] Chang, N.C., Zhou, L., Gan, D.Q., et al. (2005) A Survey on Applications of Wide-Area Measurement System in Power System Analysis and Control. Power
System Technology, 29, 46-52.
[7] Zhang, B., Yang, S. and Wang, H. (2014) Closed-loop Control of Power System Transient Stability (1): Transient Instability Detection Principle of Simple Power System. Electric Power Automation Equipment, 34, 1-6.
[8] Gu, Z.Y., Yong, T., Sun, H., et al. (2013) An Identification Method for Power System Transient Angle Stability Based on the Trend of Rotor Speed Difference-rotor Angle Difference. Proceedings of the Chinese Society of Electrical Engineering, 33, 65-72. [9] Cen, B., Tang, F., Liao, Q., et al. (2015) Transient Stability Detection Using Phase
Trajectory Obtained by Dimension Reduction Transform of Power Angles. Pro-ceedings of the Chinese Society of Electrical Engineering, 35, 726-2734.
[10]Yu, Y. (2003) Methodology of Security Region and Practical Results. Journal of
Tianjin University (Science and Technology), 36, 525-528, 2003.
Submit or recommend next manuscript to SCIRP and we will provide best service for you:
Accepting pre-submission inquiries through Email, Facebook, LinkedIn, Twitter, etc. A wide selection of journals (inclusive of 9 subjects, more than 200 journals)
Providing 24-hour high-quality service User-friendly online submission system Fair and swift peer-review system
Efficient typesetting and proofreading procedure
Display of the result of downloads and visits, as well as the number of cited articles Maximum dissemination of your research work
Submit your manuscript at: http://papersubmission.scirp.org/