Munich Personal RePEc Archive
Context dependent cheating:
Experimental evidence from 16 countries
Pascual-Ezama, David and Fosgaard, Toke R. and Cardenas,
Juan Camilo and Kujal, Praveen and Veszteg, Robert and
Gil-Gómez de Liaño, Beatriz and Gunia, Brian and
Weichselbaumer, Doris and Hilken, Katharina and Antinyan,
Armenak and Delnoij, Joyce and Proestakis, Antonios and
Tira, Michael D. and Pratomo, Yulius and Jaber-López,
Tarek and Brañas-Garza, Pablo
2014
Online at
https://mpra.ub.uni-muenchen.de/60629/
Context dependent cheating: Experimental evidence from 16 countries
David Pascual-Ezama1*, Toke R. Fosgaard2, Juan Camilo Cardenas3, Praveen Kujal4, Robert Veszteg5, Beatriz Gil-Gómez de Liaño6, Brian Gunia7, Doris Weichselbaumer8, Katharina Hilken9, Armenak Antinyan10, Joyce Delnoij11, Antonios Proestakis12, Michael D. Tira13, Yulius Pratomo14, Tarek Jaber-López15, Pablo Brañas-Garza16.
Corresponding author: David Pascual-Ezama, Department of Financial Economy and Accounting, Universidad Complutense Madrid, Campus Somosaguas, Madrid, 28223, Spain. Phone number: 0034 630176315. Fax number: 0034 910102708. [email protected]
Affiliations:
1
Department of Financial Economy and Accounting, Universidad Complutense Madrid, Campus Somosaguas, Madrid, 28223, Spain. [email protected]
2Department of Food and Resource Economics, University of Copenhagen, Rolighedsvej 23, 1958 Frederiksberg C,
Denmark. [email protected]
3Facultad de Economia, CEDE, Universidad de Los Andes, Calle 19A No. 1-37 Este, Bloque W (W-803) , Bogotá,
Colombia. [email protected]
4 Middlesex University Business School, The Burroughs, NW4 4BT, London, UK. [email protected]
5 School of Political Science and Economics, Waseda University, 1-6-1 Nishiwaseda Shinjuku-ku, Tokyo 169-8050,
Japan. [email protected]
6Department of Social Psychology and Methodology, Universidad Autónoma de Madrid, Campus de Cantoblanco
s/n, Madrid, 28049, Spain. [email protected]
7The Johns Hopkins Carey Business School
100 International Drive Baltimore, MD 21202-1099, USA. [email protected]
8Department of Economics and Department of Women's and Gender Studies, University of Linz, Altenbergerstr. 68,
4040 Linz, Austria. [email protected]
9
Department of Applied Economics, Vrije Universiteit Brussel (VUB), PhD fellow of the Research Foundation Flanders (FWO), Pleinlaan 2, 1050 Brussels, Belgium [email protected]
10 University of Erlangen-Nuremberg, Chair of Economic Theory, Lange Gasse 20, 90403 Nuremberg, Germany.
11
Utrecht University School of Economics, Utrecht University, Kriekenpitplein 21-22, 3584 EC Utrecht, The Netherlands. [email protected]
12Institute for Health and Consumer Protection, Joint Research Centre, European Commission, Via Enrico Fermi
2749, Ispra (VA), 21027, Italy. [email protected]
13Department of General Psychology, University of Padua, Via Venezia 12, 35131, Padova, Italy.
14 Department of Economics, Faculty of Economics and Business, Satya Wacana Christian University, Jalan
Diponegoro 52-60, Salatiga, 50711, Indonesia. [email protected]
15 LEEX, Universidad Jaume I de Castellón, Castellón, Spain. [email protected]
Abstract:
Economic loss to society due to dishonesty can be quite large. Policy makers use several international
indices that characterize countries according to the quality of their institutions. However, no effort has
been made to study how the honesty of citizens varies across sixteen countries. This paper explores the
honesty among citizens across sixteen countries and not of the national institutions. We employ a very
simple task where participants face a trade-off between the joy of eating a fine chocolate and the disutility
of having a threatened self-concept because of lying. The experiment was conducted in 16 countries with
1440 participants. Despite the clear incentives to cheat, we find that individuals are mostly honest.
Further, international indices that are indicative of institutional honesty are completely uncorrelated with
citizens' honesty for our sample countries.
Keywords: Honesty, corruption, cultural differences
1. Introduction
Imagine yourself on a university campus. You see the following announcement: “Is this your lucky day?
Flip a coin and win a Chocolate”. You approach the desk and receive the opportunity to win a delicious
and beautifully wrapped Lindt Lindor chocolate truffle by flipping a coin with a black and white side.
You flip the coin in a box at a nearby table; the box protects your anonymity. You win a chocolate if you
report that the white side came up and nothing if you report black. If you actually rolled black, the only
thing keeping you from enjoying the truffle is your moral compass. You face a tradeoff between the joy
of eating a fine chocolate and the individual disutility of having a threatened self-concept because of
lying. There is no social shaming or ostracism. To test how regular citizens around the world behave in
such a situation, we ran this experiment (3 treatments) in 16 countries, and surprisingly we did not find
any main effects of culture across a very heterogeneous set of countries.
Most studies about cultural differences in dishonest behavior have used surveys. Transparency
International reports large differences in corruption around the world and the World Value Survey
documents cross-cultural differences in opinions regarding how “justifiable” it is to cheat on taxes or
public transportation fares. However, corruption indices measure perceptions, not behaviors. Further,
variations across countries in academic dishonesty (Rawwas, Al-Kahtib and Vitell, 2004) and tax evasion
(Alm, Sanchez and de Juan, 1995; Cumming, Martinez, McKee and Torgler, 2009) reinforce the
impression that cheating is both abundant and diverse around the world. In the same line, recent research
in behavioral and experimental economics has shown that a large fraction of individuals are prone to
phone-based incentivized experiment with a representative sample in Germany: They find that contrary to
these predictions, most people report honestly after flipping a coin in absolute privacy with a 50% chance
of getting a payoff of 15 euros in cash or through an Amazon gift certificate. Abeler and colleagues also
complemented their study with a laboratory experiment and find, however, that there is a slightly higher
level of dishonest reporting.
The dominant view in much of the literature is that individuals engage in dishonest behavior as
long as they can maintain a positive self-image while obtaining the maximum payoffs from their
dishonesty (Mazar, Amir and Ariely, 2008). Further, research has shown creating a justification of a
positive self-image while behaving dishonestly is quite context specific (Fosgaard, Hansen and Piovesan,
2013; Gino and Galinsky, 2012; Pascual-Ezama, Prelec and Dunfield, 2013).
As our sample includes substantial cultural variation—including participants from Anglo-Saxon,
Latin, Germanic, Nordic and Asiatic countries—one would expect substantial heterogeneity in cheating.
In addition, and consistent with a social constructionist view, the effects of culture depend on the specifics
of the choice context (Gelfand, 2013; Kramer and Messick, 1995). In this paper, we examine whether
cheating per se differs across different countries and whether the context influences this behavior.
According to Bandura, Barbaranelli, Caprara and Pastorelli (1996) verbal reports are likely to be less
prone to dishonest behavior than written reports so we hypothesize than self-reporting without interaction
increase the temptation to be dishonest. Cultural context in which honor could be important with a verbal
compromise in some countries or signing a contract in other countries would be very interesting to
analyze. We conducted a field experiment in which participants reported the outcome of a coin toss to win
a prize. We replicated the experiment in a diverse set of 16 countries around the world with 1440 subjects,
90 in each country (30/treatment). We used a simple cheating task based on Bucciol and Piovesan (2011).
We took great care to run each session under similar treatments. The location of the experiment was
always busy common areas on campuses of 16 universities. Participants had to flip a black/white coin; if
the outcome was white and reported white, they obtained a red Lindt Lindor Truffle; if it was black and
reported black , they obtained nothing.
In our first treatment (the Self-Reported Treatment, SRT) each participant flipped a coin in a
private area without the presence of the researchers or other participants. Afterwards the subject filled a
report sheet – indicating sex and the white/black result. It was clearly indicated that the filled form should
be left in the box nearby. No interaction with the experimentalists occurred.
Taking into account that there are different types of dishonest people (Gneezy, Rockenbach &
Serra-García, 2013), this task shows up pure nature of dishonesty for several reasons. Firstly, as a
growing body of research suggests that even in completely anonymous settings, where the risk of being
Shu, Mazar, Gino, Ariely and Bazerman, 2012) but people restrict the amount of cheating (Ayal and
Gino, 2011; Gneezy, 2005). In our task participants cannot measure the level or honesty (in case of black
coin), they just need to decide to be honest or not. Secondly, the task is very fast, decision making is
immediate and intuitive instead deliberative and meditative in a cognitive dual system (Bazerman and
Tenbrunsel, 2011; Kahneman, 2011). Cheating is an automatic tendency and the need for justification
matters only when people have enough time to deliberate (Shalvi, Eldar and Bereby-Meyer, 2012).
Finally, the reward is a simple chocolate that gives an instance of pleasure!
Our two other treatments were the Written and the Verbal Reported Treatments (WRT & VRT,
respectively). In WRT, participants completed a report sheet in private, but in sharp contrast to SRT they
submitted the report sheet to the experimenter. The experimenter checked the outcome, and, if due,
handed the chocolate to the participant. In VRT, participants were not asked to fill out any form. They
just verbally reported to the experimenter the outcome of the coin flip. If white, the experimentalist
handed a chocolate to them.
Our different treatments allow us to understand how the level of cheating is shaped by context.
Building on the theory of self-image maintenance (Mazar, Amir and Ariely, 2008), we predict that our
three treatments have different implications with regard to the moral processes of reporting incorrect
outcomes. Specifically, we conjecture that misreporting in the SRT is the least morally difficult decision
since reporting does not involve any kind of social interaction and, therefore, no social pressure from the
experimenter. Consequently, the decision to be dishonest is only a tradeoff between the internal moral
pressure (and the consequent guilt experienced) against the pleasure of enjoying a Lindt chocolate after
cheating.
In WRT, an additional moral pressure originates from the fact that the decision is documented on
paper and handed to another person. This additional social process is likely to involve shame (on top of
guilt) in case of dishonesty, and hence we expect less dishonesty occurring in this treatment. Finally, we
know that written reports fell more distant and make it easier to take off internal moral control than verbal
reports (Shu et al. 2012). Therefore, we expect the VRT to bring even stronger self-image erosion in case
of cheating, since the untruthful decision now must be stated face-to-face. In this situation we expect the
most moral pressure to be present and hence the least dishonest behavior.
2. Experimental design
We replicate a simple coin task by Bucciol and Piovesan (2011). As noted before, participants had
to flip a white/black coin. If the color of the coin was white they obtained a red Lindt Lindor chocolate;
Participants flipped the coin only once and one person at a time. They perform the task in a private
area without the presence of the researchers or other participants. The experiment was done in a location
within the campus, for example in hallway in the cafeteria area, with a lot of students passing. Participants
are university students1 and native from each country because there are evidences about the effect of
immigrants’ original country social norms in ethical behavior (Kountoris and Remoundou, 2013). The
experiment was carried out in the local language for both the verbal and the written part.2
The whole study comprises three different treatments according to the level of proximity between
the participant and the monitor:
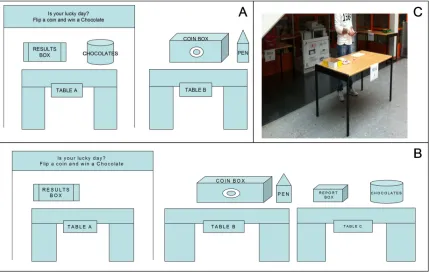
• Self-Reported Treatment (SRT): A student met the experimenter (at table A, see Figure A1 appendix for details), he/she was handed a report sheet, and was guided to table B (far
enough to the researcher area) to flip the black/white coin (see B in Figure A1). The coin
flip was carried out inside a small box to make it completely private. At table B the students
noted their gender and result of the coin flip on the report sheet. Students filled out the
report sheet and walked to a third table (table C in another private area far enough to the
researcher, see C in Figure A1) to deposit the report sheet in a box, and to take the chocolate
themselves in case of the white outcome.
• Written Reported Treatment (WRT): Exactly the same as SRT, but now with the filled out report sheet in hand, the student went back to table A, gave the report sheet to the
experimenter and received the chocolate if the white color was reported. Table C is
therefore not used (see figure A1, appendix).
• Verbal Reported Treatment (VRT): Exactly the same as WRT, but now the student flipping the coin did not have have to fill out the report sheet (just gender) and had to inform the
experimenter verbally the outcome of the coin toss.
We ran the experiment with 90 participants in each country. We made sure to run exactly 10
students for each treatment, and repeating 3 times: 10 (WRT), 10 (VRT), 10 (SRT), 10 (WRT), 10 (VRT),
10 (SRT), 10 (WRT), 10 (VRT), 10 (SRT).
We started each treatment with ten chocolates in a plate on table B (VRT and WRT) or table C
(SRT). When we changed the treatment we refilled the chocolates taken by the participants and registered
the exact number of chocolates replaced. At the beginning of each treatment we started with ten
1
Recent papers show that typical experimental subjects are not really different from ordinary people (see for instance Exadaktylos, Espin and Branas-Garza, 2013 for social dilemmas.)
2
chocolates in the plate. At the end of the experiment we compared the numbers we wrote in the paper
with the answers of the participants. In WRT and SRT participants wrote the color in the report sheet. In
the VRT participants wrote only the gender. In this case, when participants gave us the report sheet and
told us the color we tore a little piece of the report sheet when they told us black so at the end we could
know how many blacks and whites were declared.
The task could only be done once per person. There is no formal way to check for this, but since the
task was done over only a few hours it is quite easy to spot if the same face shows up for a second round.
In that case, we simply told that this was only possible to participate once. If people who are faculty staff
wanted to participate, it was emphasized that it was intended to be a student event.
3. Results
3.a. Differences by treatments
To our great surprise, only 57% reported white across all three treatments. Since the probability of
obtaining white is 50%, this result indicates that 86% resisted the temptation to lie [100% - 2(57%-50%)].
We conclude that little dishonesty is observed across all countries and treatments. Looking at the different
treatments, the degree of dishonest behavior, listed as the percentage of white outcomes, confirms our
initial conjectures. We observe a greater amount of lying the SRT, with WRT in the middle and VRT
observing the smallest amount of lying.
62% (SelfRT) > 57% (WrittenRT) >53% (VerbalRT)
The differences between SRT and WRT are not statistically significant (χ2=.316; p-value=.574), although
the average across the sixteen societies were 5 percentage points higher for former. However, the
difference between SRT and VRT was larger (9 percentage points) and significant at the 5% level
(χ2=4.479; p-value=0.034). Further, we do not find any significant differences between WRT and VRT
(χ2=2.422; p-value=0.120). Comparing different treatments, verbal reports are likely to be less prone to
dishonest behavior than written reports (Bandura, Barbaranelli, Caprara and Pastorelli, 1996; Festinger
and Carlsmith, 1959; Mazar, Amir and Ariely, 2008) but self-reported (and not delivered to the monitor)
seems to increase the effect.
3.b. Differences by countries
A second important result is that, we find no statistically significant differences across the 16
WRT (χ2 = 22.674; p-value=0.091). This suggests that there is a high level of honesty across our sample
countries.
Additional interesting results show up from a closer examination of the data. Since tossing a coin
follows a binomial distribution, we looked for those countries where there are an anomalous number of
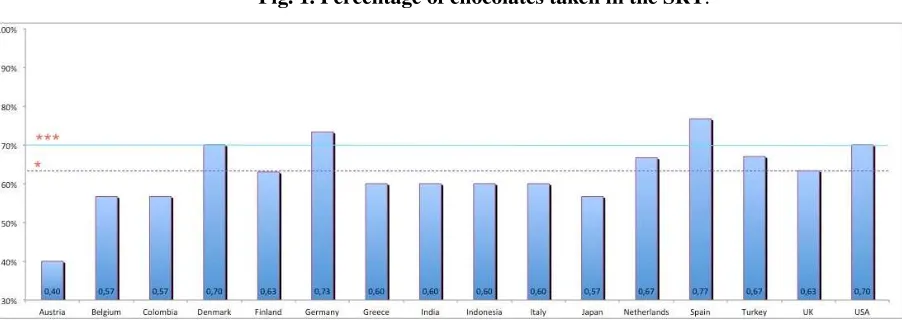
white (awarded) coins. Table 1 reports detailed information by country and treatments. Figure 1 displays
the same information graphically for SRT.
Table 1. Summary of countries studied.
Country
Self Report
(n=30 p/t)
Written Reported
(n=30 p/t)
Verbal Reported
(n=30 p/t)
Austria 40% 77% *** 60%
Belgium 57% 47% 53%
Colombia 57% 67% ** 43%
Denmark 70% ** 43% 40%
Finland 63% * 67% ** 53%
Germany 73% *** 50% 53%
Greece 60% 60% 37%
India 60% 67% ** 50%
Indonesia 60% 57% 40%
Italy 60% 47% 57%
Japan 57% 60% 57%
Netherlands 67% ** 60% 50%
Spain 77% *** 63% * 67% **
Turkey 67% ** 57% 53%
USA 70% ** 53% 63% *
UK 63% * 33% 70% **
Columns show the percentages of participants who have taken chocolates in each treatment. “p/t”
stands for per treatment. Significant differences over binomial distribution are indicated by: * means
p-value<0.10; ** means p-value<0.05; *** means p-value<0.01. p/c means “per country”.
Data arising from self-reported treatment (SRT) show that the null hypothesis of honest behavior
figure shows that UK and Finland reject the null at α=10% (dotted line labeled with *). Most importantly, Germany and Spain reject at α=1% (continuous line labeled with ***). Finally, Netherlands, Denmark, Turkey and the US reject for 1%<α<10%.
Fig. 1.Percentage of chocolates taken in the SRT.
Notes: Significant differences over binomial distribution are indicated by: * means p-value<0.10; ***
means p-value<0.01.
Figure 2 displays data from Table 1 for the written and the verbal treatments. Blue (left side) bars
in Figure 2 refer to WRT (written). The number of countries that reject the null is reduced to four and
they are not the same as in SRT: Colombia, Finland and India reject at 1%<α<10% while Austria does so at α=1%. Spain weakly rejects (α=10%).
Data from VRT (verbal) are shown in the red bars (right side) of Figure 2. Only two countries
appear significant: Spain rejects at 1%<α<10% while the UK rejects at the 1% level.
There are some interesting issues to emphasize: Spain also rejected the null in all treatments.
Unexpectedly UK appears under the verbal and the self-reported treatment but not in the written. The
latter case is exactly the complementary of Austria who appears in the written only. Also the US and
Finland appear in two treatments. It is also important to remark that Belgium, Greece, Italy, Indonesia and
Japan never appear as dishonest.3
3 It is also interesting the case of Denmark. Significant differences for SRT vs. WRT (
Fig. 2. Percentage of chocolates taken in the WRT and VRT.
Notes: Significant differences over binomial distribution are indicated by: * means p-value<0.10; ***
means p-value<0.01.
3.c. Gender differences
On an exploratory basis, we also analyzed the effect of gender (see Croson and Gneezy, 2009, for
a review). Although previous studies have found correlations between gender and cheating (e.g. Dreber
and Johannesson 2008), no statistically significant differences between the countries were found for the
male (χ2= 15.898; p-value=0.389) or for female (χ2= 10.679; p-value=0.775) participants in line with
very recent studies (Abeler, Becker and Falk, 2014). Analyzing by treatment, differences were not found
in the SRT [(χ2= 16.374; p-value=0.358) (χ2= 17.051; p-value=0.316)], nor in the WRT [(χ2= 19.872;
p-value=0.177) (χ2= 19.341; p-value=0.199)] or the VRT [(χ2= 8.581; p-value=0.898) (χ2= 12.618;
p-value=0.632)] treatments.
We can thus conclude that males and females do not behave differently in our sample. Our
mechanism therefore provides gender-free results.
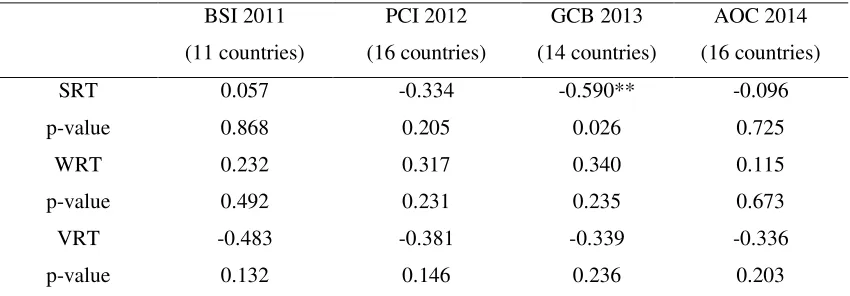
3.d. Comparison with international indexes of corruption
The analysis of our result can be complemented with a comparison of the (published) rankings of
corruption. Note that the link between cheating and corruption has been reported as strong (Magnus,
correlate with any of the following international corruption indexes from International Transparency and
WJR Rule of Law Index: i.e. the BSI 2011: Bribery Source Index (from International Trasparency); the
PCI 2012: Perception of corruption Index; the GCB 2013: Global Corruption Barometer(average of all
sectors) and AOC2014: Absence of corruption.
Table 2 summarizes all the correlations (twelve comparisons: 4 indices x 3 treatments), for the
[image:11.595.86.511.267.415.2]countries in our sample that are also represented in the indices.
Table 2. Pearson correlations of the three index with the three treatments.
BSI 2011
(11 countries)
PCI 2012
(16 countries)
GCB 2013
(14 countries)
AOC 2014
(16 countries)
SRT 0.057 -0.334 -0.590** -0.096
p-value 0.868 0.205 0.026 0.725
WRT 0.232 0.317 0.340 0.115
p-value 0.492 0.231 0.235 0.673
VRT -0.483 -0.381 -0.339 -0.336
p-value 0.132 0.146 0.236 0.203
Notes: The number between () indicates the number of countries available in our sample. Some
countries of our sample are missing in the BSI (Austria, Colombia, Denmark, Finland, Greece)
and in the GCB (Austria, Netherlands). P-value is 2-tailed and ** means p-value<0.05.
As shown in Table 2, only one correlation is statistically significant (GCB2013 vs. SRT; p<0.05).
On top of that, the sign of the correlations do not follow any common pattern: 7 negatives and 5
positives. We can safely say that international indices indicative of institutional honesty are not correlated
with our experimental data.
4. Conclusions
Although previous survey-based research suggests that cultural differences in dishonest behavior are
likely, our results do not support such differences. Importantly, ours is the first multi-country study
measuring honesty/dishonesty using an incentivized mechanism which is not relying on non-incentivized
self-reported surveys. Measuring direct behavior through an experimental and controlled method, not only
culture-specific interactions with a specific context. Similar to Abeler et.al (2014) we find that, even in
the most private of settings, most people are prone to report honestly about their behavior, regardless of a
clearly private material gain and zero pecuniary costs from lying. However, we provide evidence for a
cross-section of 16 countries while they have data only from Germany. Also as Abeler and colleagues, we
do not find that gender explains reporting. Our results do not cast doubts about the validity of these
indices. Rather, they reaffirm the likelihood that survey data and our behavioral data are measuring
different aspects of cheating and culture. That is, we look at the side of citizens and not at the supply side
of corruption in the private and public sector of the economy. It is not clear, however, how well survey
responses about cheating correspond to actual dishonest behavior (i.e., people may sometimes lie on
surveys). Survey studies suffer from empirical issues such as confounding factors and hypothetical biases
that are inherent in questionnaires (Falk and Heckman, 2009). Further, reliable data on issues such as
corruption, dishonesty, cheating, etc. are hard to come by. Current studies focus mostly on the sources of
corruption associated with a few powerful individuals in the private or public sector that have access to
votes, funds or decisions due to their positions in hierarchies. These studies have neglected the citizens’
side being the focus of our study. It is in this context that the experimental methodology is very useful.
For example, we tested ordinary citizens’ behavior, as opposed to subjective perceptions of national
institutions. Importantly, however, our data suggest that ordinary citizens are much more honest than
implied by surveys focused on national institutions. Perhaps it is the corrupting nature of these institutions
that is reflected in these survey studies, but not the corruption of the average citizen. The lack of
connection between the supply of corruption and the honesty of individual citizens also requires further
inquiry. Our results suggest that the variation in honesty across countries is not correlated with corruption
indices, opening questions about the accountability of private and public institutions and the poor
connection with the citizens’ behavior and preferences for honesty in their private decision. Our results
clearly show the need for further incentivized and controlled experiments to explore the issue of ordinary
citizens´ honesty across countries.
References
Abeler, J., A.Becker and A.Falk. 2014. “Representative evidence on lying costs”. Journal of Public
Economics, 113(2014) 96-104.
Alm, J., I. Sanchez and A. de Juan. 1995. “Economic and noneconomic factors in tax compliance”. Kyklos,
48 (1), 3-18.
Ariely, D. 2012. The Honest Truth About Dishonesty: How We Lie to Everyone - Especially Ourselves.
Ayal, S. and F. Gino. 2011. Honest rationales for dishonest behavior. M. Mikulincer & P. R. Shaver (ed).
Washington, DC: American Psychological Association.
Bandura, A., C. Barbaranelli, G.V. Caprara and C. Pastorelli. 1996. Mechanisms of moral disengagement
in the exercise of moral agency. Journal of Personality and Social Psychology, 71 (2), 364–374.
Bazerman, M.H. and A.E. Tenbrunsel. 2011. Blind Spots: Why We Fail to Do What's Right and What to Do
about It. UK, Princeton University Press.
Bucciol, A. and M. Piovesan. 2011. Luck or cheating? A field experiment on honesty with children.
Journal of Economic Psychology, 32 (1), 73-78.
Croson, R. and U. Gneezy. 2009. Gender differences in preferences. Journal of Economic Literature, 47(2),
1-27.
Cummings, R.G., J. Martinez-Vazquez, M. McKee and B. Torgler. 2009. Tax Morale Effects Tax
Compliance: Evidence From Surveys And An Artefactual Field Experiment. Journal of Economic
Behavior and Organization,70, 447-457.
Dreber, A., Johannesson, M., 2008. Gender differences in deception. Economic Letters, 99 (1),
197–199.
Exadaktylos, F., A.M. Espín and P. Brañas-Garza. 2013. Experimental subjects are not different. Scientific
Reports. DOI: 10.1038/srep01213
Falk, A. and J. Heckman. 2009. Lab Experiments Are a Major Source of Knowledge in the Social Sciences. Science, 326 (5952), 535-538.
Festinger, L. and J.M. Carlsmith. 1959. Cognitive consequences of forced compliance. Journal of Abnormal and Social Psychology, 58, 203–210.
Fosgaard, T., L.G. Hansen and M. Piovesan. 2013. Separating Will from Grace: An Experiment on
Conformity and Awareness in Cheating. Journal of Economic Behavior and Organization,93,
279-284.
Gelfand, M.J. et al. 2013. Toward a Culture-by-Context Perspective on Negotiation: Negotiation Teams in
the United States and Taiwan. Journal of Applied Psychology, 98 (3), 504-513.
Gino, F. and A.D. Galinsky. 2012. Vicarious Dishonesty: When Psychological Closeness Creates Distance
from One's Moral Compass. Organizational Behavior and Human Decision Processes,119 (1), 15-26.
Gneezy, U. 2005. Deception: The role of consequences. American Economic Review,95 (1), 384-394.
Gneezy, U., B. Rockenbach and M. Serra-García. 2013. Measuring lying aversion. Journal of Economic
Behavior & Organization, 93, 293-300.
Kahneman, D. 2011. Thinking: Fast and Slow. Farrar Straus and Giroux, New York.
Kountouris, Y. and K. Remoundou. 2013. Is there a cultural component in tax moral? Evidence from
immigrants in Europe. Journal of Economic Behavior and Organization, 96,104-119.
Magnus, J.R., V.M. Polterovich, D.L. Danilov and A.V. Savvateev. 2002. Tolerance to cheating: an
analysis across cultures. The Journal of Economic Education, 33, 125-135.
Mazar, N., O. Amir and D. Ariely. 2008. The Dishonesty of Honest People: A Theory of Self-Concept
Maintenance. Journal of Marketing Research, 45 (6), 633-644.
Pascual-Ezama, D., D. Prelec and D. Dunfield. Motivation, Money, Prestige and Cheats. Journal of
Economic Behavior and Organization, 93, 367-373.
Rawwas, M.Y.A., J.A. Al-Khatib and S.J. Vitell. 2004. Academic dishonesty: A cross-cultural comparison
of U.S. and Chinese marketing students. Journal of Marketing Education, 26, 89-100.
Shalvi, S., O. Eldar and Y. Bereby-Meyer. 2012. Honesty requires time (and lack of justifications).
Psychological Science, 23, 1264–1270. doi: 10.1177/0956797612443835
Shu, L., N. Mazar, F. Gino, D. Ariely and M.H. Bazerman. 2012. Signing at the beginning makes ethics
salient and decreases dishonest self-reports in comparison to signing at the end. PNAS,109 (38),
Appendix: Details on experimental design
We used a poster with the following text:
“Is this your lucky day? Flip a coin and win a Chocolate”.
When the participants arrived, the researchers gave a report sheet to them with different text (depending
on the treatment). Every participant in the three different treatments marked the gender in the report sheet
(that was important because in the SRT treatment researchers cannot recorder the gender). Instructions
were the following:
• Non Reported Treatment: “If you want to win a chocolate, go to table B and flip a coin inside the box. Then mark on the paper the color you had, black or white, and your gender. Go to the table
C, and deposit the paper in the box. If you mark white you can take a chocolate, if you mark
black you just leave”.
• Written Reported Treatment: “If you want to win a chocolate, go to table B and flip a coin inside the box. Then mark on the paper the color you had, black or white, and your gender. Come back
and give us the paper. If you mark white we will give you a chocolate, if you mark black,
nothing”
• Verbal Reported Treatment: “If you want to win a chocolate, go to table B and flip a coin inside the box. Then mark on the paper your gender, come back, and tell us the color you had. If it was
Figure A1. Procedure and tables’ distribution.Block A: WRT and VRT tables’ distribution. We used
a table (Table A) with a Poster (where the researchers were) in a visible situation for students (for
example in hallway in the cafeteria area). With a couple of meters of distance in another table (Table B)
there was a box with a black/white coin inside where the participants flipped the coin (inside the box)
without nobody could see them. Block B: SRT tables’ distribution. In SRT there was another table (Table
C) with was a small box where the participants gave the report sheet and took the chocolates. Block C:
Picture example in Spain. Although the experiment rules are written in the reports the researchers provide
to the participants at the beginning of the task, all researchers are native in order to avoid