Comparison of School Building Construction Costs
Estimation Methods Using Regression Analysis, Neural
Network, and Support Vector Machine
Gwang-Hee Kim1, Jae-Min Shin2, Sangyong Kim3, Yoonseok Shin1*
1Department of Plant & Architectural Engineering, Kyonggi University, Suwon-Si, Korea; 2Department of Architectural Engineering,
Graduate School of Kyonggi University, Suwon-Si, Korea; 3School of Construction Management and Engineering, University of
Reading, Reading, UK.
*Corresponding author: [email protected]
Received February 16th, 2013; revised March 17th, 2013; accepted March 24th, 2013
ABSTRACT
Accurate cost estimation at the early stage of a construction project is key factor in a project’s success. But it is difficult to quickly and accurately estimate construction costs at the planning stage, when drawings, documentation and the like are still incomplete. As such, various techniques have been applied to accurately estimate construction costs at an early stage, when project information is limited. While the various techniques have their pros and cons, there has been little effort made to determine the best technique in terms of cost estimating performance. The objective of this research is to compare the accuracy of three estimating techniques (regression analysis (RA), neural network (NN), and support vector machine techniques (SVM)) by performing estimations of construction costs. By comparing the accuracy of these tech- niques using historical cost data, it was found that NN model showed more accurate estimation results than the RA and SVM models. Consequently, it is determined that NN model is most suitable for estimating the cost of school building projects.
Keywords: Estimating Construction Costs; Regression Analysis; Neural Network; Support Vector Machine
1. Introduction
In school building construction projects, budgeting, plan-ning, and monitoring for compliance with the client’s available budget, time, and work outstanding are also important [1]. And the accuracy of construction costs estimation is a key factor in the success of a construction project, and also affects the decision-making by the own-ers [2-4]. But it is difficult to quickly and accurately es-timate the construction costs at the planning stage, be-cause the drawings and documentation are generally in-complete [5]. For this reason, various techniques have been developed to accurately estimate construction costs with the limited project information available in the early stage.
Typical cost estimating techniques are neural networks (NN), support vector machine (SVM), case-based rea- soning (CBR), and regression analysis (RA), etc. [6]. For example, the RA model [7-9], NN model [10-13], SVM Model [6,14-16], and CBR model [1,17,18] have been developed for predicting or estimating construction costs. Approaches to cost estimation based on statistics and linear regression analysis have been developed since the 1970s [2]. Since the late 1980s, artificial intelligence
approaches such as expert system, NN, and CBR have been applied [19]. In addition, the cost predicting model has been studied since the 2000s.
Previous studies [2,12,20-22] revealed that an NN model for cost estimating is superior to the RA model. Also, the accuracy of cost estimation based on the SVM technique is similar to that of cost estimation based on RA [23]. Consequently, it is necessary to compare RA, NN, and SVM to determine the optimum approach to estimating construction costs.
Therefore, in this research, the accuracy of three esti- mating techniques (i.e. regression analysis, neural net- work, and support vector machine techniques) is com- pared by performing an estimation of construction costs using historical cost data, so that a cost estimation model adapting two techniques (i.e. neural network and support vector machine) could be examined through regression analysis.
2. Three Costs Estimating Techniques
2.1. Regression Analysis
using regression analysis have several disadvantages: 1) they have no specific, or clearly defined, approach that will help estimators choose the cost model that best fits the historical data to a given cost estimating application [12,20,24,25]; 2) a certain type of multiple equation and its data are assumed to be similar to be suitable for the regression equation [12,24,25]; 3) the variable influenc- ing the estimation must be reviewed in advance, and it is also difficult to use a large number of input variables [24-26]. However, regression analysis, as it is usually called, is a very powerful statistical tool that can be used as both an analytical and predictive technique in examin- ing the contribution of potential new items to the over- all estimate reliability [27]. Regression analysis (RA) can be generally represented the form of Equation (1).
1 1 2 2 n n
Y C A X A X A X (1) where Y is the total estimated costs, and X1, X2,…Xn are measures of distinguishable variables that may help in estimating Y, C is the estimated constant, and A1, A2, …,
An are coefficients estimated by regression analysis,
given the availability of some relevant data. The Statisti- cal Package for Social Science (SPSS) stepwise tech- niques were used to develop the regression model.
2.2. Neural Network
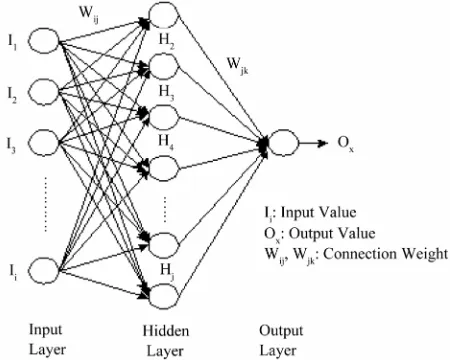
A neural network (NN) is a computer system that simu- lates the learning process of the human brain [2] based on a simplified model of the biological neurons in the human brain and the relations between them. A neural network is modeled in a mathematical manner to imple-ment an intelligent form as shown in the human brain, for utilization in engineering or in other fields [3]. The
structure of an NN is as shown in Figure 1. Basically,
the network consists of several layers, including an input layer, a hidden layer, and an output layer, and each layer contains neurons. Neurons determine the optimum value through a summation and transfer function. The set of inputs, which is the outputs from another neuron in input layers, are delivered by neurons. Each input data is mul- tiplied by the connection weight, and then the weighted inputs provide output value, which is modified by the transfer function.
[image:2.595.312.537.96.276.2]Some researchers have explored the application of NN to improve the accuracy of cost estimation beyond that of the regression model [10-12,20,24,25,28,29]. Although many previous studies have proved that the neural net- work cost estimating model is superior to the regression analysis estimation model, many have also demonstrated not only the superiority of NN but the problems associ- ated with using them for cost estimation [4]. However, the main advantages of an NN are as follows: 1) they can be used to construct high-level nonlinear function esti-
Figure 1. Neural network structure.
mation models; and 2) their use does not impose any limit on the number of features [30]. The main disad- vantage of the NN mentioned in the previous research is that the black box techniques and knowledge acquisition process are very time-consuming [11,28,29,31].
2.3. Support Vector Machine
Support vector machine (SVM) is a learning theory de- veloped by Vapnik [32] that has two main categories, support vector classification (SVC) and support vector regression (SVR). In particular, in the model constructed using SVR, the goal is to find a function f(x) that has at most ε deviation from the actually obtained target value (yi) for all the training data, and is simultaneously as flat as possible [33]. The structure of SVR is as shown in Figure 2. The input pattern (support vectors) is mapped
into feature space by a map Φ. Then, dot products are
computed with the images of the training patterns under
the map Φ. This matches up to the evaluating kernel
function k x x
i,
v. The dot products are aggregated us- ing the weights i i i. Last, the final prediction
Figure 2. Support vector regression structure.
complexity and require extensive memory [37].
3. Application
3.1. Data for Estimating Construction Costs
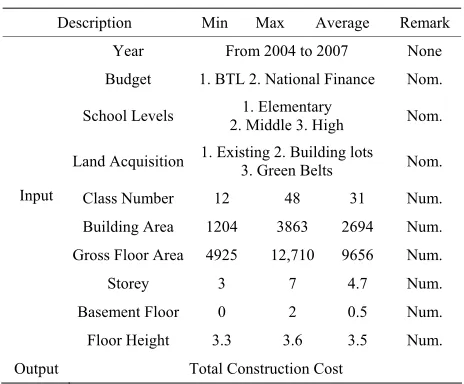
The collected data used in this application were the ac- tual construction costs of 217 school building projects executed by general contractors from 2004 to 2007 in Kyeonggi Province, Korea. These cost data were the di- rect costs of school buildings, such as elementary, middle, and high schools, without mark-up. As shown in Table 1, 10 input and 1 output variables were extracted from the collected data. Notably, the construction year was not used as an input variable because the extracted variables from cost data were converted using the Korean building cost index (BCI), i.e. the collected cost data were multi- plied by the BCI of the base year 2005 (BCI = 1.00). The collected cost data of 217 school buildings were divided randomly into 20 test data, 67 cross-validation data, and 130 training data.
3.2. Accuracy Evaluation
Generally, the performance of a cost estimating model is determined by measuring its bias, consistency, and ac- curacy. Measures of bias, consistency, and accuracy are concerned with the difference in the average between the actual costs and the estimated costs, considering both the degree of variation around the average, and the combi- nation with bias and consistency [2]. By far, the most popular evaluation criteria used involves statistics such as mean, standard deviation, and coefficient of variation [38]. In this research, each model’s performance was measured by the Mean Absolute Error Rates (MAERs), which was calculated by Equation (2).
100 MAERs
e a
a
C C
C n
(2)
where Ce is the estimated construction costs by model
[image:3.595.307.539.108.300.2]application, Ca is the collected actual construction costs,
Table 1. Input and output variables.
Description Min Max Average Remark Year From 2004 to 2007 None Budget 1. BTL 2. National Finance Nom.
School Levels 2. Middle 3. High 1. Elementary Nom.
Land Acquisition 1. Existing 2. Building lots3. Green Belts Nom.
Class Number 12 48 31 Num. Building Area 1204 3863 2694 Num. Gross Floor Area 4925 12,710 9656 Num.
Storey 3 7 4.7 Num.
Basement Floor 0 2 0.5 Num. Input
Floor Height 3.3 3.6 3.5 Num.
Output Total Construction Cost
and n is the number of test data.
3.3. Results of Evaluation
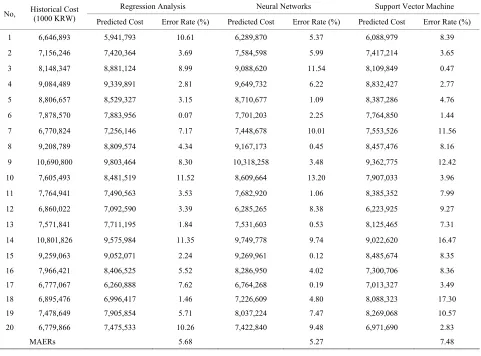
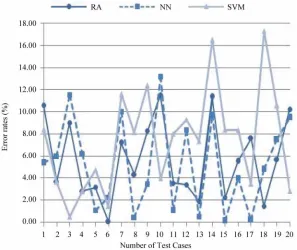
The results from the 20 test data using RA, NN and SVM are summarized in Tables 2 and 3. The results from the RA model had MAERs of 5.68 with 20% of the estimates within 2.5% of the actual error rate, while 80% were within 10%. The NN model had MAERs of 5.27 with 35% of the estimates within 2.5% of the actual error rate, while 85% were within 10%. Last, SVM model had MAERs of 7.48 with 10% of the estimates within 2.5% of the actual error rate, while 75% were within 10%. Also, the standard deviation of the RA, NN, and SVM model are 3.56, 4.13, and 4.66 respectively, as shown in Table 4 and Figure 3.
4. Discussion of Results
This study was conducted by using 217 cases of school building construction projects. Of the cases, 20 cases were used for the testing. The regression model, neural networks model, and support vector machine model with 20 test data gave MAERs of 5.68, 5.27 and 7.48, respec- tively. Also, the NN model and the RA model had smaller error rates and deviation than that of SVM model. Through the performance, the NN model was the most accurate and reliable of the three models.
Table 2. Summarized results by estimating model.
RA NN SVM Error rate (%)
Fre. (%) Cum. (%) Fre. (%) Cum. (%) Fre. (%) Cum. (%)
0.0 - 2.5 4 (20) 4 (20) 7 (35) 7 (35) 2 (10) 2 (10)
2.5 - 5.0 6 (30) 10 (50) 3 (15) 10 (50) 6 (30) 8 (40)
5.0 - 7.5 3 (15) 13 (65) 4 (20) 14 (70) 1 (5) 9 (45)
7.5 - 10.0 3 (15) 16 (80) 3 (15) 17 (85) 6 (30) 15 (75)
10.0 - 12.5 4 (20) 20 (100) 2 (10) 19 (95) 3 (15) 18 (90)
12.5 - 15.0 0 (0) 20 (100) 1 (5) 20 (100) 0 (0) 18 (90)
15.0 - 17.5 0 (0) 20 (100) 0 (0) 20 (100) 2 (10) 20 (100)
[image:4.595.59.540.285.641.2]MAERs 5.68 - 5.27 - 7.48 -
Table 3. Results of estimating costs of each test set.
Regression Analysis Neural Networks Support Vector Machine No, Historical Cost (1000 KRW)
Predicted Cost Error Rate (%) Predicted Cost Error Rate (%) Predicted Cost Error Rate (%)
1 6,646,893 5,941,793 10.61 6,289,870 5.37 6,088,979 8.39
2 7,156,246 7,420,364 3.69 7,584,598 5.99 7,417,214 3.65
3 8,148,347 8,881,124 8.99 9,088,620 11.54 8,109,849 0.47
4 9,084,489 9,339,891 2.81 9,649,732 6.22 8,832,427 2.77
5 8,806,657 8,529,327 3.15 8,710,677 1.09 8,387,286 4.76
6 7,878,570 7,883,956 0.07 7,701,203 2.25 7,764,850 1.44
7 6,770,824 7,256,146 7.17 7,448,678 10.01 7,553,526 11.56
8 9,208,789 8,809,574 4.34 9,167,173 0.45 8,457,476 8.16
9 10,690,800 9,803,464 8.30 10,318,258 3.48 9,362,775 12.42
10 7,605,493 8,481,519 11.52 8,609,664 13.20 7,907,033 3.96
11 7,764,941 7,490,563 3.53 7,682,920 1.06 8,385,352 7.99
12 6,860,022 7,092,590 3.39 6,285,265 8.38 6,223,925 9.27
13 7,571,841 7,711,195 1.84 7,531,603 0.53 8,125,465 7.31
14 10,801,826 9,575,984 11.35 9,749,778 9.74 9,022,620 16.47
15 9,259,063 9,052,071 2.24 9,269,961 0.12 8,485,674 8.35
16 7,966,421 8,406,525 5.52 8,286,950 4.02 7,300,706 8.36
17 6,777,067 6,260,888 7.62 6,764,268 0.19 7,013,327 3.49
18 6,895,476 6,996,417 1.46 7,226,609 4.80 8,088,323 17.30
19 7,478,649 7,905,854 5.71 8,037,224 7.47 8,269,068 10.57
20 6,779,866 7,475,533 10.26 7,422,840 9.48 6,971,690 2.83
MAERs 5.68 5.27 7.48
Table 4. Descriptive analysis of estimating error rate.
95% confidence interval of the mean
Mean Std, deviation Std, error
Lower Upper
RA 5.6785 3.56508 .79718 4.0100 7.3470
NN 5.2695 4.13996 .92572 3.3319 7.2071
[image:4.595.55.539.662.734.2]Figure 3. Comparison of the results of each model.
the MAERs of the three results were statistically differ- ent. Therefore, the NN model performed more effectively than the other two results in estimating construction costs.
5. Conclusions
This study applied the three techniques of RA, NN, and SVM to estimate the construction cost of school building projects. 197 cases were used for model development and validation, while the remaining 20 cases were used for testing the model. All three models produced a high cor- relation between the estimating costs and the actual costs.
Although RA, NN, and SVM worked well for the ap- plication, NN model gave more accurate estimation re- sults than the RA and SVM models. As mentioned in the previous research, NN has proven to be useful and suit-able for dealing with complex problems and developing user-friendly predictive models. They are able to detect any patterns found in the data and provide a greater op-portunity to investigate different options and project con-trol techniques. Also, in this study, the NN estimating model is more suitable for estimating school building projects than the SVM estimating model.
REFERENCES
[1] G.-H. Kim, J.-E. Yoon, S.-H. An, H-H. Cho and K.-I. Kang, “Neural Network Model Incorporating a Genetic Algorithm in Estimating Construction Costs,” Building and Environment, Vol. 39, No. 11, 2004, pp. 1333-1340.
doi:10.1016/j.buildenv.2004.03.009
[2] G.-H. Kim and S.-H. An, “A Study on the Correlation between Selection Methods of Input Variables and Num- ber of Data in Estimating Accuracy; Cost Estimating Us- ing Neural Networks in Apartment Housing Projects,” Journal of the Architectural Institute of Korea, Vol. 23, No. 4, 2007, pp. 129-137.
[3] G.-H. Kim, S.-H. An and K.-I. Kang, “Comparison of Construction Cost Estimating Models Based on Regres- sion Analysis, Neural Networks, and Case-Based Rea- soning,” Building and Environment, Vol. 39, No. 10, 2004, pp. 1235-1242. doi:10.1016/j.buildenv.2004.02.013 [4] H.-G. Cho, K.-G. Kim, J.-Y. Kim and G.-H. Kim, “A
Comparison of Construction Cost Estimation Using Mul- tiple Regression Analysis and Neural Network in Ele- mentary School Project,” Journal of the Korea Institute of Building Construction, Vol. 13, No. 1, 2013, pp. 66-74. doi:10.5345/JKIBC.2013.13.1.066
[5] S.-H. An and K.-I. Kang, “A Study on Predicting Con- struction Cost of Apartment Housing Using Experts’ Knowledge at the Early Stage of Projects,” Journal of the Architectural Institute of Korea, Vol. 21, No. 6, 2005, pp. 81-88.
[6] U.-Y. Park and G.-H. Kim, “A Study on Predicting Con- struction Cost of Apartment Housing Projects Based on Support Vector Regression at the Early Project Stage,” Journal of the Architectural Institute of Korea, Vol. 23, No. 4, 2007, pp. 165-172.
Model for the Domestic Apartment House,” Ph.D. Thesis, Seoul National University, Seoul, 1991.
[9] I.-S. Choi, S.-H. Hong, C.-B. Son and S.-C. Ko, “A Study on the Prediction Model of Construction Cost in High- Rise Office Building of SRC Type,” Journal of the Ar- chitectural Institute of Korea, Vol. 15, No. 7, 1999, pp. 143-151.
[10] R. Mckim, “Neural Network Application to Cost Engi- neering,” Cost Engineering, Vol. 35, No. 7, 1993, pp. 31- 35.
[11] I.-C. Yeh, “Quantity Estimating of Building with Loga- rithm-Neuron Networks,” Journal of Construction Engi- neering and Management, Vol. 124, No. 5, 1998, pp. 374-380.
doi:10.1061/(ASCE)0733-9364(1998)124:5(374)
[12] J. Bode, “Neural Networks for Cost Estimating: Simula- tion and Pilot Application,” International Journal of Pro- duction Research, Vol. 38, No. 6, 2000, pp. 123-154. doi:10.1080/002075400188825
[13] S.-K. Kim and I.-W. Koo, “A Neural Network Cost Model for Office Buildings,” Journal of the Architectural Institute of Korea, Vol. 16, No. 9, 2000, pp. 59-67. [14] X. Wu and L. Cai, “Application of RS-SVM in Construc-
tion Project Cost Forecasting,” Proceedings of the 4th In- ternational Conference on Wireless Communication, Net- working and Mobile Computing, Dalian, 12-14 October 2008, pp. 1-4.
[15] M.-Y. Cheng and Y.-W. Wu, “Construction Conceptual Cost Estimates Using Support Vector Machine,” Pro- ceedings of the 22nd International Symposium on Auto- mation and Robotics in Construction ISARC 2005, Fer- rara, 11-14 September 2005, pp. 1-5.
[16] S.-H. An, K.-I. Kang, M.-Y. Cho and H.-H. Cho, “Appli- cation of Support Vector Machines in Assessing Concep- tual Cost Estimates,” Journal of Computing in Civil En- gineering, Vol. 21, No. 4, 2007, pp. 259-264.
doi:10.1061/(ASCE)0887-3801(2007)21:4(259)
[17] W. Yunna, “Application of a Case-Based Reasoning Method in Estimating the Power Grid Project Cost,” Proceedings of the 4th International Conference on Wire- less Communication, Networking and Mobile Computing, Dalian, 12-14 October 2008, pp. 1-5.
[18] S.-H. Ji, M. Park and H.-S. Lee, “Case Adaptation Method of Case-Based Reasoning for Construction Cost Estimation in Korea,” Journal of Construction Engineer- ing and Management, Vol. 138, No. 1, 2007, pp. 43-52. doi:10.1061/(ASCE)CO.1943-7862.0000409
[19] S.-H. An, G.-H. Kim and K.-I. Kang, “A Case-Based Rea- soning Cost Estimating Model Using Experience by Analytic Hierarchy Process,” Building and Environment, Vol. 42, No. 7, 2007, pp. 2573-2579.
doi:10.1016/j.buildenv.2006.06.007
[20] J. Garza and K. Rouhana, “Neural Network versus Pa- rameter-Based Application,” Cost Engineering, Vol. 37, No. 2, 1995, pp. 14-18.
[21] W.-Y. Park, J.-H. Cha and K.-I. Kang, “A Neural Net- work Cost Model for Apartment Housing Projects in the
Initial Stage,” Journal of the Architectural Institute of Korea, Vol. 18, No. 7, 2002, pp. 155-162.
[22] G.-H. Kim, S.-H. An and H.-K. Cho, “Comparison of the Accuracy between Cost Prediction Models Based on Neural Network and Genetic Algorithm: Focused on Apartment Housing Project Cost,” Journal of the Archi- tectural Institute of Korea, Vol. 23, No. 3, 2006, pp. 111-118.
[23] J.-M. Shin and G.-H. Kim, “A Study on Predicting Con- struction Cost of Educational Building Project at Early Stage Using Support Vector Machine Technique,” Jour- nal of Korean Institute of Educational Environment, Vol. 11, No. 3, 2012, pp. 46-54.
[24] H. Adeli and M. Wu, “Regularization Neural Network for Construction Cost Estimation,” Journal of Construction Engineering and Management, Vol. 124, No. 1, 1998, pp. 18-24. doi:10.1061/(ASCE)0733-9364(1998)124:1(18) [25] J. Bode, “Neural Networks for Cost Estimation,” Cost
Engineering, Vol. 40, No. 1, 1998, pp. 25-30.
[26] A. E. Smith and A. K. Mason, “Cost Estimating Predic- tive Modeling: Regression versus Neural Network,” En-gineering Economist, Vol. 42, No. 2, 1997, pp. 137-161. doi:10.1080/00137919708903174
[27] R. M. Skitmore and B. R. T. Patchell, “Development in Contract Price Forecasting and Bidding Techniques,” In: M. Skitmore and V. Marston, Eds., Cost Modelling, E& FN Spon, London, 1990, pp. 53-84.
[28] R. Creese and L. Li, “Cost Estimation of Timber Bridge Using Neural Networks,” Cost Engineering, Vol. 37, No. 5, 1995, pp. 17-22.
[29] H. Li, “Neural Networks for Construction Cost Estima- tion,” Building Research and Information, Vol. 23, No. 5, 1995, pp. 279-284. doi:10.1080/09613219508727476 [30] S. Deng and T.-H. Yeh, “Applying Least Squares Support
Vector Machines to the Airframe Wing-Box Structural Design Cost Estimation,” Expert Systems with Applica- tions, Vol. 37, No. 12, 2010, pp. 8417-8423.
doi:10.1016/j.eswa.2010.05.038
[31] T. Hegazy, P. Fazio and O. Moselhi, “Developing Practi- cal Neural Network Application Using Back-Propaga- tion,” Computer-Aided Civil and Infrastructure Engi- neering, Vol. 9, No. 2, 1994, pp. 145-159.
doi:10.1111/j.1467-8667.1994.tb00369.x
[32] V. N. Vapnik, “The Nature of Statistical Learning Theory,” Springer, London, 1999.
[33] A. J. Smola and B. Schölkopf, “A Tutorial on Support Vector Regression,” Statistics and Computing, Vol. 14, No. 3, 2004, pp. 199-222.
doi:10.1023/B:STCO.0000035301.49549.88
[34] C. J. C. Burges, “A Tutorial on Support Vector Machines for Pattern Recognition,” Data Mining and Knowledge Discovery, Vol. 2, No. 2, 1998, pp. 121-167.
doi:10.1023/A:1009715923555
619-629. doi:10.1016/j.autcon.2010.02.008
[36] Y. Shin, D.-W. Kim, J.-Y. Kim, K.-I. Kang, M.-Y. Cho and H.-H. Cho, “Application of Adaboost to the Retain- ing Wall Method Selection in Construction,” Journal of Computing in Civil Engineering, Vol. 23, No. 3, 2009, pp. 188-192. doi:10.1061/(ASCE)CP.1943-5487.0000001 [37] P. R. Kumar and V. Ravi, “Bankruptcy Prediction in
Banks and Firms via Statistical and Intelligent Tech- niques—A Review,” European Journal of Operational Research, Vol. 180, No. 1, 2007, pp. 1-28.
doi:10.1016/j.ejor.2006.08.043