Munich Personal RePEc Archive
Intergenerational Cooperation: an
Experimental Study on Beliefs
Kulesz, Micaela M. and Dittrich, Dennis A. V.
April 2014
Online at
https://mpra.ub.uni-muenchen.de/58584/
Intergenerational Cooperation: an Experimental
Study on Beliefs
Micaela M. Kulesz and Dennis A.V. Dittrich
Abstract
We report on an experiment in which subjects older than 55 years old and subjects younger than 26 years old play repeatedly 4 versions of the centipede game. For each game we define four treatments that allow us to study cooperation and belief formation of these two age groups. We find that beliefs about the others’ age group shape the outcome: while seniors are cooperative and generous with juniors when they incur lower opportunity costs, for juniors it is when playing with seniors that they learn the way to the theoretical solution by smoothly decreasing their cooperation levels.
Key Words: Centipede Game, Age differences, Decision Making, Beliefs, Social Preferences.
In this paper, we report on a series of experiments which study intergener-ational cooperation through the implementation of centipede games in the lab, by inviting participants of both an older and a younger cohort.
Only few papers within the field of experimental and behavioral economics incorporate younger and adult age groups in their investigations (Kovalchik
et al., 2005; Holm and Nystedt, 2005; Sutter, 2007; G¨uth et al., 2007;
Char-ness and Villeval, 2009). However, only Holm and Nystedt (2005), G¨uth et al.
(2007) and Charness and Villeval (2009) studied teams composed of different
age groups. Holm and Nystedt (2005) run a trust game using two Swedish co-horts –one of 20 years old and the other one of 70 years old– and found that the younger cohort sent significantly higher amounts than the older cohort, and that first movers were more trustful with members of their own age cohort.
G¨uth et al. (2007) run a large scale newspaper experiment where 5,132
read-ers of the German weekly, Die Zeit, participated in a three-pread-erson bargaining game and found that ”proposing an equitable distribution gets more important and frequent with increasing age”. Last, Charness and Villeval (2009) run their studies within the context of the labor market. Their results show two interest-ing findinterest-ings from a public good experiment. First, the contribution of seniors is higher than of juniors in nearly all periods; second, heterogeneous teams are more cooperative than homogeneous teams.
trust, trustworthiness and cooperation among younger and older cohorts, and
these differences become more or less salient depending on the age group of
their matching team. Nevertheless, not much has been said on the repeated interaction among these cohorts. Understanding this is important because
in-tergenerational conflicts may arise when interests of different age groups do not
converge, for instance when it comes to evaluate the expected outcome of
ne-gotiations dealing with different national budget allocations (eg. pension fund
policies, increasing taxes,...).
The reasons for choosing the centipede game for our studies relies on the following: First, it involves repeated interactions in a context where incentives to repeatedly reciprocate lead to increasing payoffs, unless one of the players
defect, in which case he keeps more of the payoff than his matching partner.
Second, it comprises a set of sequential interactions such that at each infor-mation node each player acts how he thinks best given his beliefs about the opponent. Third, following McKelvey and Palfrey (1992, p. 803) ”we have cho-sen an environment in which we expect the Nash equilibrium to perform at its
worst” to see the way different age groups deviate from rational predictions,
and thus allows us to study the extent to which beliefs about the other
genera-tion’s rationality and other regarding preferences affect the outcome of the game.
Our main finding is that for both age groups, belief formation about the age group of the opponent shapes the outcome as follows:
1. For both age groups, tˆatonnement -or experimentation- mainly occurs when playing against subjects belonging to the same age group.
2. Juniors give their opponents the same chances to cooperate, regardless on whether they belong to the same or to a different age group.
3. Seniors prefer cooperating with seniors more than with juniors.
4. For seniors, reciprocity is payoffdriven and occurs for lower opportunity
costs.
The reminder of our paper is as follows. Section 2 explains the centipede game, and explicits our hypotheses. Section 3 discusses the experimental design, including the subject pool and the experimental procedures. Section 4 presents and discusses the results. Finally, Section 5 concludes.
1
The Centipede Game and Hypothesis
1.1
Centipede Game
players alternate in deciding whether to continue the game or to stop it. At
every decision node the payoff distribution favors the player that has the
op-portunity to choose whether stopping or continuing the game; i.e. the mover. If the mover decides to stop, then the players receive the proposed distribution at that period. If instead of stopping the mover chooses to continue, the sum of
the payoffs increases, and the distribution switches in favor of the other player:
the mover is fined and the other player is rewarded. The game can continue
until a terminal node. Even though the game offers the chance to the players
to eventually increase their payoff, the game theoretical –or rational– solution
predicts that the first mover should stop at the very first opportunity.
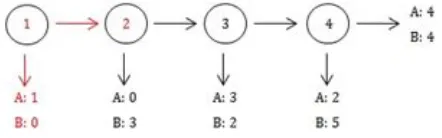
[image:4.595.186.407.320.389.2]We illustrate the intuition behind the Backward Induction solution using Figure 1.
Figure 1: Centipede Game: Example
The sequence starts with two players –A and B– in node 1, and goes from
left to right. The first row of the payoffs corresponds to player A, the second
to player B. Let’s assume the game reached node 4, where player B makes the last move of the game: he has to decide whether to stop or to continue. The
payoff maximizing choice will be to stop, otherwise he would be choosing to
have less instead of more (4 instead of 5). At the previous node, node 3, player A must choose between stopping the game and keep 3, or continuing to node 4 where he knows the rational choice would be for player B to stop and then
he will have a payoff of 2. Both players face the same trade off in each node.
Given that, the first mover –player A– will choose to stop the game at his very
first opportunity even if it is clear that both players would be better offif they
choose to continue. Stopping at the first opportunity results in the optimum choice for a rational mover, which in words of Colman (2003, p. 149), ”is an almost intolerably counterintuitive conclusion”.
the majority of the games stop in the middle nodes. Later on, Fey et al. (1996) ran several 6 and 10 nodes’ constant-sum centipede games to test for backward
induction. In those games the sum of the payoffs are the same at every node, but
the distribution changes along the game from equal to unequal in favor of one and the other player in turns. They found that the 10 nodes’ centipede game exhibits higher number of rational outcomes, but these are still far from being the theoretical expected 100% of stops at the first node: on average, 52% of the games continue after the first node. The highest percentage of stops at the first node was found by Palacios-Huerta and Volij (2009). The authors run their experiments using subjects that are very much used to the backward induction argument –professional chess players– to find that nearly 70% of the games are solved through backward induction and that 100% of the Chess Grand Masters stop the game at their first opportunity. More interesting, their study consid-ers 4 treatments, each of them combining students and chess playconsid-ers, and the stopping rates vary substantially among them. Finally, using chess players as well, Levitt et al. (2011) show results at odds with Palacios-Huerta and Volij (2009), since only 3.9% of the games stop in the first node. Moreover, they ran a race game to prove that stopping at the first node is not even related to an ”inability to reason backwards” (Palacios-Huerta and Volij, 2009, 3).
Experimental evidence reveals the clear conflict between the theoretical pre-diction, and what seems to be an intuitive behavior: why do players deviate from the rational solution? One wave of research suggests that a player devi-ates from the rational choice when he believes there is a small probability that his matching partner will also deviate (Kreps et al., 1982; Petit and Sudgen, 1989; McKelvey and Palfrey, 1992). These beliefs would influence him to devi-ate in order to build a reputation of cooperation that would convince the partner to cooperate as well, thus reaching further nodes. A second wave of studies em-phasizes on the role of other regarding preferences, such as fairness concerns and altruism, to explain what seems to be so far understood as an irrational behavior (Rabin, 1993; Fehr and Schmidt, 1999; Dufwenberg and Kirchsteiger, 2004). A third wave of research suggests that also the ability to reason following backward induction (Levitt et al., 2011) may prevent subjects to behave ”ratio-nally”. All waves of literature would be contesting backward induction as the unique valid argument to predict and explain behavior in strategic situations.
Particularly when it comes to analyze the centipede game, it seems backward induction performing specially poorly would be related to its two assumptions behind: expected utility maximization and common knowledge. The first as-sumption conforms to the standard economic ones’. The second asas-sumption implies that all the players know that all the players know that all the players
are rational1
(or irrational). When going backwards starting from the last node, backward induction makes sense. What would happen if we go forward from the first node? Do we arrive to the same conclusion about backward induction being the only rational choice? If player A stops the game at the first node,
1
that implies his expected utility of stopping exceeds his expected utility of con-tinuing. If we look at the game, that is indeed not the case: the utility derived from the last nodes is higher than the one from the first nodes (if he reaches these nodes). Would it be irrational that player A moves toward trying to get to the last node? We do not think so. Following the first wave of literature,
if his beliefs about player B include a small but sufficiently large chance that
player B responds cooperatively and continues the game to the last node, player A will continue the game at the first node. Turning to player B, in case player A continues the game at the first node, he could believe that player A is an irrational player or that player A is asking for cooperation. What should player B do then? According to Aumann (1992), a rational player stops the game regardless how he got to the point of deciding.
Even though Aumann insists that backward induction holds still, it is yet not clear how player A decides: if he considers there is a chance that player B will continue the game, it is intuitively clear that there is no certain fact in which player A could in a first pass assess the expected outcome of stopping or continuing. It seems the game theoretical solution would only make sense if both players are 100% convinced about each other’s rationality, and that this rationality is the one that dictates to stop at the first chance.
In summary, players stopping at their first opportunity seems logical, but ”intuitively implausible” (Petit and Sudgen, 1989, p. 171): that is the backward induction paradox.
Given that backward induction is the game theoretical solution, but the ”let’s cooperate” is the practical one, we can suspect that many other pieces of the game theoretical puzzle could be misleading. Following Petit and Sudgen (1989), one player may believe that his opponent is rational, ”but that does not entitle him to believe that [same thing] in subsequent rounds”. If beliefs about the other change given my actions and given the others’ actions in such a short period of time as the duration of a centipede game, when it comes to study individual decision making, we could think that it does not stay constant throughout our lives (Kovalchik et al., 2005; Holm and Nystedt, 2005; Sutter, 2007).
As long as there is one known final period with known payoffs, backward
1.2
Hypotheses
The following sections aim at disentangling intergenerational cooperation using centipede games. Hence, we guide our study on the following.
Hypothesis 1 Players stop the game at the first chance they have to move.
Hypothesis 2 Playing the game repeatedly does not affect the behavior sug-gested in Hypothesis 1.
Hypothesis 3 Hypothesis 1 and Hypothesis 2 hold for all players, regardless of their own age and the age of their opponent.
Hypothesis 4 In case Hypothesis 1 and Hypothesis 2 are rejected, we do not expect systematic in-group differences among age groups.
2
Experimental Design
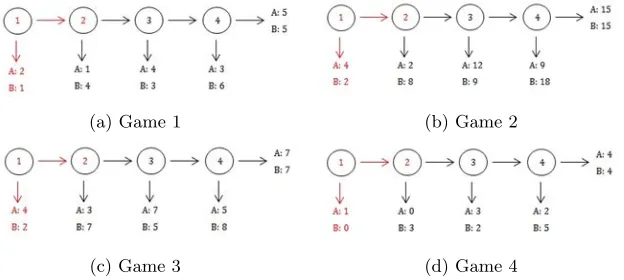
We study four versions of the centipede game. The four centipede games have
each four nodes, but different payoff specifications (Reny, 1992)(Game 1 to
Game 4), as illustrated in Figure 2.
(a) Game 1 (b) Game 2
[image:7.595.137.449.408.548.2](c) Game 3 (d) Game 4
Figure 2: PayoffSpecifications
As can be seen from Figure 2, if any of the games reach Node 4, the mover
has here the choice to stop and keep a higher share of the total payoff, or to
continue at his own stake to equally share the total payoff with his opponent
(Rosenthal, 1981). Regardless of the strategy followed by each player to reach this one last Node, continuing here the game signals that the player equality concerns vis-`a-vis his opponent enters his utility function: we call this player a benevolent player.
The different payoffspecifications allow us to investigate whether the players
consistent in their choices regardless of the payoff at stake. For instance, if a player stops the game in Node 3 of Game 1, we would expect him to take
the same action if he is again a mover in Node 3 of Game 2, even if payoffs
are higher. Alternatively, higher potential payoffs can be understood as higher
opportunity costs of continuing the game. That is, if a player continues the
game in Node 1 of Game 1 with an opportunity cost of 1 euro –his payoffis case
his opponent then decides to end the game at his turn–, would he continue the game in Node 3 of Game 3, where his opportunity cost ascends to 3 euros? Last, in Node 2 of Game 2 we find one exception: continuing the game is the salient
solution. Indeed, here both players will be better off if the game continues.
Those players stopping here signal a non-benevolent player, as opposed to the benevolent player that continues the game if the game reaches Node 4.
The four games are played twice in order to test our Hypothesis 2 to 4. Here we need to disentangle the information at disposal in each decision node. On
the one hand, we find information coming from learning effects derived from the
specificities of each game (payofffunctions) as well as from playing the centipede
game repeatedly. On the other hand, we find information about the opponent’s age group, as we explain in the Procedures. Hence, we confront the same player to the same decision twice to test on his actions and reactions.
2.1
Subject Pool
All participants were German native speakers with different backgrounds and income levels. To control for possible asymmetries across sessions we controlled for subjects’ experience, and we only invited participants that have not pre-viously taken part in an economic experimental study (Friedman and Cassar, 2004; Croson, 2005). All participants knew that only native German speakers were invited to take part of the sessions. This was desirable for two reasons.
First, as our aim is at studying age related differences, we needed a
homoge-neous population in order to avoid stereotypes linked to different nationalities
or languages. Second, we based much of our questionnaire on the European
Social Survey2
(ESS) run in Germany. In order to generalize the results of our research, we needed to approach our sample to the ESS one.
Our sample consists of 1923
participants from the state of Bremen, Germany. Half of the sample was composed of participants aged between 18 and 26 years old, while the other half of the sample involved participants older than 55 years. The average age for the Juniors cohort was 21.7 years old, with a median of 21 and a standard deviation of 2.32. For the Senior cohort the average is of 63,8 years old, with a median of 63 and a standard deviation of 6.54. Both cohorts
2
ESS Round 5: European Social Survey Round 5 Data (2010). Data file edition 3.0. Norwegian Social Science Data Services, Norway. Data Archive and distributor of ESS data.
3
exhibit similar figures to the ESS, except for the dispersion of the older cohort, which is of 8.13.
2.2
Procedures
The experiment took place at the Jacobs University Bremen Laboratory for Social Sciences. We conducted 16 sessions, each lasting less than 1 hour. At
the beginning of each session, the instructions4
were read out loud to all the participants to ensure common knowledge about the rules of the game. Partic-ipants were then matched in pairs and were asked to participate in 8 rounds, corresponding to playing twice the four games detailed in Figure 2. That said, in round 1 (R1) participants played game 1, in round 2 (R2) they played game 2, in round 3 (R3) they played game 3, in round 4 (R4) they played game 4, and in rounds 5 to 8 (R5 to R8) they played again games 1 to 4 in the same order and maintaining the same roles as before, thus allowing to control for experience. Before each round, the participants faced a screen informing them about the age cohort of the partner; i.e. whether the partner was older or younger than 55 years old. At least 4 matching groups took part in each session, and only
one round at random was effectively payed.
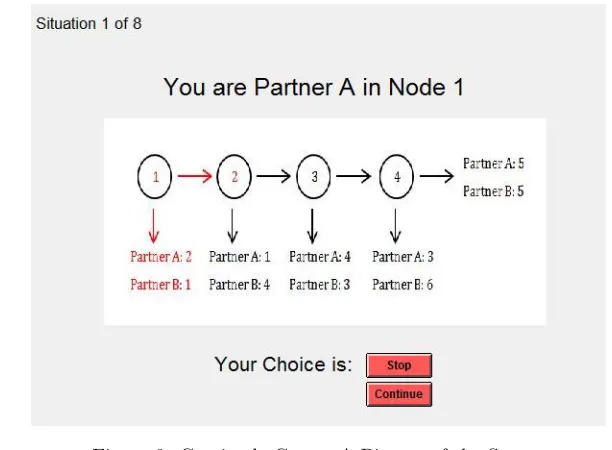
[image:9.595.138.444.431.656.2]The experiment was computerized and run utilizing the zTree software (Fis-chbacher, 2007). Figure 3 illustrates a picture of the screen as the participants would see it.
Figure 3: Centipede Game: A Picture of the Screen
4
A set of control questions was asked to test for the participants’ under-standing of the experiment. After the 8 rounds, the participants realized a distributional preferences incentivized task (Balafoutas et al., 2012) and were then asked to solve a race game against the computer (Gneezy et al., 2010) to test for the ability for backward inductive reasoning. Finally, they filled out a survey composed of demographic and social (trust) questions taken from the ESS, as before mentioned. We payed all participants privately in cash at the end of the session.
[image:10.595.159.437.333.535.2]3
Experimental Results and Discussion
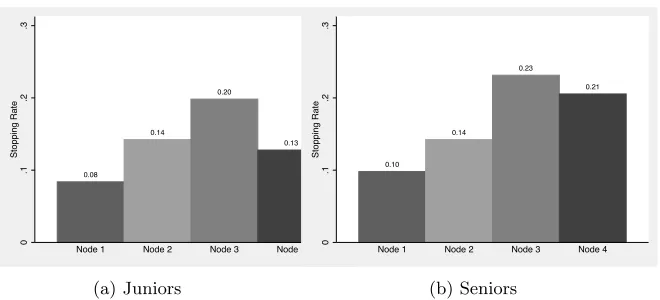
Figure 4 and Figure 5 show stop rates at each node. Figure 4 pools data across players and rounds; Figure 5 pools data across rounds but distinguishes the data according to the age group of the players.
0.18
0.28
0.43
0.33
0
.1
.2
.3
.4
.5
Stopping Rate
Node 1 Node 2 Node 3 Node 4
Figure 4: Pooled Rounds: Probability of Stopping, by Node
In line with previous research (cf. Introduction), Figure 4 and Figure 5 show that stop rates increase during the game until reaching the last Node. Indeed, contrary to the backward induction argument, only 18% of the games end at the first node. Then, after the first node, the probabilities of stopping are never even near to the theoretically expected 100% stopping rates. Moreover, in Node 4, 67% of the games continue. That said, our results are in line with previous experimental studies questioning the strength of the backward induction argu-ment.
0.08 0.14
0.20
0.13
0
.1
.2
.3
Stopping Rate
Node 1 Node 2 Node 3 Node 4
(a) Juniors
0.10 0.14
0.23
0.21
0
.1
.2
.3
Stopping Rate
Node 1 Node 2 Node 3 Node 4
[image:11.595.136.466.146.296.2](b) Seniors
Figure 5: Pooled Rounds: Probability of Stopping, by Age Group and Node
stopping rate nearly 60% higher that juniors. It seems that in the last node, there where continuing the game guarantees a loss for the mover, seniors’ prob-ability of stopping is higher than juniors’. This would be suggesting that seniors
decision making would be payoffmotivated.
From Figure 4 we observe that 70% of the players reaching Node 4 decide to continue the game to the equitable payoff, even if they have to incur into a loss.
Taken altogether, these first findings suggest there must exist non backward inductive arguments behind the choices of participants belonging to any age groups.
3.1
Backward Induction Reasoning
We have noted in the Introduction two reasons why a player might choose not to stop the game in the first node, and those are related to following a different strategy than backward induction, which could be resumed to altruist imitator (McKelvey and Palfrey, 1992) and other regarding preferences (Rabin, 1993; Fehr and Schmidt, 1999; Dufwenberg and Kirchsteiger, 2004). A third reason we mentioned is related to an inability to reason following backward induction (Gneezy et al., 2010; Levitt et al., 2011).
To test for backward induction, all subjects were asked to play a race to 20 game (Gneezy et al., 2010) against the computer. In this version of the game, both the computer and the players in turns choose a number between 1 and 9. The first to hit exactly 20, wins. The computer starts in order to make sure that the subjects have always the chance to win. If the participant wins, he increases his total earnings by 3 euros, otherwise he earns 0 euros. The race game allows us to observe the ability to follow backward induction reasoning, since it eliminates strategical concerns, as well as beliefs related to other regarding preferences.
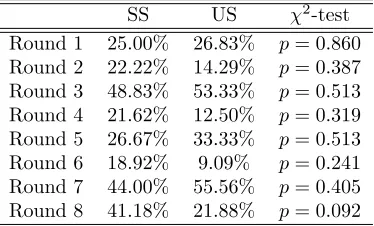
the race game, and 80 players did not. We are here particularly interested in whether those participants who successfully backward induct in the race game choose to stop at their first chance in the centipede. Table 1 shows the probability that the 79 players who successfully solved the race game stop at the first chance they have to move if that chance is in Node 1, next to the probability that the 80 players that did not successfully solved the race game stop at this same first chance. The last column indicates the outcome of the
χ2-test comparing both results. In only one of the 16 cases presented in Table
[image:12.595.202.389.327.440.2]1 and Table 2 together the t-test shows significant results: Node 1, Round 7. Given that in Node 2, Round 7, does not hold, we can think that the result is due at random. We will investigate further on this in further section.
Table 1: Node 1: Stop Probability per Round when Race Game was Successfully Solved (SS) versus when Race Game was Unsuccessfully Solved (US)
SS US χ2-test
Round 1 6.67% 2.62% p= 0.392
Round 2 17.65% 4.88% p= 0.074
Round 3 22.22% 21.08% p= 0.897
Round 4 14.29% 19.51% p= 0.564
Round 5 24.44% 18.42% p= 0.507
Round 6 23.53% 12.20% p= 0.197
Round 7 38.64% 18.42% p= 0.045
Round 8 20.00% 24.39% p= 0.647
Table 2: Node 2: Stop Probability per Round when Race Game was Successfully Solved (SS) versus when Race Game was Unsuccessfully Solved (US)
SS US χ2-test
Round 1 25.00% 26.83% p= 0.860
Round 2 22.22% 14.29% p= 0.387
Round 3 48.83% 53.33% p= 0.513
Round 4 21.62% 12.50% p= 0.319
Round 5 26.67% 33.33% p= 0.513
Round 6 18.92% 9.09% p= 0.241
Round 7 44.00% 55.56% p= 0.405
Round 8 41.18% 21.88% p= 0.092
[image:12.595.203.390.498.611.2]3.2
Learning and Beliefs
In the centipede game, actions are conditioned on beliefs. Following Petit and Sudgen (1989), ”beliefs are determined by the data at [our] disposal”. Thus, our first choice is only based on information about the opponent’s age group, while our choice in further nodes incorporates learning derived from our actions and the actions of others in previous nodes as well. In order to study beliefs in repeated interactions, we need to disentangle learning effects from the actions (and reactions).
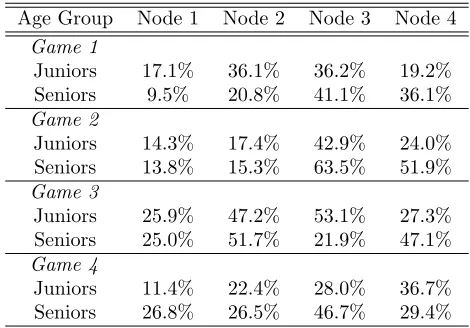
[image:13.595.177.412.356.520.2]To explore the existence of a learning effect during the course of the experi-ment, we first look into the four games separately. A first glimpse into the data is shown in Table 3, which reveals that from Game 1 to Game 4 seniors seem to show a learning process that moves toward increasing the number of stops at the first node, hence converging to the backward induction solution. This is not true for the juniors, nor for the rest of the rounds for any age group.
Table 3: Stop Probability, per Age Group, Game and Node
Age Group Node 1 Node 2 Node 3 Node 4
Game 1
Juniors 17.1% 36.1% 36.2% 19.2%
Seniors 9.5% 20.8% 41.1% 36.1%
Game 2
Juniors 14.3% 17.4% 42.9% 24.0%
Seniors 13.8% 15.3% 63.5% 51.9%
Game 3
Juniors 25.9% 47.2% 53.1% 27.3%
Seniors 25.0% 51.7% 21.9% 47.1%
Game 4
Juniors 11.4% 22.4% 28.0% 36.7%
Seniors 26.8% 26.5% 46.7% 29.4%
Learning effects could also be occurring within each game. Figure 6 exhibits the probability that the mover choses to stop the game at each node conditional
upon reaching that node, differentiating R1-4 from R5-8. The number of games
stopping in Node 2 and in Node 3 is similar for both R1-4 and R5-8. How-ever, when looking at Node 1 and Node 4, we do find statistically significant
differences among R1-4 and R5-8 (χ2-test,p= 0.005 andp= 0.029 for Nodes 1
and 4, respectively). Investigating further, we observe that in Node 1 43 games stop in R1-4 and 45 games in R5-8, while in Node 4 these figures are of 72 and 28 respectively. This information reveals that a shift towards the backward induction solution occurs within each game as well.
0.07 0.14
0.23
0.21
0
.1
.2
.3
Stopping Rate
Node 1 Node 2 Node 3 Node 4
(a) Rounds 1 to 4
0.11 0.14
0.20
0.13
0
.1
.2
.3
Stopping Rate
Node 1 Node 2 Node 3 Node 4
[image:14.595.137.466.147.296.2](b) Rounds 5 to 8
Figure 6: Probability of Stopping, by Node
those players switching from ”continue” to ”stop” should not change their mind more than once, regardless of the generation of their opponent.
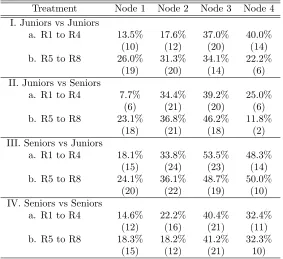
Table 4 and Table 5 display the proportion of games ending up in each
terminal node differentiating per treatment, and their implied probability
con-ditional on reaching that node, respectively. Implied probability refers here to the odds of stopping the game conditioned upon reaching that node. In Table 4 the absolute number of games can be found in between brackets underneath
their corresponding odd5
.
Conforming to previous research results, for all treatments the implied stop probabilities increase as we get closer to the last node, except for those games arriving at the very last node where the number of observations is normally significantly lower than those in the previous nodes. Also, even though the number of players stopping at the first node is much higher than in previous experiments (cf. Introduction) where nearly 5% of the subjects stop at the very first node, we do find similar results when it comes to the middle nodes: nearly 60% of the games stop by Node 3.
Juniors
In Node 1, we find that in Treatment I juniors’ stopping rate is weakly
significantly different and higher in R1-4 compared to R5-8 (χ2-test,p= 0.057).
For Treatment II, however, these figure is significantly different and higher in
R1-4 compared to R5-8 (χ2-test,p= 0.008).
In Node 2, even though the stopping rates for Treatments I and II are higher in R5-8 than in R1-4 (17.6% to 31.3%, and 34.4% and 36.8%, respectively), the
differences are not significant (χ2-test, p = 0.068 and χ2-test, p = 0.784,
re-spectively), indicating no learning effects within treatments. In Node 3, as in
Node 2, the stopping rates in R1-4 and R5-8 are not significantly different from
each other in Treatment I (χ2-test, p = 0.771), nor in Treatment II χ2-test,
5
Table 4: Stop Probability, per Treatment and Round
Treatment Node 1 Node 2 Node 3 Node 4
I. Juniors vs Juniors
a. R1 to R4 13.5% 17.6% 37.0% 40.0%
(10) (12) (20) (14)
b. R5 to R8 26.0% 31.3% 34.1% 22.2%
(19) (20) (14) (6)
II. Juniors vs Seniors
a. R1 to R4 7.7% 34.4% 39.2% 25.0%
(6) (21) (20) (6)
b. R5 to R8 23.1% 36.8% 46.2% 11.8%
(18) (21) (18) (2)
III. Seniors vs Juniors
a. R1 to R4 18.1% 33.8% 53.5% 48.3%
(15) (24) (23) (14)
b. R5 to R8 24.1% 36.1% 48.7% 50.0%
(20) (22) (19) (10)
IV. Seniors vs Seniors
a. R1 to R4 14.6% 22.2% 40.4% 32.4%
(12) (16) (21) (11)
b. R5 to R8 18.3% 18.2% 41.2% 32.3%
(15) (12) (21) 10)
p= 0.509).
Last, in Node 4, the proportion of players choosing to continue the game seems to increase from R1-4 to R5-8 in both Treatment I and Treatment II, though the number of observations is too small to derive conclusions in Treat-ment II. Still, it is important to point out that the number of games arriving to the last node is nearly the triple in the first four rounds than in the second four rounds (14 to 6, and 6 to 2 in Treatment I and in Treatment II, respectively).
For none of the Nodes we find significant differences when comparing average
stopping rates in Treatment I and Treatment II (Node Iχ2-test,p= 0.320; Node
IIχ2-test,p= 0.500; Node IIIχ2-test,p= 0.770; Node IV χ2-test,p= 0.155).
From these results we can infer that, in a first past, juniors do give se-niors higher chances of cooperation, suggesting initial out-group favoritism (Coq et al., 2013), but this result is fastly reversed. Additionally, the results from Node 2 and Node 3 together would be suggesting that juniors would reveal themselves to behave as altruist imitators when playing against seniors as much
as when playing against juniors. Overall, for juniors, learning effects are not
different when facing an opponent of their same age group than when facing an
opponent of a different age group.
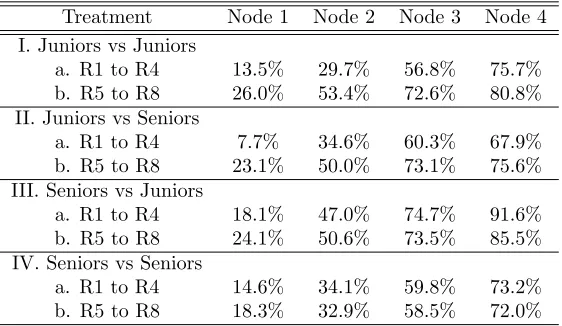
Table 5: Implied Stop Probability, per Treatment and Round
Treatment Node 1 Node 2 Node 3 Node 4
I. Juniors vs Juniors
a. R1 to R4 13.5% 29.7% 56.8% 75.7%
b. R5 to R8 26.0% 53.4% 72.6% 80.8%
II. Juniors vs Seniors
a. R1 to R4 7.7% 34.6% 60.3% 67.9%
b. R5 to R8 23.1% 50.0% 73.1% 75.6%
III. Seniors vs Juniors
a. R1 to R4 18.1% 47.0% 74.7% 91.6%
b. R5 to R8 24.1% 50.6% 73.5% 85.5%
IV. Seniors vs Seniors
a. R1 to R4 14.6% 34.1% 59.8% 73.2%
b. R5 to R8 18.3% 32.9% 58.5% 72.0%
Turning our attention to the seniors, we find that in Treatment III, the number of players stopping at their first opportunity does not significantly differ
from the first four rounds to the second four rounds, nor in Node I (χ2-test,
p= 0.341), nor in Node II (χ2-test, p = 0.786). The differences are also not
significant for Treatment IV, both for Node I (χ2-test,p= 0.528) and for Node II
(χ2-test,p= 0.555), suggesting consistent behavior regardless of the age group
of their opponent. However, the stopping rates in the first two nodes are lower in Treatment IV compared to Treatment III –though only highly significant
for Node 2 (χ2-test, p= 0.007)–, implying and in-group effect: in a first pass,
seniors would be giving higher chance to cooperate to seniors than to juniors.
In Node 3, seniors do not exhibit significant differences in average stopping
rates when comparing Treatment III to Treatment IV (Node 3 χ2-test, p =
0.156; Node 4χ2-test, p = 0.071), nor they do between their choice in R1-4
compared to their choice in R5-8 in Treatment III (Node 3χ2-test, p= 0.666;
Node 4p= 0.935) and Treatment IV (Node 3 p= 926; Node 4p= 0.993).
The significantly higher stopping rates in Treatment III compared to Treat-ment IV, suggest an initial in-group effect for the age group of seniors: seniors prefer cooperating with seniors more than with juniors. Together with the re-sults from Table 5 showing that the number of games ending in Treatment IV is significantly smaller than in Treatment III, we can say that for seniors, the in-group effect offsets the learning effects.
Juniors and Seniors
A last result derives from the analyses of the effect of other regarding
pref-erences within our games, and comes from looking at decisions in Node 2 in Game 2 and in Node 4 of all games.
In Node 2 of Game 2, seniors and juniors do not show significant differences
con-tinue the game, is here not associated to other regarding preferences (Balafoutas
et al., 2012) for seniors (χ2-test,p= 0.097) nor for juniors (χ2-test,p= 0.230),
which makes us believe that the altruist imitator strategy may be in place. For the last node, we find that other regarding preferences are not associated
to the decision of continuing the game, not for seniors (χ2-test, p= 0.211) nor
for juniors (χ2-test,p= 0.092), which makes us think that the choice is related
to positive reciprocity rather than to benevolence: people are willing to sacrifice
their own payoffto help those that they think have been kind to them (Rabin,
1993). Additionally, when looking at the probability of stopping per age group at this node, we find that it is for seniors, on average, 15% higher than for
juniors (χ2-test, p = 0.056) and nearly the double when it comes to Game 2
where the stakes are much higher (χ2-test, p= 0.039).
The validity of these results increase as we confirm they are not income related: we find no association between juniors’ decision to pass in the last node
and income (χ2-test, p = 0.880), nor between seniors’ decision to pass in the
last node and income (χ2-test,p= 0.408).
We complement the analysis by looking at profits of both age groups. Here
we find that juniors do not show significant different profits when playing against
juniors than when playing against seniors (two sided test,p= 0.172), but seniors
do. Indeed, seniors matched with seniors exhibit significantly higher profits than
when matched with juniors (two sided test,p= 0.021), and the magnitude is of
nearly 20% higher (almost 1 sum). This difference remains significant for seniors
playing against seniors and stopping in Node 4 (χ2-test, p= 0.038), but at a
magnitude of 45% difference (2 sums). This suggest that seniors, on average,
reach higher nodes when playing against seniors, reinforcing the in-group argu-ment, but in Node 4 they are more likely to stop than to continue. As a matter of fact, only for seniors this result goes in line with previous research suggesting that group identity manipulations increase positive reciprocity among in-group partners (Chen and Li, 2009).
So far these results imply that for seniors reciprocity is payoffand in-group
driven, and occurs for lower opportunity costs.
3.3
Beliefs and Age
We have so far analyzed learning effects within and between games over the
course of the sessions. Focusing in beliefs purely based on the information about the opponent’s age group requires analyzing only decisions in the first node more in detail, knowing ex-ante what corresponds to learning effects: do both age groups converge to the self interest equilibrium solution in the same manner? Figure 7 shows the stop probabilities at the first node at each round and for each treatment.
These figures show the reactions –per round– of both juniors and seniors to
the different opponents they face. As we can observe, the convergence toward
0.02 0.03 0.06 0.01 0.10 0.04 0.08 0.01 0 .02 .04 .06 .08 .1 Stopping Rate
Round 1 Round 2 Round 3 Round 4 Round 5 Round 6 Round 7 Round 8
(a) Treatment I
0.01 0.01 0.04 0.01 0.04 0.05 0.07 0.07 0 .02 .04 .06 .08 Stopping Rate
Round 1 Round 2 Round 3 Round 4 Round 5 Round 6 Round 7 Round 8
(b) Treatment II
0.00 0.04 0.05 0.07 0.02 0.03 0.06 0.08 0 .02 .04 .06 .08 Stopping Rate
Round 1 Round 2 Round 3 Round 4 Round 5 Round 6 Round 7 Round 8
(c) Treatment III
0.01 0.03 0.07 0.08 0.06 0.05 0.07 0.07 0 .02 .04 .06 .08 Stopping Rate
Round 1 Round 2 Round 3 Round 4 Round 5 Round 6 Round 7 Round 8
[image:18.595.135.467.148.447.2](d) Treatment IV
Figure 7: Percentage of ”Stop” in Node 1 per Round
repeat again, we can think that belief formation already occurred.
Following these lines, juniors when playing against juniors show lower rates of convergence than when playing against seniors. Indeed, in Treatment I their decisions are much more round-dependent than when playing against seniors, where they mostly choose to continue, until reaching R5 where they do just start stopping at increased rates, showing a clear adjustment of beliefs. Seniors converging from R1-4 and from R5-8 in Treatment III is showing that they do allow themselves to re-form beliefs about juniors, even though the higher stop rates in R5-8 compared to R1-4 would be also revealing more cautiousness. This is not the case when they play among themselves, where the stop rate increases from R1to R4, and then stays nearly constant and at relatively much higher levels compared to the rest of their choices, revealing that decisions are done
regardless of the payoffspecifications, thus favoring in-group partners.
group, tˆatonnement or experimentation mainly occurs when playing against subjects belonging to the same age group, but seniors show a lower overall variance.
These results suggest that the age group identity of the players can define
their payoffs and the others’ (Akerlof and Kranton, 2000), and that seniors,
different to juniors, incorporate age group identity as an argument of their
utility function.
4
Concluding Remarks
In this study, we explore repeated sequential interactions among juniors and seniors. We used a centipede game to see how beliefs about the opponent’s age group shape that interaction. We find that juniors and seniors adjust their decisions depending on who they play against. We showed that this behavior is not related to any inability to backward induct or to other regarding preferences, but depends on the players’ beliefs about the other player’s age group.
In the centipede game, cooperation leads to higher payoffs. In line with
Chen and Li (2009) our findings show the existence of an in-group effect, but
only for seniors, who exhibit the highest payoffs when playing against seniors.
Tˆatonnement or experimentation mainly occurs when participants play against subjects belonging to the same age group, and its variance is higher for juniors, suggesting that their in-group actions are driven by uncertainty.
Our results confirm the very recent findings of Tremewan and Wagner (2013)
on the effects of group identity on outcomes, by showing that juniors and seniors
behavior in a cooperation game depends on their beliefs about the behavior of the member of the other age group, and not –only– on other regarding prefer-ences.
References
George A. Akerlof and Rachel E. Kranton. Economics and identity. Quarterly
Journal of Economics, 115(3):715–753, 2000.
Robert J. Aumann. Irrationality in game theory. In F. Hahn and P.
Das-gupta, editors,Economic Analysis of Markets and Games: Essays in Honor
of Frank Hahn, pages 214–227. M.I.T. Press, 1992. ISBN 9780262041270.
URLhttp://books.google.de/books?id=Rg HCz9X okC.
Loukas Balafoutas, Rudolf Kerschbamer, and Matthias Sutter.
Dis-tributional preferences and competitive behavior. Journal of
Economic Behavior & Organization, 83(1):125–135, 2012. URL
http://ideas.repec.org/a/eee/jeborg/v83y2012i1p125-135.html.
Ken Binmore. Rationality in the centipede. In Proceedings of
the 5th conference on Theoretical aspects of reasoning about
Morgan Kaufmann Publishers Inc. ISBN 1-55860-331-X. URL
http://dl.acm.org/citation.cfm?id=1028104.1028115.
C. L. Bouton. Nim, a game with a complete mathematical theory. Annals of
Mathematics, 3:35–39, 1901-02.
Gary Charness and Marie-Claire Villeval. Cooperation and
compe-tition in intergenerational experiments in the field and the
labora-tory. American Economic Review, 99(3):956–78, June 2009. URL
http://ideas.repec.org/a/aea/aecrev/v99y2009i3p956-78.html.
Yan Chen and Xin Li. Group identity and social preferences. American
Eco-nomic Review, 99:431–457, 2009.
Andrew M. Colman. Cooperation, psychological game
the-ory, and limitations of rationality in social interaction.
Be-havioral and Brain Sciences, 26(02):139–153, 2003. URL
http://dx.doi.org.arugula.cc.columbia.edu:2048/10.1017/S0140525X03000050.
Chloe Le Coq, James Tremewan, and Alexander K. Wagner. Social centipedes: the impact of group identity on preferences and reasoning. Technical report, University of Vienna, September 2013.
Rachel Croson. The method of experimental economics. International
Negoti-ation, 10(1):131–148, 2005.
Martin Dufwenberg and Georg Kirchsteiger. A theory of sequential
reci-procity. Games and Economic Behavior, 47(2):268–298, May 2004. URL
http://ideas.repec.org/a/eee/gamebe/v47y2004i2p268-298.html.
Ernst Fehr and Klaus M. Schmidt. A theory of
fair-ness, competition, and cooperation. The Quarterly
Jour-nal of Economics, 114(3):817–868, August 1999. URL
http://ideas.repec.org/a/tpr/qjecon/v114y1999i3p817-868.html.
Mark Fey, Richard D. McKelvey, and Thomas R. Palfrey. An experimental study of constant-sum centipede games. Working Papers 877, California Institute of Technology, Division of the Humanities and Social Sciences, 1996. URL
http://ideas.repec.org/p/clt/sswopa/877.html.
Urs Fischbacher. z-tree: Zurich toolbox for ready-made economic
ex-periments. Experimental Economics, 10(2):171–178, June 2007. URL
http://ideas.repec.org/a/kap/expeco/v10y2007i2p171-178.html.
Daniel Friedman and Alessandra Cassar. Economics Lab: An intensice course
Uri Gneezy, Aldo Rustichini, and Alexander Vostroknutov.
Ex-perience and insight in the race game. Journal of Economic
Behavior & Organization, 75(2):144–155, August 2010. URL
http://ideas.repec.org/a/eee/jeborg/v75y2010i2p144-155.html.
Werner G¨uth, Carsten Schmidt, and Matthias Sutter. Bargaining
out-side the lab - a newspaper experiment of a three-person
ultima-tum game. Economic Journal, 117(518):449–469, 03 2007. URL
http://ideas.repec.org/a/ecj/econjl/v117y2007i518p449-469.html.
Hakan J Holm and Paul Nystedt. Intra-generational trust–a
semi-experimental study of trust among different generations. Journal
of Economic Behavior & Organization, 58(3):403–419, 2005. URL
http://EconPapers.repec.org/RePEc:eee:jeborg:v:58:y:2005:i:3:p:403-419.
Stephanie Kovalchik, Colin F. Camerer, David M. Grether, Charles R. Plott,
and John M. Allman. Aging and decision making: a comparison
be-tween neurologically healthy elderly and young individuals. Journal of
Economic Behavior & Organization, 58(1):79–94, September 2005. URL
http://ideas.repec.org/a/eee/jeborg/v58y2005i1p79-94.html.
David M. Kreps, Paul Milgrom, John Roberts, and Robert
Wil-son. Rational cooperation in the finitely repeated prisoners’ dilemma.
Journal of Economic Theory, 27(2):245–252, August 1982. URL
http://ideas.repec.org/a/eee/jetheo/v27y1982i2p245-252.html.
Steven D. Levitt, John A. List, and Sally E. Sadoff.
Check-mate: Exploring backward induction among chess players.
American Economic Review, 101(2):975–90, April 2011. URL
http://ideas.repec.org/a/aea/aecrev/v101y2011i2p975-90.html.
Richard D McKelvey and Thomas R Palfrey. An experimental study
of the centipede game. Econometrica, 60(4):803–36, July 1992. URL
http://ideas.repec.org/a/ecm/emetrp/v60y1992i4p803-36.html.
Rosemarie Nagel and Fang-Fang Tang. Experimental results on the centipede game in normal form: an investigation on learning. Technical report, Hebrew University of Jerusalem, Center for Rationality and Interactive Decision The-ory, 1997.
Ignacio Palacios-Huerta and Oscar Volij. Field centipedes.American Economic
Review, 99(4):1619–35, September 2009. doi: 10.1257/aer.99.4.1619. URL
http://www.aeaweb.org/articles.php?doi=10.1257/aer.99.4.1619.
Philip Petit and Robert Sudgen. The backward induction paradox.The Journal
o, 86(4):169–182, 1989.
Matthew Rabin. Incorporating fairness into game theory and economics.
American Economic Review, 83(5):1281–1302, December 1993. URL
Amnon Rapoport, William E. Stein, James E. Parco, and Thomas E. Nicholas. Equilibrium play and adaptive learning in a three-person centipede game.
Games and Economic Behavior, 43(2):239–265, 2003.
Philip J. Reny. Rationality in extensive-form games.
Jour-nal of Economic Perspectives, 6(4):103–118, Fall 1992. URL
http://ideas.repec.org/a/aea/jecper/v6y1992i4p103-18.html.
Robert W. Rosenthal. Games of perfect information, predatory pricing and the
chain-store paradox.Journal of Economic Theory, 25(1):92–100, August 1981.
URLhttp://ideas.repec.org/a/eee/jetheo/v25y1981i1p92-100.html.
Reinhard Selten. The chain store paradox. Working Papers 018,
Biele-feld University, Center for Mathematical Economics, July 1974. URL
http://ideas.repec.org/p/bie/wpaper/018.html.
Matthias Sutter. Outcomes versus intentions: On the
na-ture of fair behavior and its development with age.
Jour-nal of Economic Psychology, 28(1):69–78, January 2007. URL
http://ideas.repec.org/a/eee/joepsy/v28y2007i1p69-78.html.