Munich Personal RePEc Archive
The diffusion of electric vehicles: An
agent-based microsimulation
McCoy, Daire and Lyons, Sean
Trinity College Dublin, The Economic and Social Research Institute
18 March 2014
Online at
https://mpra.ub.uni-muenchen.de/54633/
The diffusion of electric vehicles: An agent-based microsimulation
Daire McCoya,∗, Sean Lyonsa
a
The Economic and Social Research Institute, Whitaker Square, Sir John Rogerson’s Quay, Dublin and Department of Economics, Trinity College, Dublin, Ireland
Abstract
We implement an agent-based, threshold model of innovation diffusion to simulate the adoption of
electric vehicles among Irish households. We use detailed survey microdata to develop a nationally
representative, heterogeneous agent population. We then calibrate our agent population to reflect
the aggregate socioeconomic characteristics of a number of geographic areas of interest. Our data
allow us to create agents with socioeconomic characteristics and environmental preferences. Agents
are placed within social networks through which the diffusion process propagates. We find that
even if overall adoption is relatively low, mild peer effects could result in large clusters of adopters
forming in certain areas. This may put pressure on electricity distribution networks in these areas.
KeywordsElectric vehicles; Agent-based modelling; Spatial microsimulation
JEL ClassificationC63, D1, O33, Q4, Q55
1. Introduction
Electric vehicles (EVs) have been around since the mid-nineteenth century but have only
re-cently been offered as a mass-market alternative to private cars with petrol and diesel engines.
They are considered an important element in de-carbonising the transport sector and a number of
governments have introduced initiatives to encourage their adoption. While this may have
environ-mental benefits, both in direct emission reductions and in helping achieve CO2 reduction targets in
electricity generation [1], negative externalities also exist with mass-adoption. A large engineering
literature documents the negative effects clustering of electrical load and uncontrolled charging of
∗Corresponding author
large numbers of EVs could have on low-voltage distribution networks [2; 3] and [4]. At the
ag-gregate network level, high penetrations of these vehicles, when charging, may exacerbate existing
peaks in electricity demand [5]. Even if overall adoption levels are very low, this could be
concen-trated in relatively few areas, due to the heterogeneous spatial distribution of individuals. This
effect could be exacerbated if there is spatial dependence in adoption behaviour1.
To examine this problem we create a tool to simulate how adoption patterns and clustering
might develop over time and across space. We use an agent-based methodology to explicitly model
the interactions which may give rise to emergent outcomes, not immediately obvious from an
aggre-gation of individual preferences. Adoption is modelled as a binary choice. Agents have a threshold
beyond which the benefits to adoption exceed the costs. Their utility is a function of their
so-cioeconomic characteristics, environmental behaviour and attitudes. Their utility from adoption
increases as their peers adopt and as the innovation gains popularity within the population. Agents
are heterogeneous, drawn from a detailed, nationally representative study connected to an Irish
elec-tricity smart-metering trial. Agent populations are spatially explicit; we can generate populations
of agents to match any geographic area of interest.
2. Agent-based adoption models
Agent-based models or ABMs are useful when describing systems of interacting agents, that
exhibit emergent properties not easily deduced by aggregating the preferences of individual agents.
ABMs have been widely used to study the diffusion of new technology. We will mainly focus on
the diffusion of ”green” technology for the purposes of this work.
Within an ABM framework, the diffusion process can take different forms. Linder [10] uses a
Bass diffusion model to simulate adoption profiles for EVs amongst households in Stuttgart in 2020.
Based on microdata they construct different adopter types and simulate various scenarios of spatial
diffusion. They find that adopters will concentrate in urban areas and that spatial differences will
become quite apparent by 2020.
Tran [11] explicitly models social network effects to examine their interaction with individual
preferences in innovation diffusion. The author simulates adoption profiles for a variety of competing
1This has been shown to occur in the adoption of solar PV panels in California [6], High-voltage air conditioning
vehicle types; including petrol, diesel, EV and hybrid electric vehicle (HEV). Using heterogeneous
agents, it is found that network influence can be an important factor in driving high levels of
adop-tion, even if agents have low individual incentives to adopt. However, he cautions that homophily
can account for a lot of what first appears to be contagion. Other work by the same author [12],
examines the techno-behavioural aspects of diffusion.
Threshold models are also widely used throughout the literature. Eppstein et al. [13] develop
spatially explicit, agent-based consumer choice models of plug-in hybrid electric vehicle (PHEV)
adoption to assess the market’s sensitivity to various input parameters, such as fuel prices, battery
range, purchase price and government subsidies. Agents have characteristics such as age and salary.
Social groups are modelled as homophilous networks with fat-tailed degree distributions. An agent’s
threshold is defined as the proportion of adopters within its social group required for the agent to
adopt; this is negatively correlated to their salary - the authors argue that wealthier agents would
be less risk averse, thus having a lower threshold.
Hamilton et al. [14] model technology diffusion when consumers are uncertain about the
per-formance of a new technology versus the old one. The agent environment is a square lattice of N
cells and agents receive electricity from three potential sources; the grid, solar or CHP. Agent’s
thresholds are normally distributed and heterogeneous. An interesting aspect of this paper is the
emergence of”punctuated equilibria”. This is a characteristic of a complex system, in which
neg-ligible changes in inputs can induce dramatic shifts in system outputs. This feature is observed
empirically when the diffusion process does not follow the textbook S-curve.
Other research [15] simulates the adoption of smart-metering technology. This paper has similar
features to others mentioned in that agents have local and random interactions on a grid, allowing
for networks which exhibit small-world and scale-free properties. An interesting feature of this
paper is the finding that a random and dispersed initial seeding can yield a much higher overall
diffusion rate than a controlled centralised one. This has interesting policy implications when one
considers government interventions to induce adoption of socially beneficial technologies.
A big problem inhibiting the widespread adoption of green technologies is consumer indifference.
This is explicitly modelled by Kowalska-Pyzalska et al. [16], in which the authors examine the
diffusion of dynamic electricity tariffs. Again, the environment is modelled as a square lattice.
Influence is channelled through nearest-neighbours and media. Indifference is essentially noise in
agent is unable to compare. They find that due to high levels of indifference, widespread adoption
will be ”virtually impossible” in modern societies, highlighting the need for better information in
order to overcome this.
The focus of our research broadly follows a number of other papers in which agents have a utility
function associated with the adoption of a new product. Agents have a threshold beyond which the
benefits of adoption exceed the costs and they adopt. Within this literature thresholds can take
various distributional forms, be heterogeneous or be the same for all agents.
Delre et al. [17] use a simple utility function consisting of two terms, individual preference
and social influence. Agents are heterogeneous in their preferences and thresholds are uniformly
distributed. The authors experiment with regular lattice and preferential attachment networks.
An interesting element of this research is the study of so-called VIP effects. This is created using
scale-free, non-symmetric adjacency matrices, with heterogenous weights on the edges to represent
social networks. This is a more realistic representation of real-life networks where influence is not
bi-directional. Certain nodes have a greater number of connections, but they also have a greater
magnitude. Interestingly, they find that when modelling influential nodes it is the number of
connections, more so than their weight/magnitude that propagates the diffusion process.
McCullen et al. [18] extend this approach to multi-parameter models. Along with peer-effects,
they include a term for overall diffusion in the population (the S-curve). Thus, agents are influenced
by their personal preferences, peer-effects and social-norms. Various network types are constructed;
random, small-world and highly clustered community-based networks. They take a dynamical
systems approach, rather than agent based, and run multiple simulations to explore the parameter
space. They find that the level of adoption depends strongly on network topology and the relative
weightings of parameters.
Palmer et al. [19] employ a similar methodology to simulate the diffusion of photovoltaic (PV)
systems in Italy. Each agent has a unique utility which is a function of the payback period of
the investment, the environmental benefit to the agent, their income and peer-influence from other
agents within the population. Adopter categories are constructed using Sinus-Milieu(R) data for
Italy and this information is also used to construct homophilous social groups. The aggregate
adoption level is calibrated to past data, then projections are made. The authors find a common
threshold for all agents that best fits the data and the model output is very sensitive to changes in
also chosen to calibrate to past data.
In terms of the spatial aspect of adoption, Campbell et al. [20] use a clustering algorithm
on Birmingham Census data to determine the areas most likely to have high proportions of early
adopters. Others employ a similar methodology using Finnish data [21], but go a little further in
that they find the correlation between certain demographic and socio-economic characteristics and
early HEV adoption.
We incorporate elements from a range of the above mentioned research in our work, we use
clustering algorithms on Census data to determine where we might expect dense concentrations of
adopters to form. We then generate agent populations based on the distribution of characteristics
within these areas. Following that we employ a version of McCullen’s main model equation in our
agent-based model. We also include elements of [19] in that we decompose personal preferences
into economic and environmental categories.
3. Materials and Methods
3.1. Basic Principles
The basic principle examined by this model is the interaction of individual preferences and
peer-effects in the adoption or spread of behaviour, attitudes or new technologies.
3.2. Entities, State Variables and Scales
Entities or agents represent households. Agents are heterogenous and defined by a matrix of
static and dynamic characteristics. They are located within a neighbourhood. The neighbourhood
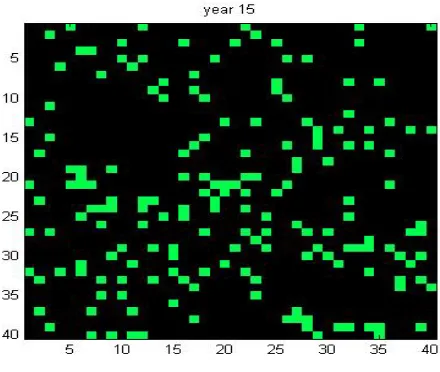
is represented as a discrete, homogenous grid. A regular lattice of sizeN1∗N2, whereN1∗N2 =N
Fig. 1. Agent Environment forN= 1600 agents att= 15. Agents are represented as squares on the grid. The green agents have adopted, the black have yet to adopt. Graphics generated using MATLAB code adapted from [22]
The global environment consists of a number of adjacent neighbourhoods based on Irish Census
2011 data. We will mainly work with Electoral Districts (EDs) of about 1,000 households. However,
we could easily adapt our environment to cover Small-Areas (approximately 100 households) or
much larger regions.
Agents are created using a large, nationally representative micro-data set connected to an
elec-tricity metering trial (CER Smart Metering Behavioural Trial 2009). For more information on data
used see Appendix 6.1. Agents are described by two attributes, which we call Income Utility (IU)
and Environmental Utility (EU).
To create IU, we use the age and social class of the household’s chief income earner,
com-bined with the tenure type of the household, IU ∈ [0,1]. This is an adoption probability which could be considered an implicit budget constraint. Other things being equal, agents with a higher
IU are more likely to adopt. We create simple rules; e.g. Pr(Adopting | of socialclassAB) >
Table 1
Socioeconomic variables
ranking Age Social class Tenure
1 25-59 AB own outright
2 all other categories C1 own with mortgage
3 C2 rent private
4 DE rent from local authority
5 F other
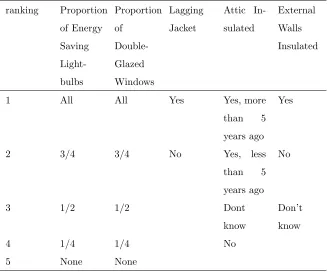
Agent’s EU is based on their attitude toward the environment and previous adoption of energy
saving technology within their homes,EU ∈[0,1]. Other things being equal, agents with a higher EU are more likely to adopt. Further detail on this procedure can be found in appendix 6.2.
Table 2 Environmental variables-behavioural ranking Proportion of Energy Saving Light-bulbs Proportion of Double-Glazed Windows Lagging Jacket Attic In-sulated External Walls Insulated
1 All All Yes Yes, more
than 5
years ago Yes
2 3/4 3/4 No Yes, less
than 5
years ago No
3 1/2 1/2 Dont
know
Don’t
know
4 1/4 1/4 No
5 None None
Table 3
Environmental variables-attitudinal
ranking Opportunity to
sell back
elec-tricity Environmental damage as-sociated with electricity gen-erated Percentage of electric-ity generated from renewable sources
1 Very dissatisfied Very dissatisfied Very dissatisfied
2
3
4
5 Very Satisfied Very Satisfied Very Satisfied
home owner, of social class AB, have strong environmental preferences and already an adopter of a
range of energy saving technologies within their home. We have identified these characteristics as
being prominent amongst early stage adopters of EVs from the literature2. A limit to this work
is that we did not have access to econometric estimates of the parameters. We also acknowledge
that the weightings we attach to different attitudes or behaviours is problematic as we do not
know their relative importance in determining the adoption decision. However, we argue that
in reality statistical distributions do exist that describe the range of individual preferences in a
population, even if we can’t always fully observe them. Also, much research in this space, assumes
these distributions to take some or other form, e.g. uniform, normal etc, which can appear quite
arbitrary. We base ours on detailed survey data and we argue that this allows us a greater claim
to realism.
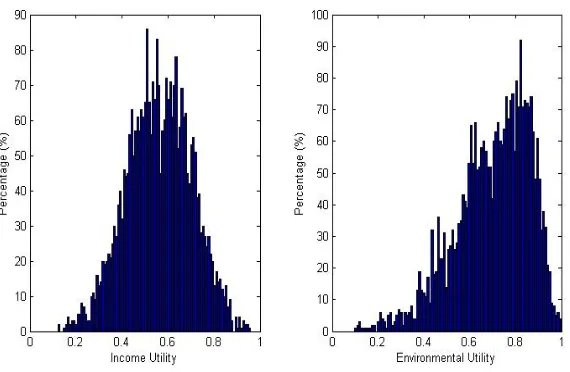
Fig. 2 below shows the distribution of agent preferences generated from survey data in the full
sample of 3099 individuals. IU and EU are weakly positively correlated. We will draw sub-samples
from this to create our agent populations.
2Early adopters of EVs are expected to share a number of characteristics with early adopters of hybrid electric
Fig. 2. Distribution of Preferences for full agent population
3.3. Collectives
We will mainly experiment with two different types of social network, that have a number of
the characteristics of real-life social networks; small-world and preferential attachment. In order
to better describe these, it is first useful to introduce two other network types; regular lattice and
Fig. 3. Social Networks: N= 20 nodes or agents in each case. Agents arranged in a circle for illustrative purposes only. Network matrices constructed using CONTEST [26]. Network graphics using ”Matlab Tools for Network Analysis” [27]
Starting with the regular lattice in fig. 3.1a, each node is connected to it’sknearest neighbours,
withk= 2 in this case. This is a very simple network type and not very realistic as nodes can only
have local connections. In the next network, a random graph fig. 3.1b, nodes do not necessarily
have any local connections but are randomly connected to any other node in the network. Again
this is an unrealistic characterisation of a real social network.
A small-world network, fig. 3.1c can be considered something in between a regular lattice and a
random graph. They are both highly clustered and have short characteristic path lengths.
Small-World networks were originally proposed by [28]. The authors found that by randomly re-wiring
a certain proportion of the edges of a regular lattice, they could create a graph which had
”small-world” properties. The graph shown has a rewiring probability of 0.1. A wide range of networks in
both physical and social systems have this property. Graphs with small-world properties include
the neural networks of worms, the electric power grid and collaboration networks in academia and
film. For a discussion of their statistical properties, see [29].
Preferential attachment networks fig. 3.1d, exhibit a scale-free property. The connectivity
dis-tribution of nodes within these networks decay as a power-law. This essentially means that the
con-nections, e.g. node v1. As new nodes enter the network, they connect with existing nodes with
a probability which is an increasing function of the number of connections these nodes currently
have. These highly-influential nodes could be considered opinion leaders in a community. Many
real-life networks also exhibit this property.
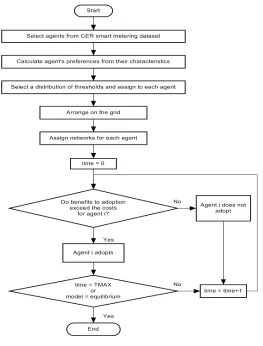
3.4. Process Overview and Scheduling
The main process in this model is the diffusion of EVs. At every time step, each agent decides
to adopt or not. A time step is defined as the length of time it takes to update all agents and thus
does not correspond to real time. Agents are updated sequentially on the grid, starting at the
top-left corner. Simulations last until all agents are activated or until the model reaches equilibrium.
Equilibrium will occur when a gap in either the threshold distribution, or in the agent’s individual
Fig. 4. Flow-chart of agent updates
3.5. The Model
3.5.1. Agent Decision Making
The adoption status of each agent is represented as a binary variable; 1 ifagenti has adopted, 0
otherwise. Adoption is an absorbing state - once an adopter it is not possible to switch back. This
model is adapted from the work of [17; 18; 19].
xi(t+ 1) =
1, ifxi(t) = 1
1, ifxi(t) = 0 and if equation ( 2) is true
0, otherwise
The adoption submodel is the main engine of the agent-based model. Agenti adopts with a
certain probability once its utilityUi exceeds its thresholdθi.
Ui(t)≥θi(t) and ift∗crit≥rand(0,1) (2)
Utility is a weighted function of individual preferences (IU, EU), peer effects (G) and wider
social norms (S).
Ui(t) =αiIUi+βiEUi+γiGi(t) +δiS(t) (3)
Withαi+βi+γi+δi= 1
3.5.2. Individual Preferences
Individual Preferences are determined by an agent’s income utility (IU) and an environmental
utility (EU). These have been described in detail above.
3.5.3. Peer Influences
Agents are modelled as nodes in a network. Influence between nodes is represented by an
adjacency matrix A.
Ai,j=
1, ifnnode i influences node j
0, otherwise
(4)
Group influence is the proportion of adopters within each agent’s social group.
Gi(t) = 1
ki N X j=1
Aijxj(t) (5)
3.5.4. Social Norms
This is the total number of adopters in the population.
S(t) = 1
N
N X i=1
xj(t) (6)
3.5.5. Technology/Information Deficiency
This parameter is a decaying stochastic cost term that accounts for poor products or poor
information about the product when in its infancy. This is to account for the inertia that can exist
will be slow in the early periods but by timet= 10,t∗crit= 1 and the product will have reached maturity or agents will be fully informed of its benefits.
3.5.6. Rules/Archetypes
As stated aboveαi+βi+γi+δi = 1. We can set fixed weights or allow them to vary depending
on the agent or product. This is explained in greater detail in section 4.1.
4. Simulations and Results
4.1. EV adoption for a random sample of agents
Electric vehicles are expensive items and this should be reflected in the decision rule that agents
might make when purchasing one. Therefore we feel that peer effects might have a limited impact
for certain agents. An individual may be more likely to buy one if a neighbour or friend has one
and speaks favourably about it. Or someone with very strong environmental concerns may be more
inclined to buy one. However, income will constrain the available options. To initially calibrate the
model we create four different consumer groups. We segment agents based on their IU and EU.
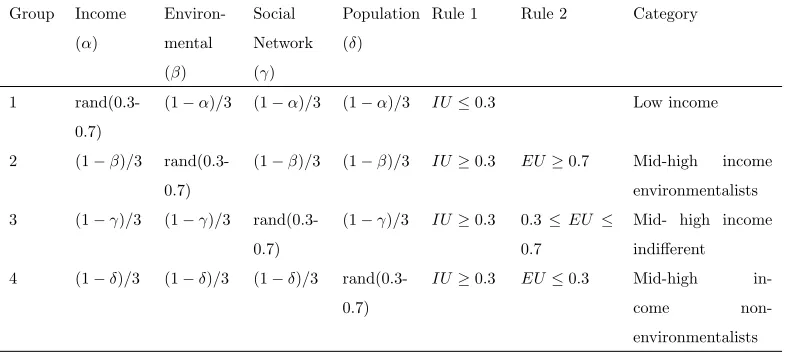
Table 4 below displays the weights we attach to preferences for each group. We create stochastic
[image:15.612.109.502.449.626.2]weights, within bounds to account for the uncertainty in their estimation.
Table 4
Parameter weightings for EV
Group Income
(α)
Environ-mental
(β)
Social
Network
(γ)
Population
(δ)
Rule 1 Rule 2 Category
1
rand(0.3-0.7)
(1−α)/3 (1−α)/3 (1−α)/3 IU≤0.3 Low income
2 (1−β)/3
rand(0.3-0.7)
(1−β)/3 (1−β)/3 IU≥0.3 EU≥0.7 Mid-high income
environmentalists
3 (1−γ)/3 (1−γ)/3
rand(0.3-0.7)
(1−γ)/3 IU≥0.3 0.3≤EU ≤
0.7
Mid- high income
indifferent
4 (1−δ)/3 (1−δ)/3 (1−δ)/3
rand(0.3-0.7)
IU≥0.3 EU≤0.3 Mid-high
in-come
❼ Group 1: Low income agents will be income constrained regardless of their environmental preferences and thus will place a high importance on IU. This is an implicit budget constraint.
We allowαtake a random value between 0.3 and 0.7
❼ Group 2: Mid-high income environmentalists will place a high importance on environmental factors. We allowβ take a random value between 0.3 and 0.7
❼ Group 3: Mid-high income indifferent agents may be influenced by word of mouth from their peers. We allowγtake a random value between 0.3 and 0.7
❼ Group 4: Mid-high income non-environmentalists have negative attitudes and behaviour to-wards environmental issues and will only adopt if a high proportion of the total population
adopt. We allowδtake a random value between 0.3 and 0.7
Again we select a random sample of N = 1600 agents from our population. We set threshold
distribution θ∼N(0.65,0.15) to generate relatively low adoption levels. These results have been verified for a range of threshold distributions. In all simulations thresholds are negatively correlated
with IU, as per [13].
4.1.1. The effect of seeding and network type on adoption
With a network model we can examine whether it matters who adopts first within the population.
In order to do this we seed different groups of agents, i.e. we initialise them as being EV owners.
To seedagenti, we setxi= 1 at timet= 0. This may be policy relevant for initiatives which target
specific consumer groups in order to encourage the mass adoption of EVs. Three different seeding
methods are examined.
1. Seed random: We seed random samples of 5% of the agent population
2. Seed early adopter: We seed the 5% of the agent population with the highest probability of
adoption, given their personal preferences
3. Seed most influential nodes: We seed the 5% of the agent population with the greatest number
of connections. This can be either a random or early adopter seeding. To do this we place a
5% seeding, then re-arrange the adjacency matrix to make these the most connected nodes in
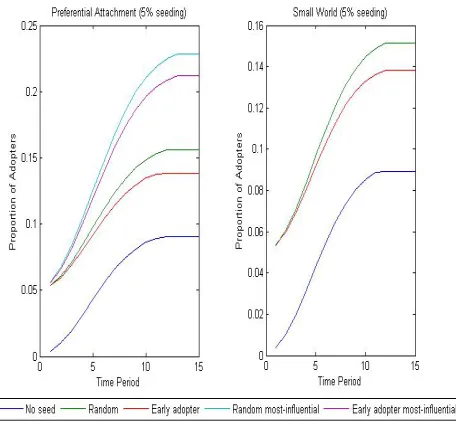
Results are reported in fig. 5 and tables 5 and 6 below. We first connect agents with preferential
attachment networks, table 5. Without intervention average adoption after 15 time periods is just
over 9%. We then compare seeding a random group of agents with seeding the early adopters.
Interestingly a random seeding yields a higher mean adoption level. We suspect this is because
the early adopters are likely to adopt anyway. However, by activating a random group of agents,
adoption is spreading to agents and groups that would otherwise not have adopted. Zhang and
Nuttall [15] found similar results in their ABM of smart-metering technology adoption.
Within a preferential attachment network some nodes have a much greater number of
connec-tions than others. We investigate the outcome when the most influential nodes adopt first. We
find that seeding is much more effective when the most influential are targeted. Again, a random
distribution results in higher adoption than if the high probability agents adopt first. However, in
reality it is impossible to fully map the network topology. This simulation is run to illustrate the
point that if we aim to encourage high levels of adoption through the targeting of specific consumer
groups, we need much better data on the channels through which technology diffuses.
These results also hold for small-world networks as can be seen in table 6. We must be cautious
when interpreting these results, due to limitations with the model. In particular, the adjacency
matrices we use are symmetrical and we do not place different weights on the links between nodes
in the network. In reality, as well as having many connections, some individuals are likely to have
Fig. 5. EV adoption levels. Results reported for average uptake after 100 Simulations ofN= 1600 Agents.
[image:18.612.107.539.383.480.2]θ∼N(0.65,0.15) for all simulations
Table 5
Preferential Attachment
Mean Std. Dev. Min Max
No seeding 9.28 1.04 7.00 12.25
Random 5% 15.93 1.04 13.44 18.63
Early Adopter 5% 14.18 0.89 11.50 16.63
Random most connected 5% 23.31 1.51 18.25 26.81
Early Adopter most connected 5% 21.45 1.38 18.19 24.63
Table 6
Small-World
Mean Std. Dev. Min Max
No seeding 9.25 0.95 7.00 11.44 Random 5% 15.48 1.01 12.69 17.56
Early Adopter 5% 14.04 0.90 11.50 16.25
In reality though, neighbourhood composition is not random and clusters may develop if certain
types of individual self-select into particular areas. We will examine this in the next section.
4.2. EV adoption for specific neighbourhoods
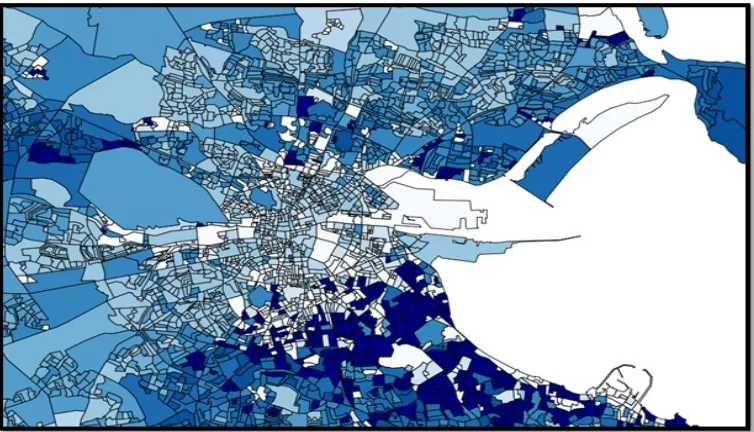
To motivate this section we use Census 2011 data to generate a heat map of areas with high
proportions of likely early adopters in Dublin, fig. 6. We use Ward’s clustering algorithm to rank
Small-Areas based on their proportions of individuals of social class AB, who drive a car to work
Fig. 6. Spatial distribution of likely early adopters for Census Small-Areas in Dublin (approx 100 households in each area). Areas are ranked 1-10. 1-coloured white indicates a very low proportion, 10-coloured dark blue indicates a very high proportion
There is quite a degree of spatial heterogeneity, as can be seen. This is interesting as positive
network externalities may exacerbate clustering in areas with high proportions of adopters. To
simulate this process we generate agent populations that represent the distributions of households
within these areas.
4.2.1. Adoption levels
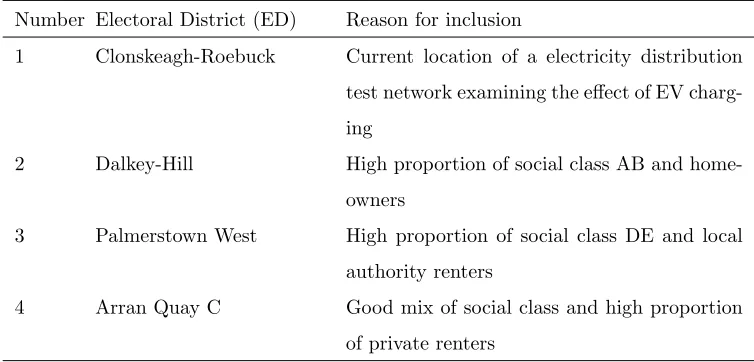
In this section we focus on four neighbourhoods, based on Census Electoral Districts (EDs)
which vary in their socioeconomic characteristics. The selected EDs are Clonskeagh-Roebuck,
Dalkey-Hill, Palmerstown West and Arran Quay C. We select houses based on the social class of
Table 7
Neighbourhoods included in simulations
Number Electoral District (ED) Reason for inclusion
1 Clonskeagh-Roebuck Current location of a electricity distribution
test network examining the effect of EV
charg-ing
2 Dalkey-Hill High proportion of social class AB and
home-owners
3 Palmerstown West High proportion of social class DE and local
authority renters
4 Arran Quay C Good mix of social class and high proportion
of private renters
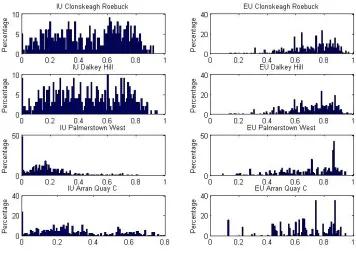
Fig. 7. Distribution of agent preferences for different EDs
We use the previous model specification and parameter set up. We split our grid into four
quadrants to represent each ED. This process no longer generates the smooth adoption S-curves
previously observed when using a random sample, fig. 8. This is because we now have groups of
similar individuals and their preference distribution can take discrete jumps, potentially causing a
number of similar agents to adopt within the same time period as each other.
Results are reported below in fig. 8 and tables 8 and 9. The wealthier neighbourhoods (1,2)
with a greater proportion of homeowners have much higher adoption levels the the less wealthy
(3,4), as expected. Interestingly, the choice of network used to connect agents now begins to have
a greater impact on the results.
Preferential attachment networks lead to average adoption levels of 17-18% in the wealthier
neighbourhoods and 0.7-3.2% in the less wealthy neighbourhoods.
However, small-world networks generate over 10% higher average adoption levels for the
these areas. This level is very sensitive to changes in threshold distribution and a reduction of
threshold mean from 0.65-0.55 can induce uptake of over 50% for these areas. This lowering of
threshold is analogous to the cost or barriers to adoption dropping. For instance, if technological
developments allowed price to fall or if charging infrastructure improved for a particular area the
cost to adoption for agents in that area would fall. This high adoption in certain areas may have
[image:22.612.194.414.215.419.2]an impact on the distribution network in these areas. We will discuss this in the next section.
Fig. 8. EV adoption levels. Results reported for average uptake after 100 Simulations ofN= 1600 Agents.
[image:22.612.109.306.526.595.2]θ∼N(0.65,0.15)
Table 8
Preferential attachment network
ED Mean Std. Dev Min Max
Clonskeagh-Roebuck 18.02 1.02 16 21
Dalkey-Hill 17.61 1.1 15.5 21
Palmerstown West 3.18 0.42 2.5 4.25
Arran Quay C 0.69 0.38 0 1.75
Table 9
Small-world network
ED Mean Std. Dev Min Max
Clonskeagh-Roebuck 29.77 0.61 27 30.5
Dalkey-Hill 31.79 0.33 30.75 32.5
Palmerstown West 3.97 0.1 3.75 4.25
Arran Quay C 1.99 0.035 1.75 2
4.2.2. Local Clustering
The most interesting results occur when we examine the level of clustering of adopters. We find
[image:22.612.352.546.527.595.2]Table 10
Clustering. Results reported for 100 simulations ofN= 1600 agents.θ∼N(0.65,0.15)
Network type Number of clusters Size of clusters
Small-World Mean Max Min Mean Max Min
k= 1 21.06 24 17 12.26 295 2
k= 2 21.06 24 17 22.47 242 2
k= 3 21.06 24 17 23.78 237 2
k= 4 15.32 17 13 33.84 236 2
k= 5 21.06 24 17 26.66 249 2
Preferential attachment 23.54 29 16 2.36 9 2
However cluster size increases dramatically if agents are connected locally using small-world
net-works. If agents are connected to just their two nearest neighbours (k = 1), mean cluster size increases from 2 to 12. Cluster size further increases as we increase the number of local connections
agents are allowed to have. We can’t generalise these results as they may be particular to the areas
in question, and our networks are a stylised version of reality. However, we can say that even mild
Fig. 9. Distribution of cluster size for small-world networks
In a study of a test network of 134 households in Dublin, Richardson et al. [30] found that severe
voltage drop and unsafe thermal loading of components can occur when EV penetration reaches
27-44% of the households. Clusters occurring further from the transformer have a greater impact.
From the distribution of cluster size we generate, it is quite possible to observe clusters that in
reality would be large enough to cause the network to exceed safe operating limits. This problem
would be greater if clusters are located towards the end of network line, away from the substation
bus.
5. Conclusion
In this paper we present a simple and stylised agent-based model of EV adoption amongst Irish
households. The motivation was to create a tool in order to model;
❼ The drivers of aggregate adoption levels
❼ The formation of clusters of adopters at a local level
This is relevant because we know that spatial dependencies do exist in the adoption of ”green”
technologies and if this exists for EVs it may cause negative externalities in the form of reduced
life for electricity network assets.
We use an agent-based methodology as there is potential for micro-interactions to generate
aggregate outcomes that can’t be deduced by merely examining the preferences of individuals. We
adapt a methodology used by others and apply it to the diffusion of EVs amongst Irish households.
Agents are created based on detailed, nationally representative survey data. We define simple
rules that govern their behaviour, link them with other agents, through different network types and
place them within an environment. We then use a spatial microsimulation algorithm to generate
agent populations that represent specific geographic areas of interest.
We find that it is important who adopts first in determining the overall diffusion level in the
population. We demonstrate that in order for policies encouraging the adoption of socially beneficial
technologies to succeed, network topology needs to be better understood.
In terms of clustering, we find that mild peer-effects can induce very high adoption levels in
certain areas. Even if overall adoption levels are quite low, this could be highly clustered in certain
areas and peer-efects within those areas could significantly increase cluster size. This could lead to
increased costs for electricity network operators and ultimately for consumers, as the average cost
of improvements to the network will be socialised.
There are many limitations to this type of modelling in general and to this model in particular.
We do not claim to accurately understand agent preferences; we merely use survey data to generate
distributions that should be considered place-holders in order to calibrate this model. Nor do we
claim to create realistic social networks; we experiment with different network types, both of which
contain some of the characteristics of actual human social networks. We do not suppose to fully
describe the various consumer groups that may exist; we use some simple rules to segment the
population into different groups to illustrate how heterogenous groups can alter the dynamics of
such a system.
Further work will involve collecting survey data to better inform our choice of parameters. As
more data on EV adopters becomes available, we will be better able to characterise them. Survey
data on early adopters and the factors which influence them to adopt would help inform our network
matrices. We could potentially generate adoption profiles for all Census Small-Areas in Dublin to
this model with engineering network-cost models.
Acknowledgements
The research was conducted as part of the Sustainable Electrical Energy Systems (SEES) cluster.
The funding from Science Foundation Ireland (SFI) and the ESRI Energy Policy Research Centre
is gratefully acknowledged.
References
[1] A. Foley, B. Tyther, P. Calnan, B. Gallachir, Impacts of electric vehicle charging under
electric-ity market operations, Applied Energy 101 (2013) 93–102. doi:10.1016/j.apenergy.2012.06.052.
URLhttp://dx.doi.org/10.1016/j.apenergy.2012.06.052
[2] K. Schneider, C. Gerkensmeyer, M. Kintner-Meyer, R. Fletcher, Impact assessment of plug-in
hybrid vehicles on pacific northwest distribution systems, Institute of Electrical and Electronics
Engineers, 2008, pp. 1–6. doi:10.1109/PES.2008.4596392.
URLhttp://dx.doi.org/10.1109/PES.2008.4596392
[3] S. Shao, M. Pipattanasomporn, S. Rahman, Challenges of PHEV penetration to the
resi-dential distribution network, Institute of Electrical and Electronics Engineers, 2009, pp. 1–8.
doi:10.1109/PES.2009.5275806.
URLhttp://dx.doi.org/10.1109/PES.2009.5275806
[4] P. Richardson, D. Flynn, A. Keane, Impact assessment of varying penetrations of electric
vehicles on low voltage distribution systems, Institute of Electrical and Electronics Engineers,
2010, pp. 1–6. doi:10.1109/PES.2010.5589940.
URLhttp://dx.doi.org/10.1109/PES.2010.5589940
[5] K. Parks, P. Denholm, A. J. Markel, Costs and emissions associated with plug-in hybrid electric
vehicle charging in the xcel energy colorado service territory, Tech. Rep. NREL/TP-640-41410,
National Renewable Energy Laboratory (May 2007).
[6] B. Bollinger, K. Gillingham, Peer effects in the diffusion of solar photovoltaic panels, Marketing
[7] D. S. Noonan, L.-H. C. Hsieh, D. Matisoff, Spatial effects in energy-efficient
resi-dential HVAC technology adoption, Environment and Behavior 45 (4) (2013) 476–503.
doi:10.1177/0013916511421664.
URLhttp://dx.doi.org/10.1177/0013916511421664
[8] J. Axsen, D. C. Mountain, M. Jaccard, Combining stated and revealed choice research to
sim-ulate the neighbor effect: The case of hybrid-electric vehicles, Resource and Energy Economics
31 (3) (2009) 221–238. doi:10.1016/j.reseneeco.2009.02.001.
URLhttp://dx.doi.org/10.1016/j.reseneeco.2009.02.001
[9] J. Axsen, K. S. Kurani, Interpersonal influence within car buyers social networks: applying
five perspectives to plug-in hybrid vehicle drivers, Environment and Planning A 44 (5) (2012)
1047–1065. doi:10.1068/a43221.
URLhttp://dx.doi.org/10.1068/a43221
[10] S. Linder, Spatial diffusion of electric vehicles in the german metropolitan region of stuttgart,
in: ERSA conference papers, no. ersa11p557, European Regional Science Association, 2011.
[11] M. Tran, Agent-behaviour and network influence on energy innovation diffusion,
Com-munications in Nonlinear Science and Numerical Simulation 17 (9) (2012) 3682–3695.
doi:10.1016/j.cnsns.2012.01.016.
URLhttp://dx.doi.org/10.1016/j.cnsns.2012.01.016
[12] M. Tran, Technology-behavioural modelling of energy innovation diffusion in the uk, Applied
Energy 95 (2012) 1–11. doi:10.1016/j.apenergy.2012.01.018.
URLhttp://dx.doi.org/10.1016/j.apenergy.2012.01.018
[13] M. J. Eppstein, D. K. Grover, J. S. Marshall, D. M. Rizzo, An agent-based model to study
market penetration of plug-in hybrid electric vehicles, Energy Policy 39 (6) (2011) 3789–3802.
doi:10.1016/j.enpol.2011.04.007.
URLhttp://dx.doi.org/10.1016/j.enpol.2011.04.007
[14] D. J. Hamilton, W. J. Nuttall, F. A. Roques, Agent based simulation of technology
adop-tion, Tech. rep., EPRG Working Paper 0923, Electricity Policy Research Group, University of
[15] T. Zhang, W. J. Nuttall, An agent based simulation of smart metering technology adoption,
Tech. rep., EPRG Working Paper 0727, Electricity Policy Research Group, University of
Cam-bridge (December 2007).
[16] A. Kowalska-Pyzalska, K. Maciejowska, K. Sznajd-Weron, R. Weron, Going green:
Agent-based modeling of the diffusion of dynamic electricity tariffs, Tech. rep., Hugo Steinhaus Center,
Wroclaw University of Technology (2013).
[17] S. A. Delre, W. Jager, T. H. A. Bijmolt, M. A. Janssen, Will it spread or not? the effects of
social influences and network topology on innovation diffusion, Journal of Product Innovation
Management 27 (2) (2010) 267–282. doi:10.1111/j.1540-5885.2010.00714.x.
URLhttp://dx.doi.org/10.1111/j.1540-5885.2010.00714.x
[18] N. J. McCullen, A. M. Rucklidge, C. S. E. Bale, T. J. Foxon, W. F. Gale, Multiparameter
models of innovation diffusion on complex networks, SIAM Journal on Applied Dynamical
Systems 12 (1) (2013) 515–532. doi:10.1137/120885371.
URLhttp://dx.doi.org/10.1137/120885371
[19] J. Palmer, G. Sorda, R. Madlener, Modeling the diffusion of residential photovoltaic systems in
italy: An agent-based simulation, Tech. rep., E. ON Energy Research Center, Future Energy
Consumer Needs and Behavior (FCN) (2013).
[20] A. R. Campbell, T. Ryley, R. Thring, Identifying the early adopters of alternative fuel vehicles:
A case study of birmingham, united kingdom, Transportation Research Part A: Policy and
Practice 46 (8) (2012) 1318–1327. doi:10.1016/j.tra.2012.05.004.
URLhttp://dx.doi.org/10.1016/j.tra.2012.05.004
[21] J. Saarenpaa, M. Kolehmainen, H. Niska, Geodemographic analysis and estimation
of early plug-in hybrid electric vehicle adoption, Applied Energy 107 (2013) 456–464.
doi:10.1016/j.apenergy.2013.02.066.
URLhttp://dx.doi.org/10.1016/j.apenergy.2013.02.066
[22] M. Lai, Y. Poltera, Lecture with computer exercises: Modelling and simulating social systems
[23] R. Hjorthol, Attitudes, ownership and use of electric vehicles–a review of literature, Tech.
rep., 1261/2013, Institute of Transport Economics, Norwegian Centre for Transport Research
(2013).
[24] Deloitte, Gaining traction: A customer view of electric vehicle mass adoption in the us
auto-motive market, available: http://www.deloitte.com.br (2010).
[25] R. Ozaki, K. Sevastyanova, Going hybrid: An analysis of consumer purchase motivations,
Energy Policy 39 (5) (2011) 2217–2227. doi:10.1016/j.enpol.2010.04.024.
URLhttp://dx.doi.org/10.1016/j.enpol.2010.04.024
[26] D. Higham, A. Taylor, Contest (controlable test matrices), university of Strathclyde. URL:
http://www.mathstat.strath.ac.uk/outreach/contest (May 2008).
URLhttp://http://www.mathstat.strath.ac.uk/outreach/contest/
[27] S. E. R. G. MIT, Matlab tools for network analysis (2006-2011), uRL: http://strategic.mit.edu/
(November 2011).
URLhttp://strategic.mit.edu
[28] D. J. Watts, S. H. Strogatz, Collective dynamics of small-world networks, Nature 393 (6684)
(1998) 440–442.
[29] L. A. N. Amaral, A. Scala, M. Barthelemy, H. E. Stanley, Classes of small-world
net-works, Proceedings of the National Academy of Sciences 97 (21) (2000) 11149–11152.
doi:10.1073/pnas.200327197.
URLhttp://dx.doi.org/10.1073/pnas.200327197
[30] P. Richardson, D. Flynn, A. Keane, Impact assessment of varying penetrations of electric
vehicles on low voltage distribution systems, Institute of Electrical and Electronics Engineers,
2010, pp. 1–6. doi:10.1109/PES.2010.5589940.
URLhttp://dx.doi.org/10.1109/PES.2010.5589940
[31] CER, Commission for energy regulation, 2011b. results of electricity cost-benefit analysis,
customer behaviour trials and technology trials. smart metering information paper 4, available:
6. Appendices
6.1. Appendix A: Data
(1) CER Smart Metering Customer Behavioural Trial. This is a nationally representative
sam-ple of over 5,000 households in the Republic of Ireland. This dataset contains high frequency
energy consumption data along with socioeconomic information on the participants. The survey
was conducted on Electric Ireland customers who at that time represented 100% of Irish residential
electricity demand. Households were randomly assigned to a treatment group or different control
groups in order to estimate the effect of different stimuli on residential electricity demand. This
is described in detail in [31]. The main questions of interest for this paper are listed below in
Appendix 6.2
(2) Census 2011 Small Area Population Statistics. This is a national census, conducted in 2011,
based around 46 different tables covering a range of themes, see table 11. This data is disaggregated
to Small Area level, of which there are approximately 18,500 across the country; typically these
would consist of 80-100 households. We have based our agent populations on Electoral Districts
[image:30.612.90.518.460.603.2](EDs) of which there are approximately 3400.
Table 11
Census SAPS Themes. Source: Central Statistics Office (CSO), Census 2011 Small Area Population Statistics (SAPS)
Census SAPS Themes
Theme 1: Sex, age and marital status Theme 9: Social class and socio-economic group
Theme 2: Migration, ethnicity and religion Theme 10: Education
Theme 3: Irish language Theme 11: Commuting
Theme 4: Families Theme 12: Disability, carers and general health
Theme 5: Private households Theme 13: Occupation
Theme 6: Housing Theme 14: Industries
Theme 7: Communal establishments Theme 15: PC and internet Access
6.2. Appendix B: Weights applied to calculate IU and EU
To create weights we ranked each category from 0-1, summed up the totals and normalised between 0 and 1. We then add
a degree of randomness to these distributions. This is to remove the initial lumpiness, allowing them to be more continuous as
we would expect to be the case in reality.
In calculating EU, we felt past adoption is a better guide to future adoption than declared environmental attitudes. We
allowed the past adoption of energy saving measures within the home have 5 times the weight of the attitudinal data.
Table 12
Calculation of IU and EU
Income utility (IU) Environmental Utility (EU) - attitudinal Environmental Utility (EU) - behavioural
Social Class Rank Opportunity to sell back electricity Rank Lightbulbs Rank
AB 1.00 Very dissatisfied 1.00 All 1.00
C 0.25 - 0.50 3/4 0.80
DE 0.20 - 0.33 1/2 0.60
F 0.17 - 0.25 1/4 0.40
No answer 0.14 Very satisfied 0.20 None 0.20
Tenure Environmental damage with electricity generation Rank Windows Rank
own outright 1.00 Very dissatisfied 1.00 All 1.00
own with mortgage 0.50 - 0.50 3/4 0.80
rent private 0.33 - 0.33 1/2 0.60
rent from local authority 0.25 - 0.25 1/4 0.40
other 0.20 Very satisfied 0.20 None 0.20
Age Percentage generated from renewables Rank Lagging Rank
25-59 1.00 Very dissatisfied 1.00 Yes 1.00
Other 0.50 - 0.50 No 0.00
- 0.33
- 0.25
Very satisfied 0.20
Attic Rank
Yes, more than 5 years ago 1.00
Yes, less than 5 years ago 1.00
Don’t no 0.00
no 0.00
External Wall insulated Rank
Yes 1.00
No 0.00
6.3. Appendix C: Ward’s clustering algorithm
To rank Census small-areas we used Ward’s method, a hierarchical clustering algorithm. These
results are purely descriptive, do not feed into the simulations and were generated only to
graphi-cally represent the level of spatial heterogeneity that may exist. Dublin is divided into over 4000
small-areas. The objective of Ward’s method is to minimise within-cluster variance. It starts by
considering each individual area/observation as a cluster. It then begins to merge clusters with
each other, at each step finding the pair of clusters that leads to lowest within-cluster variance. We
decided after trial and error to allow 10 distinct clusters. We merged on:
1. absocial. The proportion of individuals of AB social class in each area
2. carwork. The proportion of individuals who drive to work
3. house. The proportion of individuals who live in a house
This work is informed by [20] who employ this method to determine the spatial location of
Table 13
Clusters generated for Dublin small-areas
wards10 absocial carwork house
1 mean 0.255 0.465 0.048
N = 196 sd 0.118 0.096 0.047
2 mean 0.392 0.234 0.060
N = 244 sd 0.091 0.113 0.072
3 mean 0.130 0.123 0.122
N = 347 sd 0.083 0.085 0.095
4 mean 0.202 0.220 0.549
N = 511 sd 0.127 0.092 0.139
5 mean 0.332 0.472 0.427
N = 231 sd 0.121 0.093 0.136
6 mean 0.202 0.429 0.975
N = 727 sd 0.057 0.048 0.025
7 mean 0.345 0.388 0.975
N = 748 sd 0.063 0.071 0.031
8 mean 0.334 0.364 0.757
N = 404 sd 0.120 0.091 0.074
9 mean 0.120 0.277 0.952
N = 952 sd 0.067 0.058 0.044
10 mean 0.519 0.387 0.972
N = 446 sd 0.065 0.060 0.041
Total mean 0.261 0.332 0.734