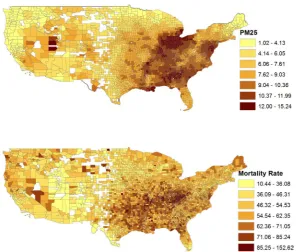
Geographical Analysis of Lung Cancer Mortality Rate and PM2 5 Using Global Annual Average PM2 5 Grids from MODIS and MISR Aerosol Optical Depth
Full text
Figure

Related documents
In composite applications, Vectran ® offers a unique balance of properties rarely found in synthetic fibers: minimal moisture regain, thermal stability, and excellent impact
Porter GCR Brazil 2003 10-09-03 CK.ppt Context for Firm Strategy and Rivalry Context for Firm Strategy and Rivalry Related and Supporting Industries Related and Supporting
Dengan adanya IP Public dapat menimbulkan adanya port-port yang terbuka pada Server, dari port-port yang terbuka dalam melakukan akses Internet dapat menimbulkan Serangan atau
to consider rising diversification that has characterised the banking sector and the continued justification of non- performing loans (NPL) as a reason for the high spread,
A player-initiated ‘panic button (e.g. denies gambling access for 24 hours) was ‘highly recommended’ for all online games, except poker tournaments for which it was
In agreement with international education experts, a multi-level approach is recommended that analyses systemic factors, the characteristics of educational institutions and
8.3 Researchers should note that all primary data, including both qualitative and quantitative data collected as part of AHURI research must be deposited in
