Nitrifying bacteria are widespread in soil and are responsible for the maintenance of soil fertility and a part of the nitrogen cycle(Troeh and Thompson 1993). Nitrifiers are difficult to cultivate, enumer-ate or isolenumer-ate because of their very specific growth requirements, and are very sensitive to any envi-ronmental changes as well as many organic and inorganic substances. The enumeration of nitrify-ing bacteria is typically carried out usnitrify-ing a Most Probable Number (MPN) technique (Alexander and Clark 1965, Finstein 1968, Ghiorse and Alexander 1978, Li et al. 2006) based on the detection of the production of HNO2 and HNO3 or the disappear-ance of NH4+ or NO2– from the medium. The de-tection of HNO2, HNO3 and NH4+ is usually done
using chemical methods. The standard chemical methods employed to detect the presence of HNO2, HNO3 and NH4+ rely on the use of hazardous chemi-cals such as α-naphthylamine and sulfanilic acid in the case of HNO2 or diphenylamine in the case
of HNO3. Other disadvantages of chemical tests are those that are relatively laborious, expensive, and time consuming (Sarathchandra 1979, Baikun and Shannon 2007). Membrane filter techniques for the enumeration of nitrifying bacteria were developed to avoid some of these problems, and the counts obtained by this method were in good agreement with the results obtained by using the MPN method (Finstein 1979, Li et al. 2006). More recently PCR-based techniques were developed for the detection and counting of nitrifier popula-tion in situ (Degrande and Bardin 1995, Jang et al. 2005, Pollard 2006, Yapsakli et al. 2011). Although membrane- and PCR-based methods avoid the use of hazardous chemicals, they are still relatively labor-intensive. This work aimed at developing a simple and inexpensive method for the enumera-tion of nitrifying bacteria based upon the change of color of growth media containing pH indicators in response to acid production during nitrification.
A new simple method for the enumeration of nitrifying
bacteria in different environments
Kh. Elbanna
1,2, R.M. El-Shahawy
1, K.M. Atalla
11
Department of Agricultural Microbiology, Faculty of Agriculture, Fayoum University,
Fayoum, Egypt
2
Department of Biology, Faculty of Applied Sciences, Umm Al-Qura University, Makkah,
Kingdome of Saudi Arabia
ABSTRACT
In this work, a simple, safe and rapid method for enumerating nitrifying bacteria was used as an alternative to tradi-tional harmful chemical methods. The enumeration of nitrifying bacteria was based upon the change of color of the growth media containing pH indicators in response to acid production during nitrification. The oxidation of ammo-nia to strong acids by nitrifiers leads to pH decrease, which can be detected by pH indicators such as methyl orange (MO), bromocresol green (BCG), methyl red (MR), bromothymol blue (BTB), and phenol red (PhR) using the Most Probable Number (MPN) technique. The use of these pH indicators revealed a higher estimate than the classical chemical methods in all tested samples. Ammonium oxidizer counts always exceeded those of nitrite oxidizers in the surveyed environments. The time required for the detection of growth (positive tubes in MPN) was descending in the following order: MO, BCG, MR, BTB and PhR. The time to detection was shorter for ammonium oxidizers than for nitrite oxidizers. Generally, nitrifier counts were very low in soils compared with farmyard manure or sew-age effluent. Incubation periods for both organisms differed from 4 to 8 weeks depended upon the indicator used. Finally, it could be concluded that the use of pH indicators, especially phenol red, as proposed in this study was ac-curate, sensitive and successfully applicable for the enumeration of nitrifiers in different environments.
MATERIAL AND METHODS
Nitrifier enrichment medium. Nitrifiers were enriched on Nakos and Wolcott (1979) medium containing (g/L): 0.3 (NH4)2SO4; 0.136 CaCl2; 0.175 MgSO4∙7 H2O; 0.5 NaHCO3; 13.5 Na2HPO4; 0.7 KH2PO4; 0.005 FeSO4∙7 H2O and 0.00375 NaMoO4. The pH of the medium was adjusted to 8.2 and autoclaved at 121°C for 20 min.
Original and modified media for the enu-meration of nitrifiers. Two different media by Alexander and Clark (1965) were used for culti-vating and enumerating nitrifying bacteria. The first medium was used for the cultivation and enumeration of all nitrifiers (ammonium and nitrite oxidizers). The chemical composition (g/L) of this medium was: 0.5 (NH4)2SO4; 1.0 K2HPO4; 0.03 FeSO4∙7 H20; 0.3 NaCl; 0.3 MgSO4∙7 H2O; 7.5 CaCO3. The second medium (0.006 NaNO2; 1.0 K2HPO4; 0.3 NaCl; 0.1 MgSO4∙7 H2O; 0.03 FeSO4∙7 H2O; 0.3 CaCl2 and 1.0 CaCO3) was used for the cultivation and enumeration of nitrite oxidizers only. These two mediawere modified to be appropriate for counting the nitrifying bac-teria (ammonium and nitrite oxidizers) depend-ing upon the change in pH of the growth media containing pH indicators. The modification was principally to avoid the buffering effect of CaCO3 present in the original media by replacing it with CaCl2 to keep the calcium concentration at the same level. K2HPO4 was replaced by K2SO4 and Ca3(PO4)2 to keep phosphorus and potassium at appropriate levels. In addition, the NaNO2 concentration was increased to 0.01 g/L in the nitrite oxidizer medium. The pH indicators (MO, BCG, MR, BTB and PhR) were individually added to the enumeration media before sterilization. The initial pH of the media was adjusted to 7 with 0.01 mol/L NaOH and 5 mL portions were distributed in tubes that were plugged and au-toclaved at 121°C for 20 min. After sterilization the pH of the media was increased to 8.2 by the addition of sterile NaOH.
Sample materials and nitrifier stock culture preparation. Different samples, including differ-ent soil types, farmyard manure, aerated sewage effluent and enriched nitrifiers stock culture, were tested.
Three types of soils differing in their texture class, i.e. sand, sandy loam and clay loam, were air dried, sieved to pass a grade 2 mesh sieve and fortified with 200 ppm ammonical nitrogen as (NH4)2SO4. The moisture of the soils was adjusted to 60% of their water holding capacity (WHC), which was
kept constant through the daily compensation of evaporation losses.
Farmyard manure (organic fertilizer) obtained from the Faculty of Agriculture Farm at the Fayoum University, Fayoum, Egypt, contained about 0.3% nitrogen and 10% organic matter. Aerated sewage effluent samples were obtained from the sewage treatment station in Fayoum.
For the preparation of nitrifier stock culture, Nakos and Wolcott (1972) medium was inoculated with 5% of activated sewage effluent containing a high level of NH4-N (> 1%) to produce an enriched culture of nitrifying bacteria (ammonium and ni-trite oxidizers). To obtain the final stock culture, the original Alexander and Clark (1965) medium was inoculated with the previously enriched culture and incubated at 30°C for 24 h, then subcultured daily into new fresh medium.
RESULTS AND DISCUSSION
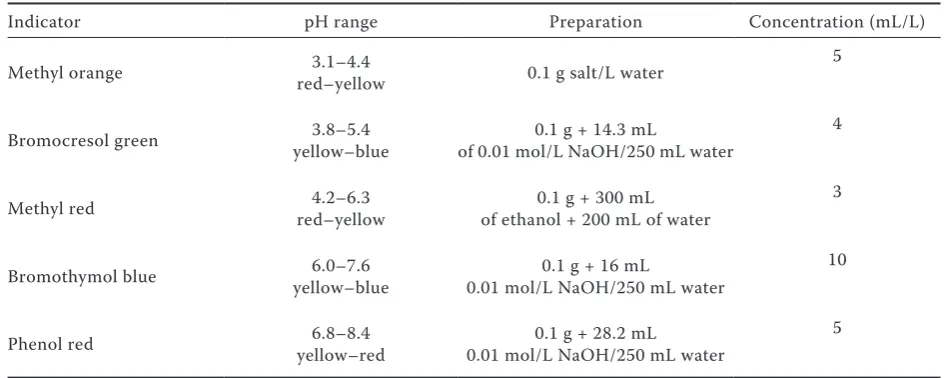
Initially a preliminary trial was applied in order to determine the most appropriate concentration of each indicator that can easily be visually dis-tinguished without ambiguity using diluted HCl as acidifier in different media. A diphenylamine sulfuric acid assay for the detection of both ni-trite and nitrate was carried out for the purpose of comparison (Table 1). An assay for nitrite only using α-naphthylamine sulfanilic acid was also performed.
Table 1 lists the results obtained with different pH indicators and their respective pH ranges. As methyl orange has a useful pH range of 3.1 to 4.4, more acid production is required to effectuate a change of color than for the other indicators, while phenol red, with a pH range of 6 to 7.6, requires the least production of acid for a positive result. The concentrations of the indicators were kept as low as possible to avoid the toxic effects of high concentration of the indicators on the autotrophic nitrifiers, while still allowing the color change to be easily observed. The appropriate concentrations of the indicators employed in this work were 5, 4, 3, 10 and 5 mL/L for MO, BCG, MR, BTB and PhR, respectively. While Sarathchandra (1979) used phenol red at a concentration of 7.5 mg/L for counting nitrifiers, in our work only 0.2 mg/L were used to avoid the toxic effects of phenol red.
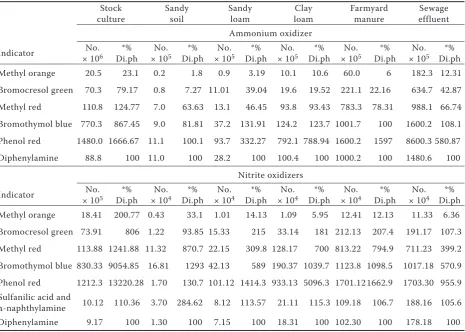
Table 2 shows the numbers of ammonium oxi-dizers determined by the classical diphenylamine method compared with the suggested method (pH indicators) using a stock culture (109 cells/mL) in
modified Alexander and Clark (1965) medium. Phenol red indicator scored the highest ammo-nium oxidizer count (1.48 × 10⁹ cells/mL, 1667%
of the result obtained with diphenylamine), which was very close to the cell density in the original inoculum (stock culture). MO gave the lowest count (2.05 × 10⁷ cell/mL, 23.1% of the
diphe-nylamine count). This result was expected as the acidity needed for phenol red to respond is very low compared to that needed in the case of MO. The count determined using the classical diphe-nylamine method was 8.88 × 10⁷ cells/mL. BCG,
MR and BTB recorded 7.03, 11.08 and 77.03 × 10⁷ cells/mL, respectively. Phenol red needed the
shortest incubation time (4–5 weeks) while methyl orange needed an incubation period of 7–8 weeks until a change of color was observed.
The same trends of ammonium oxidizercounts were observed in the different environmental sam-ples tested (soils, farmyard manure, and sewage effluent). In the case of sandy loam and clay soil, the ammonium oxidizercounts with phenol red always exceeded those of methyl orange by 7 to 10-fold and gave similar counts as those determined using the diphenylamine method. Using methyl orange as an indicator recorded 0.2, 0.9 and 10.1 × 10⁵ cells/g in sand, sandy loam and clay loam
soils, respectively, while in the case of PhR the corresponding counts were 11.1, 93.7 and 972.1 × 10⁵ cells/g, respectively. In addition, the
[image:3.595.60.536.571.760.2]detec-tion of positive tubes was possible after only 4–5 weeks in the case of phenol red as indicator, and only after 8 weeks in the case of methyl orange. The other three indicators occupied intermediate positions between these two indicators. In soils, diphenylamine showed counts very similar to those of MR and BTB. In farmyard manure, the same trends for ammonium oxidizercounts were observed as in soil samples, but counts were higher than those found in soils. Counts using MO were
Table 1. Some characteristics and preparation of indicators used
Indicator pH range Preparation Concentration (mL/L)
Methyl orange red–yellow3.1–4.4 0.1 g salt/L water 5
Bromocresol green yellow–blue3.8–5.4 of 0.01 mol/L NaOH/250 mL water0.1 g + 14.3 mL 4
Methyl red red–yellow4.2–6.3 of ethanol + 200 mL of water0.1 g + 300 mL 3
Bromothymol blue yellow–blue6.0–7.6 0.01 mol/L NaOH/250 mL water0.1 g + 16 mL 10
60 × 105 cells/g (6% of diphenylamine count) in
farmyard manure after 7 weeks of incubation and were 1600 × 105 and 1000 × 105 cells/g with PhR
and diphenylamine, respectively. Diphenylamine counts for ammonium oxidizers were very close to those with BTB. Active sewage effluent revealed higher counts, with 182, 8600 and 1480 × 105
cells/g, respectively, but positive tubes were visually recognizable after only 4–5 weeks of incubation. Using a pH meter at the end of incubation periods showed that there were no great differences be-tween the pH values determined by the indicators and those determined using the pH meter. It was noticed that in the case of some samples (soils, organic matter) lower dilutions (10–1–10–2) often
lead to high turbidity in tubes, making it difficult to observe the color change. Therefore, if the count is low and samples are turbid, the pH indicator test is not as reliable and the chemical test should be carried out. In practice, the abundance of nitrifiers in turbid samples such as soil or manure is usually high enough to require higher dilution factors, and turbidity does therefore not pose a problem.
[image:4.595.66.532.90.422.2]Table 2 illustrates the nitrite oxidizer counts (HNO2 to HNO3) obtained from different samples using the different pH and chemical indicators in the modified medium of Alexander and Clark (1965). The total nitrifier count (ammonium and nitrite oxidizers) was determined in medium con-taining (NH4)2SO4, and nitrite oxidizers alone were counted using medium containing NaNO2. The number of nitrite oxidizers was then sub-tracted from the total nitrifier count to give the ammonium oxidizer counts presented in Table 2. It was clear from the results illustrated in Table 2 that the same trends were observed for both am-monium and nitrite oxidizers. Phenol red as pH indicator scored the highest counts in all examined samples, but counts of nitrite oxidizers were al-ways less than those of ammonium oxidizers with all indicators used. Many authors reported that in nature, i.e. soils, sewage, water and balanced environment (without addition of nitrite), counts of ammonium oxidizers always exceeded those of nitrite oxidizers by an order of magnitude (Charlot 1965, Ghiorse and Alexander 1978, El-Shahawy Table 2. Ammonium oxidizer and nitrite oxidizer counts using pH indicators compared to the traditional chemi-cal method
Stock
culture Sandy soil Sandy loam loamClay Farmyard manure effluentSewage Ammonium oxidizer
Indicator × 10No. 6 Di.ph*% × 10No. 5 Di.ph*% × 10No. 5 Di.ph*% × 10No. 5 Di.ph*% × 10No. 5 Di.ph*% × 10No. 5 Di.ph*%
Methyl orange 20.5 23.1 0.2 1.8 0.9 3.19 10.1 10.6 60.0 6 182.3 12.31 Bromocresol green 70.3 79.17 0.8 7.27 11.01 39.04 19.6 19.52 221.1 22.16 634.7 42.87 Methyl red 110.8 124.77 7.0 63.63 13.1 46.45 93.8 93.43 783.3 78.31 988.1 66.74 Bromothymol blue 770.3 867.45 9.0 81.81 37.2 131.91 124.2 123.7 1001.7 100 1600.2 108.1 Phenol red 1480.0 1666.67 11.1 100.1 93.7 332.27 792.1 788.94 1600.2 1597 8600.3 580.87 Diphenylamine 88.8 100 11.0 100 28.2 100 100.4 100 1000.2 100 1480.6 100
Nitrite oxidizers
Indicator × 10No. 5 Di.ph*% × 10No. 4 Di.ph*% × 10No. 4 Di.ph*% × 10No. 4 Di.ph*% × 10No. 4 Di.ph*% × 10No. 4 Di.ph*%
Methyl orange 18.41 200.77 0.43 33.1 1.01 14.13 1.09 5.95 12.41 12.13 11.33 6.36 Bromocresol green 73.91 806 1.22 93.85 15.33 215 33.14 181 212.13 207.4 191.17 107.3 Methyl red 113.88 1241.88 11.32 870.7 22.15 309.8 128.17 700 813.22 794.9 711.23 399.2 Bromothymol blue 830.33 9054.85 16.81 1293 42.13 589 190.37 1039.7 1123.8 1098.5 1017.18 570.9 Phenol red 1212.3 13220.28 1.70 130.7 101.12 1414.3 933.13 5096.3 1701.121662.9 1703.30 955.9 Sulfanilic acid and
α-naphthylamine 10.12 110.36 3.70 284.62 8.12 113.57 21.11 115.3 109.18 106.7 188.16 105.6 Diphenylamine 9.17 100 1.30 100 7.15 100 18.31 100 102.30 100 178.18 100
*Diphenylamine (%) = Count by pH indicator × 100
and Al-Mashhady 1984). In addition, it was no-ticed that nitrite oxidizersneeded a relatively long incubation period (8 weeks) to produce sufficient nitric acid from nitrite to allow detection. This was expected because nitrite oxidizers such as
Nitrobacter are well known to be more sensitive to environmental factors than ammonium oxidiz-ers (e.g. Nitrosomonas). Similar to the chemical methods, the method presented here still requires lengthy incubation periods (weeks) due to the slow growth of nitrifying bacteria. Unlike the chemical methods, however, the acidification of the medium can be easily followed continuously by simple visual inspection, rather than through labor-intensive and potentially hazardous chemical assays. The use of pH indicators in weakly buffered medium offers the further advantage that the color change upon acidification past the pH threshold of the indicator is unambiguous; as soon as the critical pH is reached the color change is complete. Using diphenylamine for the detection of both nitrite and nitrate and sulfanilic acid α-naphthylamine for the detection of a decrease of nitrite in the counting of nitrite oxidizers yielded very similar results, confirming the validity of the methods (Table 2). Finally, it could be concluded that the use of pH indicators, especially phenol red, as proposed in this study was an accurate, sensitive and success-fully applicable method for the enumeration of nitrifiers in different environments.
Acknowledgements
The authors would like to thank Dr. Martin Krehenbrink (Oxford University, UK) for helpful revision.
REFERENCES
Alexander M., Clark F. E. (1965): Nitrifying Bacteria. In: Black C.A., Evans D.D., White J.L., Ensminger L.E., Clark F.E. (eds): Methods of Soil Analysis. Part 2. American Society of Agron-omy, Madison, 1477–1483.
Baikun L., Shannon I. (2007): The comparison of alkalinity on ORP as indicators for nitrification and denitrification in a
sequencing batch reactor (SBR). Biochemical Engineering Journal, 34: 248–255.
Bremner J.M. (1965): Inorganic forms of nitrogen. In: Black C.A. (ed): Methods of Soil Analysis – Part 2: Chemical and Micro-biological Properties, Agronomy No. 9, American Society of Agronomy Inc., Madison.
Charlot G. (1965): Colorimetric Determination of Elements. Principles and Methods. Elsevier Publishing Co., New York. Cochran W.G. (1950): Estimation of bacterial densities by means
of the ‘most probable number’. Biometrics, 6: 105–116. Degrande V., Bardin R. (1995): Detection and counting of
Nitro-bacter populations in soil by PCR. Applied and Environmental Microbiology, 61: 2093–2098.
El-Shahawy R.M., Al-Mashhady A.S. (1984): Nitrification of am-monium sulphate and urea fertilizers under saline condition. Zentralblatt für Mikrobiologie, 139: 343–347.
Finstein M.S. (1968): Enumeration of autotrophic ammonium-oxidizing bacteria in marine waters by a direct method. Applied Microbiology, 16: 1646–1649.
Ghiorse W.C., Alexander M. (1978): Nitrifying populations and the destruction of nitrogen dioxide in soil. Microbiology Ecol-ogy, 4: 233–240.
Jang A., Okabe S., Watanabe Y., Kim In S., Bishop L. (2005): Meas-urement of growth rate ammonia oxidizing bacteria in partially submerged rotating biological contactor by fluorescent in situ hybridization (FISH). Journal of Environmental Engineering and Science, 4: 413–420.
Li H., Yang M., Zhang Y., Yu T., Kamagata Y. (2006): Nitrification performance and microbial community dynamics in a sub-merged membrane bioreactor with complete sludge retention. Journal of Biotechnology, 123: 60–70.
Nakos G.G., Wolcott A.R. (1972): Bacteriostatic effect of ammo-nium on Nitrobacter agilis in mixed culture with Nitrosomonas europaea. Plant and Soil, 36: 521–527.
Pollard P.C. (2006): A quantitative measure of nitrifying bacterial growth. Water Research, 40: 1569–1576.
Sarathchandra S.U. (1979): A simplified method for estimating ammonium oxidising bacteria. Plant and Soil, 52: 305–309. Troeh R.F., Thompson L.M. (1993): Soil and Soil Fertility. Oxford
University Press, New York, 193–213.
Yapsakli K., Aliyazicioglu C., Mertoglu B. (2011): Identification and quantitative evaluation of nitrogen-converting organisms in a full-scale leachate treatment plant. Journal of Environmental Management, 92: 714–723.
Received on July 27, 2011
Corresponding author:
Dr. Khaled Elbanna, Umm Al-Qura University, Faculty of Applied Sciences, Department of Biology, Makkah, Kingdom of Saudi Arabia