Extruded Corn Flour Changed the Functionality
Behaviour of Blends
Jie ZeNg, Haiyan gao, guanglei Li and Xinhong LiaNg
School of Food Science, Henan institute of Science and Technology, Xinxiang, P.R.China
Abstract
Zeng J., Gao H., Li G., Liang X. (2011): Extruded corn flour changed the functionality behaviour of blends. Czech J. Food Sci., 29: 520–527.
Functionalities and relationships between raw and extruded maize flour blends were studied. The extruded flour had higher water absorption and water solubility indices, and had no differential scanning calorimetry endotherm. The parameters of RVA peak, breakdown, setback, and final viscosity were lowered and the parameters of cold viscosity were improved as the fraction of the extruded flour in the mixture increased. In starches from raw flour, a bimodal distribution of the chain length was found by gel permeation chromatography while in the extruded starches only one fraction was observed. The dough quality of 60% raw and 40% extruded flour mixture was found to be better than with other mixture proportions.
Keywords: functionality; corn flour; structure; dough machinability, extruded; blends
The extrusion of starch is a physical modifica-tion method involving the applicamodifica-tion of high heat and shear. The extrusion of starch granules causes changes in their morphological and molecular structures depending on several factors includ-ing the moisture content, cookinclud-ing temperature, and mechanical energy input. Starch is heated and gelatinised in excess water. Gelatinisation of starch is phase transition of starch granules from an ordered to a disordered state during heating with excess water (Babić et al. 2009). Wang et al. (1991) indicated that at least 14 water molecules per one glucose unit are necessary for complete starch gelatinisation to occur. Melting and ge-latinisation require starch conversion from the crystalline to an amorphous structure (Wang 1993). When the moisture content was < 5%, the conversion of raw starch to cooked starch occurred as a single step. A direct helix to coil transition occurred as dry starch crystallites melt to form amorphous gels at high temperatures (Waigh et al. 2000a,b). According to these researches, when
water is added from 5% up to 40% (limited water conditions), starch gelatinisation proceeds in two steps, the first one involving an amylopectin helix dislocation, and the second one a helix-coil transi-tion (melting) as amylopectin helices unwind and form amorphous gels.
Sandhu et al. (2005) compared the physico-chemical and thermal properties of starches sepa-rated from hybrid corn lines of MS and Tux pool. Sandhu and Singh (2007) indicated that the vis-cosity parameters were controlled during pasting by the properties of both the swollen granules and the soluble materials leaking from the granules. Singh et al. (2003) found that the physicochemi-cal, rheologiphysicochemi-cal, and cookie-making properties of corn and potato flour were significantly influenced by the properties of their starches.
example, tortilla chips require some degraded starch for expansion and some raw starch to sup-port bubbles formed during frying (Ozcan et al. 2005). That is, the mixture of extruded-raw starch or flour might also have a desirable or unique functionality in certain products.
The objective of our present study was to improve the functionality based on the thermal properties, pasting properties, and water solubility/absorption indeces as determined by the extruded and raw flour mixtures in foods. This will be beneficial in selecting the appropriate mixture proportions for the end use suitability.
MATERIAL AND METHODS
Material. Common maize flour, obtained from a local market in Xinxiang, P.R. China, was used as the raw material in the preparation of flour mixtures.
Preparation of flour system components. Raw flour (11.4% moisture) was used without any treat-ment.
Extruded flour: Native maize flour (water con-tent 12%) was extruded in a conical single-screw extruder (Xinming Machinery Plant, Shenyang, China) with a nozzle diameter of 5 mm and a screw speed of 160 rpm. The capacity of the extruder was 25 kg/h and L/D was 30:1. Feed, screw, and rod bar-rel temperatures were 25°C, 90–100°C, and 165°C, respectively. Extruded flour strands of 1000 g were collected under a steady-state flow rate of 1.5 m/s as reached in the extruder. The extruded sample was cooled to room temperature (final moisture content 7.2%) and ground using an analytical mill (Zhongxing weiye Instruments Co., Beijing, China).
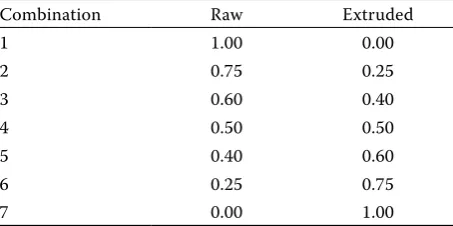
[image:2.595.64.291.642.755.2]Blends of raw and extruded flours were prepared according to the specified treatment combinations (Table 1).
Thermal properties of mixtures. The thermal characteristics of the raw flour or raw and extruded flour mixtures were studied by using a differential scanning calorimeter (DSC, TA Instruments Wa-ters, New Castle, USA), equipped with a thermal analysis data station. Starch (3.5 mg dry weight) was loaded into a 40 μl capacity aluminium pan and distilled water was added by microsyringe, to achieve a starch-water suspension containing 70% water. The samples were hermetically sealed and allowed to stand for 1 h at room temperature before heating in the DSC. The DSC analyser was calibrated using indium, an empty aluminium pan having been used as a reference. The sample pans were heated at a rate of 10°C/min from 20°C to 100°C. Thermal transition of the starch samples was defined as To (onset tem-perature), Tp(peak of gelatinisation temperature), and Tc (conclusion temperature) and Hgel, referred to the enthalpy of gelatinisation. Enthalpies were calculated on a starch dry weight basis. These were calculated automatically.
Water solubility/Absorption index. Water ab-sorption index (WAI) and Water solubility index (WSI) of flour were determined by slightly modify-ing the method of Smodify-ingh et al. (2003). The flour samples (1.5 g) were mixed with 18 ml of distilled water, using a glass rod, and cooked at 90°C for 15 min in a water bath. The cooked paste was cooled to the room temperature and transferred to centrifuge tubes and centrifuged at 3000× g for 10 minutes. WAI and WSI were calculated by using the equations as follows.
WAI = weight of sediment (1)
weight of dry solids
WSI = weight of dissolved solids in supernatant × 100 weight of dry solids (2)
Viscosity profiles (RVA) of flour mixtures. The sample (3 g) was combined with 25 ml of deionised distilled water in an aluminum cup containing a plastic paddle. The sample was stirred at 160 rpm in a Rapid Visco Analyser (RVA-Series 4, New-port Scientific Pty. Ltd., Warriewood, Australia), held at 50°C for 1 min, heated to 95°C during 3.7 min, held at 95°C for 2.5 min, cooled to 50°C during 3.8 min, and held for 2 min at 50°C. RVA parameters such as cold viscosity, peak viscos-ity, trough, peak time, pasting temperature, final viscosity, breakdown, and setback were calculated using Thermocline software (Vers. 2.3, Newport Table 1. Flour mixture ratios used in the experiment
Combination Raw Extruded
1 1.00 0.00
2 0.75 0.25
3 0.60 0.40
4 0.50 0.50
5 0.40 0.60
6 0.25 0.75
Scientific). The RVA was calibrated as specified by the manufacturer before use.
Gel permeation chromatography on Sepharose CL-2B. The starch from raw flour was isolated by a wet-milling procedure as commercial starch while the preparation of the starch from the extruded flour might refer to the separation of amylose and amylopetin. The isolated starches were purified with 0.2% sodium hydroxide (3:1, v/v) until no protein residue was present in the samples. After each treatment, the starch granules were collected by centrifugation (6000× g), and the final sediment was washed three times with distilled water and dried at 45°C.
The sample was dispersed (1% w/v) using 90% DMSO and placed in a boiling water bath for 1 h with frequent vortexing (high setting). The dis-persed sample was filtered through a 1.2-µm ny-lon filter. 1 ml of the sample was loaded onto the sepharose CL-2B column (diameter 1.0 cm × height 70 cm) eluted with 50 mmol/l sodium chloride. 3.5 ml of effluent were collected in every tube and 1 ml was aspirated to analyse the total carbohydrate and elution volume response at λ = 620 nm using the phenol-sulphuric acid method.
Dough rheological measurements. Dough machinability was assessed by texture profile analysis (TPA) performed in a TA.HDi 500 Tex-ture Analyser by using a 5 cm diameter probe, 75 s waiting period, and 60% compression as described previously (Anton et al. 2008). The primary tex-tural properties were measured in the absence of dough adhesiveness by using a plastic film on the dough surface to avoid the distortion induced by the negative peak of adhesiveness (Collar et al. 2000). Dough adhesiveness was measured separately by running a second TPA without the plastic film and disregarding the other parameters. Extensibility measurements at large deformations were performed for uniaxial (stretching) extension by using a dough/gluten extensibility rig. Uniaxial extensibility was assessed by the Kieffer dough and gluten extensibility rig developed by Stable Micro Systems (Surrey, UK) for the TA.HDi 500 texture analyser. The resistance to extension (g) and extensibility (mm) were determined in the tension mode by recording the peak force and the distance at the extension limit. The force-defor-mation curves were recalculated into stress-strain data, taking into account the changes in the sizes of the extended specimens. The fracture properties of dough were computed from the stress-strain
data. The maximum stress or fracture stress (rmax) and the Hencky strain (eH) at fracture were taken as measures of the resistance to extension and extensibility, respectively.
RESULTS AND DISCUSSION
Water solubility/absorption index
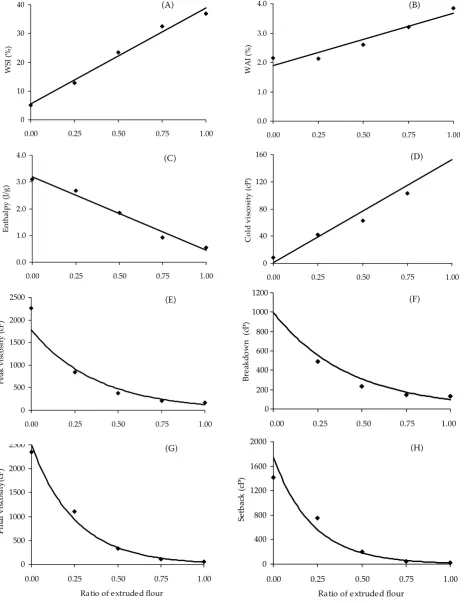
Significant linear models with the interaction describing the relationships between raw-extruded flour mixtures and both water solubility index and water absorption index were found (Figures 1A,B). Raw and extruded flours had different WSI and WAI values (Figure 1A), extruded flour solubility was very high. During extrusion, starch structures were disrupted and crystalline regions melted. After this melting process, high shear and high temperature conditions resulted in molecular fragmentation improving the solubility. For the sample extruded at 160°C (product temperature asymptotically 160–170°C) with shear, these con-ditions would be sufficient enough to gelatinise completely and melt the starch. Starch with no granular integrity is in a physically dissociated form or a fragmented form (Martínez-Bustos et al. 2007). As a result, it was reasonable that the extruded flour in this study should be highly dispersed in water giving a high WSI. The WAI at 30°C (Figure 1B) of extruded flour was also higher than that of raw flour due to the swelling of highly degraded starch (Whalen 1999).
Differential scanning calorimetry
Figure 1. Two-component mix plots for raw and extruded flour: (A) Water solubility index (% WSI) = 33.412x + 5.458
(r2 = 0.9857, P < 0.05); (B) Water absorption index (WAI) = 1.8x + 1.882 (r2 = 0.9209, P < 0.05); (C) DSC enthalpy
(J/g) = –2.7408x + 3.1868 (r2 = 0.9797, P < 0.05); (D) Cold viscosity (cP) = 151.6× + 0.8 (r2 = 0.9603, P < 0.05); (E) Peak
(cP) = 1784.2e–2.638x(r2 = 0.9483, P < 0.05); (F) Breakdown (cP) = 997.76e–2.3277x(r2 = 0.9603, P < 0.05); (G) Final (cP)
= 2495.3e–2.3277x(r2 = 0.9926, P < 0.05); (H) Setback (cP) = 1739.3e–4.5019x(r2 = 0.9869, P < 0.05)
(A) 0 10 20 30 40
0.00 0.25 0.50 0.75 1.00
Ratio of extruded flour
W SI (% ) (B) 0.0 1.0 2.0 3.0 4.0
0.00 0.25 0.50 0.75 1.00
Ratio of extrudedflour
W A I( % ) (C) 0.0 1.0 2.0 3.0 4.0
0.00 0.25 0.50 0.75 1.00
Ratio of extrudedflour
En th al py (J/ g) (D) 0 40 80 120 160
0.00 0.25 0.50 0.75 1.00
Ratio of extrudedflour
C ol d vi sc os ity (c P) (E) 0 500 1000 1500 2000 2500
0.00 0.25 0.50 0.75 1.00
Ratio of extrudedflourn
Pe ak vi sc os ity (c P) (F) 0 200 400 600 800 1000 1200
0.00 0.25 0.50 0.75 1.00
Ratio of extrudedflour
Br ea kd own (c P) (G) 0 500 1000 1500 2000 2500
0.00 0.25 0.50 0.75 1.00
Ratio of extrudedflour
Fi nal vi sc os ity (c P) (H) 0 400 800 1200 1600 2000
0.00 0.25 0.50 0.75 1.00
Ratio of extrudedflour
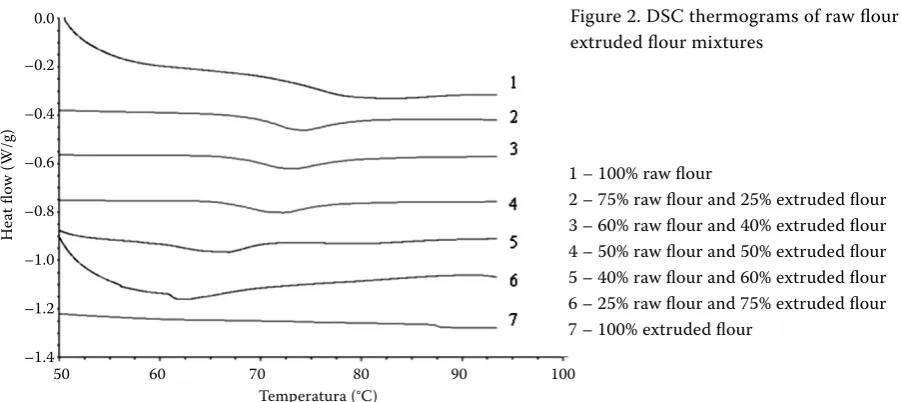
(Figure 1C) was selected for DSC enthalpy. Raw flour contributed to enthalpy values. As expected, the more raw flour in the mixture, the higher the mixture enthalpy (Table 2).
Viscosity profiles of mixtures
RVA viscosity parameters of extruded and raw flours were significantly different (Table 3). Figure 3 shows RVA profiles of raw and extruded flour mixtures. Initial cold viscosity was observed for the mixtures containing higher amounts of extruded flour (Figure 1D). This cold paste viscosity, con-firmed and supported by the extruded flour WSI and WAI values, was noted by Whalen (1999) to depend on the type and degree of starch degrada-tion. Initial viscosity formation was not observed for 100% raw flour at low temperatures (50°C).
The extruded flour had significantly reduced RVA viscosity parameters other than cold viscosity and pasting temperature relative to raw flour, which were influenced by molecular degradation during
extru-sion (Figures 1E–H). The power function models were selected for RVA cold viscosity, peak viscos-ity, and breakdown while the exponential function models for final viscosity and setback. There was a negative interaction between raw and extruded flours for all RVA parameter models. When the extruded flour fraction was smaller than 0.50, the peak viscosity, breakdown, setback, and final vis-cosity values decreased rapidly, suggesting that raw flour was responsible for the viscosity development upon cooling. RVA cold viscosity increased quickly when the extruded flour fraction was above 0.50, suggesting that the extruded flour strongly affected the viscosity behaviour of the mixture until raw flour completely gelatinised. When the extruded flour was mixed with raw flour, the extruded flour fragments might be quickly dispersed in the water covering the exterior of the raw flour granules or clogging the pores on the surface of raw flour granules. Chinnaswamy et al. (1989) indicated that extruded flour fragments might reassociate with the uncoiled amylopectin branches, partially limiting the water absorption.
1 – 100% raw flour
2 – 75% raw flour and 25% extruded flour 3 – 60% raw flour and 40% extruded flour 4 – 50% raw flour and 50% extruded flour 5 – 40% raw flour and 60% extruded flour 6 – 25% raw flour and 75% extruded flour 7 – 100% extruded flour
50 60 70 80 90 100
Temperatura (°C) 0.0
–0.2
–0.4
–0.6
–0.8
–1.0
–1.2
–1.4
H
ea
t fl
ow
(W
/g
[image:5.595.64.515.81.282.2])
Figure 2. DSC thermograms of raw flour and extruded flour mixtures
Table 2. Thermal properties of raw flour and extruded flour mixtures
Combination Start (°C) To (°C) Tp (°C) Tc (°C) ∆H (J/g)
1 71.10 72.36 79.05 90.15 3.095
2 65.06 68.74 73.84 86.70 2.679
3 63.32 67.28 73.17 84.31 2.379
4 61.77 66.16 71.94 80.15 1.841
5 59.24 60.17 66.86 72.37 1.447
6 59.27 60.71 62.85 68.58 0.9169
[image:5.595.64.532.631.757.2]There were no significant models that fitted the RVA peak time and pasting temperatures. And the pasting temperature increased with the ratio of extruded flour in the mixtures.
Gel Permeation Chromatography (GPC) by Sepharose CL-2B
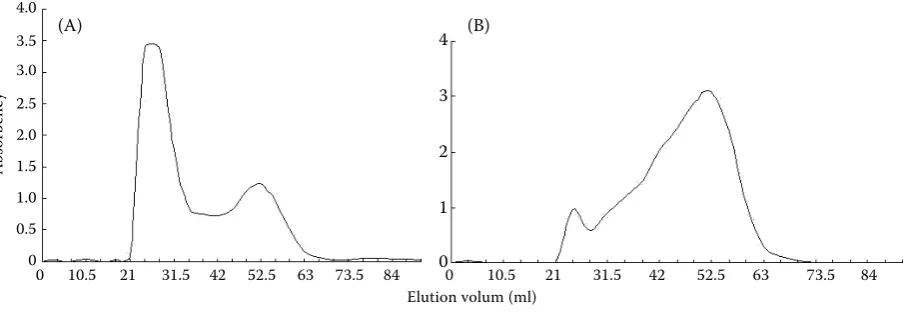
Starches from raw flours and extruded flours were eluted on the Sepharose CL-2B column. Figure 4 compares starches GPC profiles of the raw flour and the extruded flour. The elution profile of starch from raw flour revealed a bi-modal distribution named fractions I and II. The eluting volumes were 21–35 ml and 42–63 ml for fractions I and II, respectively. Obviously, the molecular weight of fraction I was higher than that of fraction II. Fraction I may be used as an index of the extent of branching in the sense that the larger the proportion of fraction II, the greater the degree of branching (Biliaderis et al. 1981);
in other words, fraction I was the characteristic peak of amylopectin while fraction II might be the mixture of amylose, amylopectin, and mid-composition between the both. Paredes-López et al. (1994) studied the fractions of amaranth, waxy maize, and commercial maize amylopectins separated by gel filtration and found a bimodal distribution of the chain lengths in all cases, with high proportions of short chains. The extruded starches only had one fraction and the eluting volume was in the range of 21–70 ml, indicat-ing that amylopectin (fraction I) degraded to a smaller size molecule (amylose-like in size) during the high shear and high temperature ex-trusion conditions. This trend was consistent with a previously conducted research (Jackson et al. 1990). These amylose-like sized molecules were not amylose, as extruded starch contained a lower percentage of amylose than raw starch because of slight amylose degradation, when measured colorimetrically using iodine binding (data not shown).
1 – 100% raw flour
2 – 75% raw flour + 25% extruded flour 3 – 60% raw flour + 40% extruded flour 4 – 50% raw flour + 50% extruded flour 5 – 40% raw flour + 60% extruded flour 6 – 25% raw flour + 75% extruded flour 7 – 100% extruded flour
1 2 3 4 5 6 7 8 9 10 11 12 13 14
Time (min) 2400
2000
1600
1200
800
400
0
Vi
sc
os
ity
(c
P)
100 90 80 70 60 50 40 30 20 10 0
Te
m
pe
ra
tu
re
(°
C
[image:6.595.63.527.81.272.2])
Figure 3. RVA profiles of raw flour and extruded flour mixtures 1
2
3 4 5 6 7
Table 3. RVA parameter of raw flour and extruded flour mixtures
Combination Cold (cP) Peak (cP) Trough (cP) Breakdown (cP) Final (cP) Setback (cP) Peak time (min) temperature (°C)Pasting
1 8 2266 933 1333 2352 1419 4.67 71.95
2 42 838 348 490 1100 752 4.40 72.00
3 51 529 204 325 565 361 4.00 72.95
4 63 374 141 233 338 197 3.87 74.50
5 76 292 105 187 219 114 3.80 76.85
6 103 206 62 144 111 49 3.67 77.60
[image:6.595.64.540.613.756.2]Dough rheological measurements
In view of food quality, textural parameters, especially extension and adhesiveness, are im-portant for corn. Adhesiveness or stickiness was related to the amount of extruded flour. The vis-cosity of extruded flour enriched with cold paste was found to be better than with raw flour which was less sticky and gluten-free dough formed. However, gluten-free dough could not be formed with a lack or an excess of extruded flour due to a low or a high adhesiveness (Kim & Tanhehco 2006). Our test showed the TPA parameters such as the resistance to extension, extensibility, ad-hesive force, and adad-hesiveness of 60% raw flour and 40% extruded flour mixtures, and the values were 32.45 g, 37.52 mm, 11.64 g, and 11.64 g·s, respectively.
CONCLUSION
Water solubility index and water absorption index of extruded flour were higher than those of raw flour due to molecular fragmentation during the high shear and high temperature extrusion condi-tions and due to the swelling of highly degraded starch, respectively. There was nearly no DSC endotherm peak observed for the 100% extruded flour. Raw flour was the only component affect-ing DSC start, onset, peak, end temperatures, and enthalpy. As the raw flour fraction increased in the mixture, the mixture enthalpy increased, and as the extruded flour fraction increased up to 75%, the mixture enthalpy decreased to as little
as 0.9169 J/g. Although an initial RVA cold paste viscosity was observed for the extruded flour, the extruded flour interacted with the raw flour decreasing the RVA viscosity profile values. The GPC elution profile of the starch from raw flour revealed a bimodal distribution while extruded starches demonstrated only one fraction. The extruded flour with increased cold paste viscosity was found to be better than raw flour which was less sticky, and a gluten-free dough formed with raw and extruded mixtures. Blends of raw and extruded flours can contribute different func-tionalities to food systems; our study can aid in developing or improving products with desired functionalities.
Reference
Anton A.A., Ross K.A., Lukow O.M., Fulcher R.G., Arntfield S.D. (2008): Influence of added bean flour (Phaseolus vulgaris L.) on some physical and nutritional properties of wheat flour tortillas. Food Chemistry, 109: 33–41.
Babić J., Šubarić D., Miličević B., Ačkar D., Kopjar M., Tiban N.N. (2009): Influence of trehalose, glucose, fructose, and sucrose on gelatinisation and retrograda-tion of corn and tapioca starches. Czech Journal of Food Sciences, 27: 151–157.
Biliaderis C.G., Grant D.R., Vose J.R. (1981): Structural characterization of legume starches. Studiex on amylose, amylopectin, and beta-limit dextrins. Cereal Chemistry,
58: 496–504.
Chinnaswamy R., Hanna M.A., Zobel H.F. (1989): Microstructural, physiochemical, and macromolecular
4.0 3.5 3.0 2.5 2.0 1.5 1.0 0.5 0
A
bs
or
be
nc
y
(A) (B)
4
3
2
1
0
0 10.5 21 31.5 42 52.5 63 73.5 84 0 10.5 21 31.5 42 52.5 63 73.5 84
[image:7.595.77.532.84.240.2]Elution volum (ml)
changes in extrusion-cooked and retrograded maize starch. Cereal Foods World, 34: 415–423.
Collar C., Martínez J.C., Andreu P., Armero E. (2000): Effects of enzyme association on bread dough perform-ance. A response surface analysis. Food Science and Technology International, 6: 217–226.
Jackson D.S., Gomez M.H., Waniska R.D., Rooney L.W. (1990): Effects of single-screw extrusion cooking on starch as measured by aqueous high performance size exclusion chromatography. Cereal Chemistry, 67: 529–532. Kim J.H., Tanhehco E.J. (2006): Effect of extrusion
con-ditions on resistant starch formation from pastry wheat flour. FoodChemistry, 99: 718–723.
Martínez-Bustos F., López-Soto M., Martin-Mar-tínez E.S., Zazueta-Morales J.J., Velez-Medina J.J. (2007): Effects of high energy milling on some functional properties of jicama starch (Pachyrrhizus erosus L. Urban) and cassava starch (Manihot esculenta Crantz).Journal of Food Engineering, 78: 1212–1220.
Ozcan S., Jackson D.S. (2005): Functionality behavior of raw and extruded corn starch mixtures. Cereal Chemistry,
82: 223–225.
Paredes-López O., Bello-Pérez L.A., López M.G. (1994): Amylopectin: Structural, gelatinisation and retrograda-tion studies. Food Chemistry, 50: 411–417.
Sandhu K.S., Singh N., Malh N.S.I. (2005): Some prop-erties of corn grains and their flours I: Physicochemical,
functional and chapati-making properties of flours. Food Chemistry, 101: 938–946.
Sandhu K.S., Singh N. (2007): Some properties of corn starches II: Physicochemical, gelatinization, retrograda-tion, pasting and gel textural properties. Food Chemistry,
101: 1499–1507.
Singh J., Singh N., Sharmat.R., Saxena S.K. (2003): Physicochemical, rheological and cookie making prop-erties of corn and potato flours. Food Chemistry, 83: 387–393.
Waigh T.A., Kato K.L., Donald A.M., Gidley M.J., Clarke C.J., Riekel C. (2000a): Side-chain liquid-crys-talline model for starch. Starch, 52: 450–460.
Waigh T.A., Gidley M.J., Komanshek B.U., Donald A.M. (2000b): The phase transformations in starch during ge-latinization: A liquid crystalline approach. Carbohydrate Research, 328: 165–176.
Wang S.S. (1993): Gelatinization and melting of starch and tribochemistry in extrusion. Starch, 45: 388–390. Wang S.S., Chiang W.C., Zhao B., Zheng X., Kirn I.H.
(1991): Experimental analysis and computer simulation of starch-water interactions during phase transition. Journal of Food Science, 56: 121–124.
Whalen P.J. (1999): Measuring process effects in ready-to-eat breakfast cereals. Cereal Foods World, 44: 407–412.
Received for publication January 15, 2010 Accepted after corrections December 8, 2010
Corresponding author: