SREBF1 (sterol regulatory element-binding tran-scription factor 1) is a member of the basic he-lix-loop-helix leucine zipper (bHLH-LZ) family of transcription factors. It has also been termed sterol regulatory element-binding protein 1 (SREBP1). SREBF1 is highly expressed in fat and liver, and its mRNA is induced at the early stage of adipocyte differentiation (Kim et al., 1998). SREBF1 plays important roles in adipocyte differentiation and regulation of lipogenesis (Tontonoz et al., 1993). The overexpression of SREBF1 in fibroblasts (Kim and Spiegelman, 1996) or in the liver of transgenic mice induces lipoprotein lipase and fatty acid syn-thase. SREBF1 is involved in the control of energy metabolism in the human adipose tissue (Ribot et al., 2001) and appears to be a key link between cho-lesterol and triglyceride metabolism, adipogenesis as well as insulin sensitivity (Cho et al., 2004).
Efficient production of good-quality pig meat may be obtained by reducing the total fat amounts while fat depots important for meat quality are kept at optimum levels. The aim of this experiment was to determine the pattern of SREBF1 gene
expres-sion in different growth stages and the relation with adipose deposition to supply a clue to regulate meat production quality.
MATERIAL AND METHODS
Animals
In total fifteen female Duroc × Landrace × Yorkshire pigs infive groups, each group of three animals, at live weight 1, 30, 50, 70 and 90 kg were euthanized under anaesthesia and exsanguinated after 12 h fasting and ad libitum access to water. The subcutaneous adipose tissues were quickly dis-sected and frozen in liquid nitrogen, then stored at –70°C until extraction for the total RNA. Left half-carcasses without head, legs and guts (except kidney) were weighed. Subcutaneous, ventral and mesentery adipose tissues in the left half-carcass were dissected and weighed; the fat deposi-tion rates were calculated. All the animal ex-periments were done according to the guidelines of
The pattern of development for gene expression
of
sterol regulatory element binding transcription
factor 1 in pigs
J. Jiang, Z. Xu, X. Han, F. Wang, L. Wang
Feed Science Institute, Zhejiang University, Hangzhou, China
ABSTRACT: Sterol regulatory element-binding transcription factor 1 (SREBF1) has been implicated as a key regu-lator of adipocyte differentiation and lipid metabolism. The pattern of SREBF1 gene expression in different growth stages and the relation with adipose deposition is studied. Fifteen female Duroc × Landrace × Yorkshire pigs in five groups, each group of three pigs at live weight 1, 30, 50, 70 and 90 kg, were used to study the developmental gene expression of SREBF1 in the subcutaneous adipose tissue by means of semi-quantitative RT-PCR. The results showed that porcine SREBF1 mRNA was present in a very low concentration at birth and continually increased to the highest expression at 90 kg growth stages, SREBF1 mRNA levels increased as pigs grew and deposited fat from 1 to 90 kg live weights (P < 0.05). The present data indicated a close positive correlation between the levels of SREBF1 gene expression and the fat deposition rate in pigs (P < 0.05).
the National Institute of Animal Health for animal experiments.
Extraction of RNA
Total RNA from porcine tissues was isolated us-ing TRIzol Reagent (Gibco BRL) as described by the manufacturer (Sigma, USA). Extracted RNA was resuspended in 30 μl ultra-pure water. The purity and concentration of RNA were checked using a spectrophotometer at 260 and 280 nm.
cDNA cloning
The synthesis of first strand cDNA was performed using Reverse Transcription System kit (First Strand cDNA-synthesis Kit, Promega, USA) as described by the manufacturer with oligodT-primer and using approximately 1 μg of total RNA as template.
PCR
The reverse-transcribed cDNA was amplified with Taq DNA polymerase (Promega, USA) by a polymerase chain reaction (PCR) in a thermo-cycler (Gene Amp PCR System 9600, Pharmacia, Japan) using paired sense and antisense primers (SREBF1: S: 5’-AAGCGGACGGCTCACAATG-3’; A: 5’-GCTTGCGATGCCTCCAGAA-3’. ACTB: S:5’-GGAGATCGTGCGGGACAT-3’; A:5’-GTTGAAGGTGGTCTCGTGG AT-3’). The product size for SREBF1 gene is 365 bp, for ACTB gene it is 318 bp. Primer sequences for SREBF1 and ACTB encoding for β-actin were designed on the basis of known sequences deposited in Genebank (AY307771, NT005058). The conditions for PCR for SREBF1 were as follows: denaturation at 94°C for 2 min, followed by 31 cycles of amplification at 94°C for 50 s, 57°C for 50 s, and 72°C for 1 min, and followed by final extension at 72°C for 10 min. The conditions for PCR for ACTB were as follows: denaturation at 94°C for 2 min, followed by 31 cy-cles of amplification at 94°C for 50 s, 53°C for 50 s, and 72°C for 1 min, and followed by final extension at 72°C for 10 minutes.
DNA sequencing
The PCR products were electrophoresed on 1% (w/v) agarose gel and selected electrophoresis bands were collected, then the gel was purified us-ing QIAquick Gel Extraction Kit (QIAGEN). The
purified amplified products were directly ligated into pGEM-T Easy Vector (Promega, USA) and trans-formed into E. coli JM109. Plasmids were then iso-lated and purified for DNA sequencing using Wizard Miniprep Kit (Promega, USA). The sequencing of the inserts was performed using ABI PRISM Dye Terminator Kit (Perkin Elmer) and analysed on ABI PRISM 310 Genetic Analyser (Perkin Elmer).
Sequence analysis
The BLAST sequence analysis program (http:// www.ncbi.nlm.nih.gov//BLAST) was used for ini-tial comparisons of the sequence of PCR prod-ucts obtained with sequences deposited in the GeneBank. Amplified DNA was 99% homologous to the known sequence of SREBF1 and ACTB de-posited in GeneBank.
mRNA expression analysis
The expression of pig SREBF1 mRNA was deter-mined by semi-quantitative RT-PCR (Kousteni et al., 1999) using the housekeeping gene ACTB as internal control. The PCR products were electrophoresed on 1% (w/v) agarose gel. Electrophoresis band intensi-ties of the PCR products were quantified by NIH Image Version 1.62 software (Pharmacia, Japan).
Data analysis
All the data were analyzed using the ANOVA procedure (SAS Institute, 1989) and the treatment means were compared by Duncan’s multiple range test. Statistical significance was at P < 0.05 for all statistical tests.
RESULTS
Developmental patterns of SREBF1 gene expression
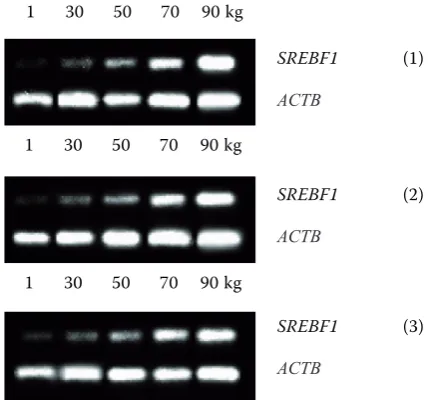
70 and 90 kg. As shown in Figure 2, the SREBF1 gene expression was weight-dependent in the porcine adi-pose tissue. SREBF1 mRNA was present at a very low concentration at birth, the relative quantity of SREBF1 mRNA (SREBF1/ACTB) steadily increased from 0.05, 0.19, 0.36, 0.55 to 0.91 as pigs grew (P < 0.05). The highest expression of SREBF1 mRNA was observed in the heaviest animals (90 kg).
Developmental pattern of fat deposition
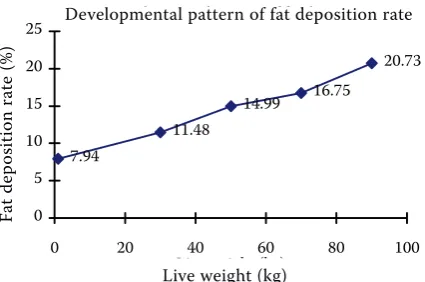
Table 1 shows that fat (subcutaneous, ventral and mesentery adipose tissues) deposition rates were 7.94%, 11.48%, 14.99%, 16.75%, 20.73%, re-spectively, at different growth stages of 1, 30, 50, 70, 90 kg live weight in pigs. The ratio increased significantly from 1 to 90 kg (P < 0.01). Table 1
also shows that the weight of subcutaneous adipose tissue, ventral adipose tissue and mesentery adi-pose tissue at different stages of pig growth and the weight of three adipose tissues increased signifi-cantly with live weights from 1 to 90 kg (P < 0.01), and the percentage of subcutaneous adipose in-creased with live weight.
The relation between SREBF1gene expression and fat deposition
[image:3.595.73.291.83.283.2]Figure 2 and 3 show that the SREBF1 mRNA levels increased as fat deposited from 1 to 90 kg growth stages (P < 0.05). Correlation analysis showed that there was a positive correlation between the levels of SREBF1 gene expression and the fat deposition rate (r = 0.89, P < 0.05) from 1 to 90 kg growth stages in pigs.
Table 1. Developmental pattern of adipose deposition (mean ± SD)
Body weight (kg)
Subcutaneous adipose (kg)
Ventral adipose (kg)
Mesentery adipose (kg)
Fat deposition rate (%)
1 0.031a ± 0.017 0.003a ± 0.001 0.028a ± 0.002 7.94a ± 0.75
30 1.236b ± 0.036 0.042a ± 0.002 0.395b ± 0.043 11.48b ± 0.23
50 3.890c ± 0.053 0.254b ± 0.124 0.605c ± 0.099 14.99c ± 0.43
70 6.661d ± 0.536 0.344c ± 0.068 1.029d ± 0.059 16.75d ± 1.13
90 11.12e ± 0.308 0.920c ± 0.076 1.798e ± 0.226 20.72e ± 0.57
Means within a column with different superscripts are significantly different (P < 0.05)
Figure 1. Electrophoresis of RT-PCR products for
SREBF1 and ACTBgenes in the subcutaneous adipose tissue of pigsweighing 1, 30, 50, 70 and 90 kg. (1), (2), (3): The products from the first pig, the second pig and the third pig in each weight group respectively
Developmemtal pattern of SREBF1 gene expression 0.91
0.55 0.36
0.19 0.05
0.0 0.2 0.4 0.6 0.8 1.0
0 20 40 60 80 100
Live weight (kg)
S
RE
BF1
/A
C
TB
Figure 2. The pattern of SREBF1 mRNA levels in the subcutaneous adipose tissue of pigs weighing 1, 30, 50, 70 and 90 kg. The data show the mean mRNA level of three pigs in each weight group as the ratio of the band intensity of each PCR product to the corresponding
ACTB PCR product
SREBF1
SR
EB
F1
/A
C
TB
1 30 50 70 90 kg
SREBF1 (1)
ACTB
1 30 50 70 90 kg 1 30 50 70 90 kg
SREBF1 (3)
ACTB
SREBF1 (2)
[image:3.595.307.526.100.262.2] [image:3.595.62.539.631.732.2]DISCUSSION
Developmental pattern of SREBF1gene expression
This study found that SREBF1 mRNA was present at birth in a very low concentration (only 5.49% of that at the stage of 90 kg live weight) while the rela-tive quantity of SREBF1 mRNA (SREBF1/ACTB) steadily increased to the highest value at 90 kg live weight as pigs grew. Ding et al. (1999) also found that the porcine SREBF1 transcript was at a very low concentration at birth and continually increased during postnatal development to reach its the highest value at 28 days in the postnatal pig. Transcripts of SREBF1 were reported to be present at substantial levels in preadipocytes of the 3T3-F442A and 10T1/2 clonal cell lines and in-creased many times after differentiation (Tontonoz et al., 1993). At day 0, the transcripts for porcine SREBF1 were at the same concentration as at day 10.The transcript concentration doubled by day 2, and reached a plateau at 4–7 days of differen-tiation over the 9–10 days period of porcine S/V cell differentiation in vitro (Ding et al. 1999). In contrast, another report (Kim and Spiegelman, 1996) indicated very low SREBF1 transcript levels at confluence in both 3T3-L1 and 3T3-F442A cells; the transcript increased markedly in both clonal cell lines at 1 day after addition of differentiation medium. Presumably, subtle differences in experi-mental details, including the culture conditions, led to differences in the pattern of SREBF1 transcript expression, even when using the same cell lines. Rat S/V cells had very low concentrations of the SREBF1 transcripts before addition of
differentia-tion medium, with a several-fold increase after 1 day and 10-fold increase after 3 or 5 days of differentia-tion (Hansen et al., 1998).
Developmental pattern of fat deposition
The weight of total adipose tissue increased significantly (P < 0.01), the fat deposition rate in-creased significantly from 1, 30, 50, 70 to 90 kg growth stages in pigs (P < 0.01). The results in-dicated that the capacity of adipose deposition in pigs increased as pigs grew. Wang and Shao (1989) reported that the fat percentage increased signifi-cantly with the increase of weight in commercial lean pigs. The study of Souza et al. (2004) showed that the fat content of the carcass was significantly correlated (P < 0.001) with animal age.
The subcutaneous adipose tissue had the highest proportion out of the three adipose tissues in each growth stage in this study. This is in accordance with Kolstad (2001), who found that the subcuta-neous fat depot was the dominating fat depot at all stages of 10, 25, 50, 85 and 105 kg live weight, containing more than a half of total body fat.
The relation between SREBF1 gene expression and fat deposition
SREBF1, which has important roles in adipocyte differentiation, plays also a key role in lipogenesis. This study showed that there was a positive correla-tion between the levels of SREBF1 gene expression and the fat deposition rate. SREBF1 mRNA levels increased as fat deposited from 1 to 90 kg growth stages in pigs. Ribot et al. (2001) reported that the SREBF1 mRNA levels of adipose tissue were lower in the weight-loss group than in controls by 28%.
The mechanism by which SREBF1 regulates lipo-genesis is not clear, and several reports showed partly the mechanism from different aspects. Using the adenovirus-mediated transfection of a powerful dominant negative form of SREBF1 in rat hepato-cytes, Foretz et al. (1999) demonstrated that this factor was absolutely necessary for the stimulation of gene expression of L-pyruvate kinase, fatty acid synthase, S14 (thyroid hormone-inducible hepatic protein), and acetyl coenzyme A carboxylase by glucose. These results demonstrate that SREBF1 plays a crucial role in mediating the expression of lipogenic genes induced by glucose and insulin.
The promoters for both leptin and fatty acid synthase are transactivated by SREBF1 (Kim et al., Developmental pattern of fat deposition rate
7.94
11.48
14.99 16.75
20.73
0 5 10 15 20 25
0 20 40 60 80 100
Live weight (kg)
Fa
t D
ep
os
iti
on
ra
te
(%
[image:4.595.71.284.87.228.2])
Figure 3. The pattern of fat deposition rate of pigs weigh-ing 1, 30, 50, 70 and 90 kg. The data show the mean of fat deposition rates of three pigs in each weight group
Fa
t d
ep
os
iti
on
r
at
e
(%
)
Developmental pattern of fat deposition rate
1998). A mutation in the basic domain of SREBF1 that allows E-box binding but destroys sterol reg-ulatory element-1 binding prevents leptin gene transactivation but has no effect on the increase in FAS promoter function. Molecular dissection of the FAS promoter shows that most if not all of this action of SREBF1 is through an E-box motif at –64 to –59, contained with a sequence identified previously as the major insulin response element of this gene. These results indicate that SREBF1 is a key transcription factor linking changes in the nutritional status and insulin levels to the expres-sion of certain genes that regulate systemic energy metabolism.
Acknowledgements
We thank Prof. Weifeng Li for methods counsel-ling, Dr. Ningying Xu for statistical counselcounsel-ling, Feng Wang, Yinghua Shi, Xianghua Yan for their as-sistance. The China National Research Foundation is acknowledged for financial support.
REFERENCES
Cho H.J., ParkJ., Lee H.W., Lee Y.S., Kim J.B. (2004):
Regulation of adipocyte differentiation and insulin ac-tion with rapamycin. Biochem. Biophys. Res. Com-mun., 321, 942–948.
Ding S-T., McNeel R.L., Mersmann H.J. (1999): Expres-sion of porcine adipocyte transcripts: tissue distribu-tion and differentiadistribu-tion in vitro and in vivo. Comp. Biochem. Physiol., 123B, 307–318.
Foretz M., Pacot C., Dugail I., Lemarchand P., Guichard C., Le Liepvre X., Berthelier-Lubrano C., Spiegelman B., Kim J.B., Ferre P. (1999): ADD1/SREBP-1c is re-quired in the activation of hepatic lipogenic gene ex-pression by glucose. Cell. Mol. Biol., 19, 3760–3768. Hansen L.H., Madsen B., Teisner B., Nielsen J.H.,
Bille-strup N. (1998): Characterization of the inhibitory
ef-fect of growth hormone on primary preadipocyte differentiation. Mol. Endocrinol., 12, 1140–1149. Kim J.B., Spiegelman B.M. (1996): ADD1/SREBP1
pro-motes adipocyte differentiation and gene expression linked to fatty acid metabolism. Genes Dev., 10, 1096– 1107.
Kim J.B., Sarraf P., Wright M., Yao K.M., Mueller E., Solanes G., Lowell B.B., Spiegelman B.M. (1998): Nu-tritional and insulin regulation of fatty acid synthetase and leptin gene expression through ADD1/SREBP1. J. Clin. Invest., 101, 1–9.
Kolstad. K. (2001): Fat deposition and distribution meas-ured by computer tomography in three genetic groups of pigs. Livest. Prod. Sci., 67, 281–292.
Kousteni S., Tura-Kockar F., Ramji D.P. (1999): Sequence and expression analysis of a novel Xenpus laevis cDNA that encodes a protein similar to bacterial and chloro-plast ribosomal protein L24. Gene, 235, 13–18. Ribot J., Rantala M., Kesaniemi Y.A., Palou A., Savolainen
M.J. (2001): Weight loss reduces expression of
SREBP1c/ADD1 and PPAR gamma 2 in adipose tissue of obese women. Pflug. Arch. Eur. Physiol., 441, 498– 505.
SAS (1989): SAS Institute Inc. SAS User’s Guide, Version 6, 4th ed. Cary, NC, SAS Institute. Vol. 2.
Souza D.N, Pethick D.W., Dunshea F.R., Suster D., Pluske J.R., Mullan B.P. (2004): The pattern of fat and lean muscle tissue deposition differs in the different pork primal cuts of female pigs during the finisher growth phase. Livest. Prod. Sci., 91, 1–8.
Tontonoz P., Kim J.B., Graves R.A., Spiegelman B.M. (1993): ADD1: a novel helix-loop-helix transcription factor associated with adipocyte determination and differentiation, Mol. Cell. Biol., 13, 4753–4759. Wang B.L., Shao J.B. (1989): The research on the growth
developmental law in the commercial lean pigs. Ning Xia Agr. Ind. Technol., 10, 34–38.
Received: 2005–09–19 Accepted after corrections: 2006–01–27
Corresponding Author