Macro-economic conditions and the entrepreneurial environment for agricultural undertakings have been im-proving year after year. The gross domestic product has increased, the unemployment rate has decreased, and higher real wages have led to an improvement in the ac-tual demand for agricultural raw materials and food. High-er demand has been influenced by the growth of agrarian exports and a decrease in the deficit balance of agricul-tural foreign trade. Lower interest rates have produced a resumption of interest in investing. The economic situa-tion of farms was affected adversely by natural condisitua-tions with an extremely dry spring in the year 2000 and extreme-ly rainy weather during harvest. The strengthening econ-omy of farms was also affected by internal conditions consisting of the virtual termination of restitution claims and progress in the process of state farm privatisation. The unfinished problem of transformation shares still remains to be resolved. The great economic problem for farms has been their long-term low profitability.
Permanent pressure on production profitability on the one hand and a still adverse economic situation in the farms on the other hand has also evoked a series of important measures, the most marked being: the lowering of the num-ber of agricultural workers, restrictions on investments, the related rationalisation of the acquisition of tangible assets and a drop in gross agricultural production.
The number of farm workers at the end the period in question was 168 000, which represents an annual de-crease of agricultural labourers of 8.2%. The volume of investment in agriculture decreased 2.4% and its value was 9 897 million CZK in the year 2000. The reason seemed to be the adverse financial situation in agricultural enter-prises and restrictions on investments from SGAFF. The volume of gross agricultural production in constant prices for the year 1999 decreased to 95.5% of the previous years total and thus changed the current trend of slow growth. The hoped for diversification of production in agricultural enterprises has not occurred.
An evaluation of the types of technical development in agriculture
in the years 19952000
Hodnocení typu technického rozvoje v zemìdìlství v letech 19952000
F. STØELEÈEK, J. LOSOSOVÁ
University of South Bohemia, Èeské Budìjovice, Czech Republic
Abstract: This article is divided into four parts; the first is concerned with the methodology of evaluation of the type of technical development and its objectives. Another part will evaluate the type of technical development in the national economy as a whole in the period 1995–1999. The main indicators are fund efficiency, productivity of labour and the technical specifications of work. The third part of the contribution will deal with an evaluation of these indicators in the selected sector of the economy, namely in the farms which are obliged to make public their income statements in the business bulletin. The last part, considered from the perspective of the type of technical development will be a farm sample, divided according to size into two groups - production and marginal area. This sample will be considered for the years 1997–2000. Finally a total evaluation of the present development of single monitored groups and an inter group comparison will be carried out.
Keywords: marginal areas, production areas, fund efficiency, productivity of labour, average registration number of labourers, operation, average state of tangible assets, technical specifications of work
Abstrakt: Pøíspìvek je rozdìlen do ètyø èástí, z nich první èást se zabývá metodikou hodnocení typu technického rozvoje a jeho cíly. V dalí èásti je hodnocen typ technického rozvoje v národním hospodáøství jako celku a to v období 19951999. Hlavními sledovanými ukazateli jsou fondová úèinnost, produktivita práce a technické vybavení práce. Tøetí èást pøíspìv-ku se zabývá hodnocením tìchto ukazatelù ve vybraných odvìtvích národního hospodáøství a to u podnikù, které jsou povinny zveøejòovat výsledovku v Obchodním vìstníku. Jako poslední je posuzován z hlediska typu technického rozvoje výbìrový soubor zemìdìlských podnikù, který je rozdìlen podle nadmoøské výky do dvou skupin, na produkèní a margi-nální oblast. Tento soubor je posuzován v letech 19972000. Na závìr je provedeno celkové zhodnocení dosavadního vý-voje jednotlivých sledovaných skupin a jejich vzájemné porovnání.
Klíèová slova: marginální oblasti, produkèní oblasti, fondová úèinnost, produktivita práce, prùmìrný evidenèní poèet pracovníkù, výkony, prùmìrný stav investièního majetku, technické vybavení práce
It is evident, that these changes will not only have a substantial influence on total net income of agricultural enterprises, but also on the main efficiency factors of the manufacturing process, that is; on the productivity of labour, fund efficiency and agricultural technical devel-opment. Therefore let us try to describe the global influ-ence of economic conditions on these indicators in the last years according to a farm sample prepared with the cooperation of the Chamber of Agriculture CR.
METHODOLOGY OF VALUATION OF TECHNICAL DEVELOPMENT
Satisfactory attention to valuation of technical devel-opment, i. e. the relation between tangible assets and firm revenues, has not been paid either in economic theory or in practice. An investment efficiency check will general-ly be carried out before realization of the investment goals, and for several years after investment. The aim of this check is the evaluation of existing investment. The aim of an evaluation of technical development is a check of the proportional development between the develop-ment of tangible assets volume, average registration number of labourers and the volume of farm operations. The relation between production volume and tangible assets we generally name fund efficiency and express as the formula
Fu = V : HIM
where:
Fu = fund efficiency,
V = annual operation volume, HIM = average tangible assets state.
Output and tangible assets on the right side of the for-mula divided the average number of labourers, fund effi-ciency can be expressed as
Fu = v : T (vp)
where:
v = productivity of labour, T(vp) = technical work equipment
The type of technical development can be expressed by means of an index of fund efficiency (Fu). Should the index of fund efficiency be equal to one ((Fu) = 1), then we talk about the neutral type of technical development. If the operation index is growing as fast as the index of tangible assets, and fund efficiency stays unchanged, it is extensive development. If the index of fund efficiency is greater than one ((Fu ) > 1), it is a fund- saving type of technical development. The tangible assets volume is growing with regard to output volume underproportion-ally. Consequently the relative saving of tangible assets and other relative savings resulting from it are realized. If
Table 1. Types of technical development and derived development of separated characteristics
Version Relation Characteristic
1 iFu = iv = 1 Fund neutral type of technical development, unchangeable fund efficiency. Unchangeable productivity of labour. Unchangeable technical equipment of work.
2iv > iFu = 1 Fund neutral type of technical development, unchangeable fund efficiency. Growing productivity of labour. Growing technical equipment of work.
3 iv < iFu = 1 Fund neutral type of technical development, unchangeable fund efficiency. Decreasing productivity of labour. Decreasing technical equipment of work.
4 iFu < 1 < iv Fund-saving type of technical development, decreasing fund efficiency. Growing productivity of labour. Growing technical equipment of work.
5 iFu < 1 = iv Fund-saving type of technical development, decreasing fund efficiency. Constant productivity of labour. Growing technical equipment of work.
6 iFu < iv < 1 Fund-saving type of technical development, decreasing fund efficiency. Decreasing productivity of labour. Growing technical equipment of work.
7 iFu = iv < 1 Fund-saving type of technical development, decreasing fund efficiency. Decreasing productivity of labour. Constant technical equipment of work.
8 iv < iFu < 1 Fund-saving type of technical development, decreasing fund efficiency. Decreasing productivity of labour. Decreasing technical equipment of work.
9 iv < 1 < iFu Fund-saving type of technical development, growing fund efficiency. Decreasing productivity of labour. Decreasing technical equipment of work.
10 iv < 1 < iFu Fund-saving type of technical development, growing fund efficiency. Constant productivity of labour. Decreasing technical equipment of work.
11 1 < iv < iFu Fund-saving type of technical development, growing fund efficiency. Growing productivity of labour. Decreasing technical equipment of work.
121 < iv = iFu Fund-saving type of technical development, growing fund efficiency. Growing productivity of labour. Constant technical equipment of work.
the index of fund efficiency is less than one ((Fu) < 1), a fund-saving type of technical development is realized, which leads to the relative overfulfilment of tangible as-sets and other consequential indicators. It is possible to combine the type of technical development with differ-ent dynamics of productivity of labour. Thirteen qualita-tively different variations of the type of technical development will arise. Their identification together with resulting consequences are shown in Table 1.
EVALUATION OF TECHNICAL PROGRESS IN THE ECONOMY AS WHOLE
An evaluation of the type of technical development in the various sectors of the national economy has been set up by the very dynamic combination of gross investment and an economically active population in the national economy in the Czech Republic.
The average number of workers in the national econo-my has recorded three different development waves since the year 1990 (Table 2).
The first wave, which is characterized by a drop in the average number of workers, covers the period 19901993. At the beginning of the period, the average number of workers was 5.351 million and the economically active population share of the total number of inhabitants was 52.8%. A steady drop in that period reduced the number of workers to about 5.03 million and to 4.848 million in the year 1993.
In contrast, the second period, 19941996, shows growth. The year 1996 produced the second highest number of workers at 5.044 million persons and the aver-age increase is 65.3 thousand workers in that period.
The third period, 19971999, represents again a steady drop. The number of workers was 4.693 in the year 1999 and in comparison with the year 1990 it had decreased by 658 thousand persons.
By comparing the index of average number of workers in years 19901999 its value is i99/90 = 87.70% and
aver-age annual drop rate of number of workers is 98.69%.
Gross investments in the national economy in current prices were increased steadily in the period 19901997. Since that time they have decreased. In 1990, gross in-vestments represented 134.3 millliard CZK, in 1997, 638.8 milliard CZK and in 1999 523.3 milliard CZK. The index (1999/1990) was 388.49% and the average growth rate 114.53% (Table 2).
It is true that part of these increases in investments has been connected with the reclassification of the national economy, but it is necessary to constantly monitor the interdependence between the volume of tangible assets and operation, and thereby evaluate the adequacy and effect of these parameters.
The gross investments share in fixed assets had a ten-dency to grow in the years 19951997 (index 1997/1995 = 116.1%) and since that time it has been decreasing (index 1999/1997 = 63.2%). The second period decrease had been influenced by a total decrease since 1995 (index 1999/1995 = 73.4%).
The gross investments share in GDP also has its cul-mination point in 1997. Until 1997 the gross investments share of GDP had been increasing steadily (index 1997/ 1995 = 115.15%) but since that time has been decreasing steadily (index 1999/1997 = 73.69%). Gross investments in relation to GDP has been growing underproportionate-ly. The rate of investment has slowed down.
Development of the fixed assets share of GDP in cur-rent price has not been steady but has oscillated around the value of 267%.
The productivity of labour was 117.3 thousand CZK in the year 1990. It shows a steady growth during the whole monitored period and in the year 1999 it was 391 285 CZK. (The basic index (1999/1990) is 334.36% and the average growth rate is 112.83%.) The growth of produc-tivity of labour was achieved both by the highly dynam-ic growth in the gross domestdynam-ic product and also by a fall in the economically active population. During the period the economically active population decreased by 658 thousand persons (Table 2).
The lower average growth rate of productivity of labour than that of technical equipment entailed implementation
Figure 1. The development of productivity of labour in the Czech Republic
0 200 400 600 800 1000 1200
1995 1996 1997 1998 1999
4500 4600 4700 4800 4900 5000 5100
Technical specifications of work Productivity of labour Workers
0 1000 2000 3000 4000 5000 6000
1995 1996 1997 1998 1999
milliard CZK
0.33 0.34 0.35 0.36 0.37 0.38 0.39 CZK/CZK
[image:4.595.55.527.507.708.2]GDP Fixed assets Fund efficiency
Figure 2. The development of fund efficiency in the Czech Republic
Figure 3. Relative change of workers and fixed assents in the Czech Republic caused by change in productivity of labour and fund efficiency
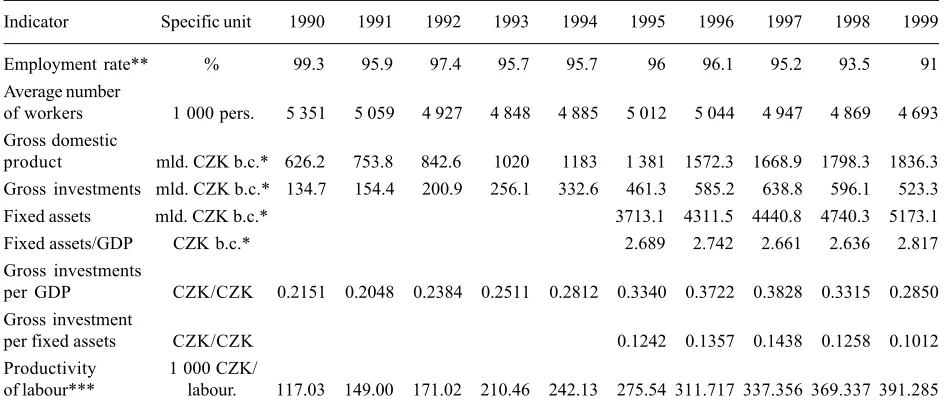
Table 2. Evaluation of the type of technical development in the national economy
Indicator Specific unit 1990 1991 19921993 1994 1995 1996 1997 1998 1999
Employment rate** % 99.3 95.9 97.4 95.7 95.7 96 96.1 95.293.5 91 Average number
of workers 1 000 pers. 5 351 5 059 4 927 4 848 4 885 5 012 5 044 4 947 4 869 4 693 Gross domestic
product mld. CZK b.c.* 626.2 753.8 842.6 1020 1183 1 381 1572.3 1668.9 1798.3 1836.3 Gross investments mld. CZK b.c.* 134.7 154.4 200.9 256.1 332.6 461.3 585.2 638.8 596.1 523.3 Fixed assets mld. CZK b.c.* 3713.1 4311.5 4440.8 4740.3 5173.1 Fixed assets/GDP CZK b.c.* 2.689 2.742 2.661 2.636 2.817 Gross investments
per GDP CZK/CZK 0.2151 0.2048 0.2384 0.2511 0.2812 0.3340 0.3722 0.3828 0.3315 0.2850 Gross investment
per fixed assets CZK/CZK 0.1242 0.1357 0.1438 0.1258 0.1012 Productivity 1 000 CZK/
of labour*** labour. 117.03 149.00 171.02 210.46 242.13 275.54 311.717 337.356 369.337 391.285
Source: CSU
* b.c. – current price
* * calculation in accordance to data CSU about general rate of unemployment in separated years * * * calculation in accordance to data CSU
-800 -600 -400 -200 0
1996 1997 1998 1999 2000 2001
-200 -100 0 100 200 300 400 milliard CZK
of the fund-intensive type of technical development in the given period which was characterized by decreasing dynamics of fund efficiency. The fund-intensive type of technical development was accompanied by high dynam-ics of productivity of labour connected with the relative reduction in the number of workers. That relative saving of the number of workers was 662.3 thousand persons (in 1996) to 226.2 thousand persons (in 1999). The aver-age annual reduction in the number of workers was 441.5 thousand persons in the years 19962001 (Figure 1).
The fund-intensive type of technical development leads to the permanent overrun of fixed assets except in the years 1997 and 1998. The highest overrun was reached in the year 1999 (332.6 milliard CZK) and in the year 2000 (238.7 milliard CZK) (Figure 2).
The average relative overrun of fixed assets is 95.0 mil-liard CZK in the years 19962000 (Figure 3).
One of the significant reasons is there is no relation-ship between gross investments share and the creation of gross domestic product. A comparison between our data and Eurostat data shows a difference in both the level and dynamics in our gross investments share (Ta-ble 3). The gross investments share has been increasing or decreasing in 60% of EU states, unchangeable only in 40% EU states in the monitored period. From this point of view, a positive evaluation of our economy performance is impossible.
TYPE OF TECHNICAL DEVELOPMENT IN SELECTED SECTORS OF ECONOMY
The farm sample for the evaluation of fund efficiency and the type of technical development in separate sec-tors of the economy was chosen from farms that are obliged to make public their statement of income in the business bulletin. Four sectors of the national economy were compared the building industry , the engineering, agriculture and food-processing industries. An average of 364 firms was monitored every year and the sector dis-tribution ratio was: the building industry 18.74 %, engi-neering 17.68 %, agriculture 41.88 % and the food-pro-cessing industry 21.70%.
The performance development in the monitored sec-tors of the national economy except agriculture is similar
Table 3. Ratio of gross investment to GDP in current prices
Country 1995 1996 1997 1998 1999 2000 Belgium 18.1 18.218.8 19.0 19.1 19.3 Denmark 16.9 16.8 17.9 18.9 18.6 19.9 Germany 20.2 19.6 19.5 19.6 19.6 19.8 Greece 15.4 16.3 17.6 18.5 18.9 19.8 Spain 18.3 18.5 18.8 19.5 20.8 22.1 France 15.5 15.3 15.0 15.5 16.1 16.7 Ireland 14.9 16.4 17.9 19.4 20.4 19.8 Italy 16.216.1 15.9 16.0 16.217.2 Luxemburg 17.216.6 18.0 16.7 19.6 16.9 The Netherlands 17.3 17.9 18.6 18.6 19.5 19.5 Austria 20.2 20.5 21.5 21.7 21.9 22.0 Portugal 19.1 19.3 21.3 22.9 23.2 24.8 Finland 13.5 14.214.8 15.8 16.1 16.7 Sweden 12.1 12.7 12.5 13.3 14.3 14.8 Great Britain 14.215.0 15.3 16.0 16.4 16.4 EU 17.217.1 17.1 17.5 17.9 18.3 Czech Republic 33.4 37.238.233.1 28.4
Table 4. Fund efficiency and the type of technical development in selected sectors of the national economy
Indicator Sector 1993 1994 1995 1996 1997 1998 1999 Average
Performance Food-processing 526 788 554 084 949 111 636 810 581 219 382 578 558 808 598 485.5 (1 000 CZK) Building indust. 325 995 345 444 759 032 488 735 926 907 321 864 460 653 518 375.7 Engineering 506 127 478 126 600 789 438 838 600 927 369 958 547 624 506 055.5 Agriculture 162 204 166 994 148 730 111 371 117 968 326 371 81 560 159 314.1 Long-term Food-processing 323 401 190 696 342 631 274 706 242 214 127 083 338 300 262 718.9 property Building indust. 145 747 240 590 421 699 169 074 252 929 148 262 144 596 217 557.0 (1 000 CZK) Engineering 343 311 500 518 393 388 216 091 310 040 535 707 244 180 363 319.2 Agriculture 120 540 126 559 100 787 78 306 84 120 114 222 78 277 100 401.4 Fund Food-processing 1.629 2.906 2.770 2.318 2.400 3.010 1.652 2.3835 efficiency Building indust. 2.237 1.436 1.800 2.891 3.665 2.171 3.186 2.4835 (CZK/CZK) Engineering 1.474 0.955 1.527 2.031 1.938 0.691 2.243 1.5513
with two culmination years 1995, when performance in three monitored sectors (foodstuff, building industry and engineering) was, in comparison with the two previ-ous years the biggest, and 1997 with the maximum pro-duction in the engineering and building industries. There is a downtrend in the food-processing industry perfor-mance from 1995 to 1998 and there is growth only in 1999. Performance in agriculture was falling until 1997. The year 1998 is from the performance aspect extremely success-ful and the smallest performance volume from the moni-tored period seems to be in the year 1999.
Current assets development in the building industry and food-processing industry achieved its maximum in the year 1995 and then mainly decreased up to the end of the period. There is a revival in foodstuffs only in the year 1999. In engineering current assets development achieves two maxima: in the year 1994 and in the year 1998. There exists an inexpressive downtrend in agricul-ture. From the charts, the clear dependence between pro-duction volume and investment rate is marked.
The data in the business bulletin does not contain the number of workers and that is why we must put up with
a evaluation of the type of technical development in each sector without the productivity of labour relationship.
For comparability, all the primary and secondary (de-rivative) characteristics are set according to an average firm in the given sector. The average firm characteristics were calculated by the simple average (Table 4).
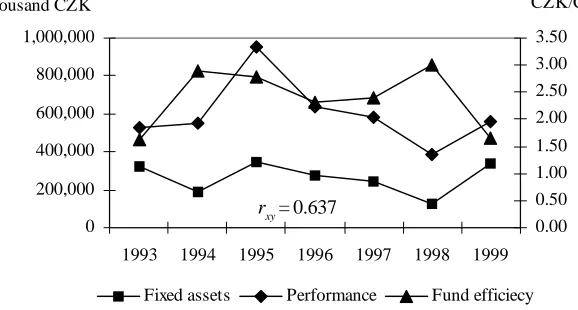
Engineering has the lowest fund efficiency in the branches compared. The average fund efficiency in the monitored period was 1.551. In this branch, the fund-saving type of technical development was realized in 1995 and in 1999. The fund-intensive type of technical development was realized in the next four years. How-ever, also in this branch, performance volume does not determine the type of technical development, but main-ly the tangible assets volume. However, a high tangible fixed assets volume in 1994 and in 1998 in an average engineering firm increased production with a years delay. Performance increase was oscillating around 600 000 thousand CZK (Figure 5). The dominate type of technical development is shown by a regression line in parameters y = 0.197x 391.82 and the correlative coefficient ryx = 0.4482.
0 100,000 200,000 300,000 400,000 500,000 600,000 700,000
1993 1994 1995 1996 1997 1998 1999
thousand CZK
0.00 0.50 1.00 1.50 2.00 2.50 CZK/CZK
Fixed assets Performance Fund efficiecy
Figure 5. Performance development, current assets and fund efficiency dynamics in engineering Figure 4. Development of the fund efficiency indexes in engineering (type of technical development)
0.00 0.50 1.00 1.50 2.00 2.50 3.00 3.50
1992 1993 1994 1995 1996 1997 1998 1999 2000
According to the development of the fund efficiency indexes (Figure 4), in the years 19951998 the fund-inten-sive type of technical development was predominating. Its disaffirmation from the fund-saving type of technical development was first of all affected by a high growth of the fund efficiency index in the year 1999.That growth had been so radical, that it evoked trend change from the fund-intensive type of technical development (in years 19951998) to the fund-saving type of technical devel-opment during the whole monitored period and evoked an average relative saving of long-term property of 53 392 thousand CZK: 15.6% share of the long-term property from the year 1993 (Table 5).
The building industry is characterized by high perfor-mance dynamics especially in the period 19931995 and 19961997. The current assets volume oscillates around the value of 183 533 thousand CZK except in the year 1995, when the current assets volume reached 421 699 thousand CZK. In the four years, 19951997, 1999 the fund-saving type of technical development was implemented and also the fund-intensive type of technical development but only in two years, 1994 and 1998. The performance volume growth and current assets decrease share the fund-sav-ing type of technical development markedly (Figure 7).
During the whole analysed period the equation of the regression line shows y = 0.0471x 92.804 (Figure 6) the predominating fund-saving type of technical
develop-ment, which led to a relative saving of long-term proper-ty in the average annual amount of 33 015 thousand CZK and represents 22.7% long-term property share from the year 1993 (Table 5).
Agriculture in 19931999 was characterized by a de-crease in both current assets and production. It is the only sector with four years of the fund-intensive type of technical development and only two years 1995 and 1998 of the fund-saving type of technical development (Figure 8).
The regression line formula is given by figure y = 0.0027x 4.3158 and according to it the trend of the fund efficiency indexes stays almost unchangeable (Figure 9). The average fund efficiency is low and together with engineering belongs among the worst of the monitored branches. Nevertheless the average relative annual sav-ing of long-term property in the amount of 12 372 thou-sand CZK which is 10.3% long-term property share in 1993 appeared in the whole period (Table 5).
Performance volume in the food-processing industry has been growing from 1993 to 1995, when the most con-siderable growth can be seen and the index (1995/1993) is 180.17%. From this year until 1998 it decreased and achieved minimum 382.78 million CZK: the basic index (1998/1993) is 61.10%. In 1999 the performance volume achieved again approximately a slightly higher level than in 1993. The basic index (1999/1993) = 106.08%.
Figure 6. Development of the fund efficiency indexes in building industry (type of technical development)
Figure 7. Performance development, current assets and fund efficiency dynamics in building industry
0.00 0.50 1.00 1.50 2.00
1992 1993 1994 1995 1996 1997 1998 1999 2000
y = 0.0471x – 92.804 ryx = 0.2599
0 200,000 400,000 600,000 800,000 1,000,000
1993 1994 1995 1996 1997 1998 1999 thousand CZK.
0.00 1.00 2.00 3.00 4.00 CZK/CZK
Fixed assets Performance Fund efficiecy
Current assets follow a similar tendency; the highest in the year 1995 342 631 thousand CZK, the basic in-dex (1995/1993) was 105.95%. Since that year the current assets have been decreasing to the minimum value in the year 1998 127 083 thousand CZK and the basic index 30.29%. In the year 1999, again a mild growth to the val-ue 338 300 thousand CZK, the basic index 104.60%.
Fund efficiency has differed significantly from 1.629 to the 3.01. On average food-stuffs show the second
big-gest fund efficiency. Each 1 000 CZK of current assets entailed 2 383 CZK of performance. This is the second highest fund efficiency after the building industry. A fund-saving type of technical development was realized in the three years (1994, 1997, 1998) (Figure 10).
It is interesting that the fund-saving type of technical development was realized during performance decrease (years 1997 and 1998), or during the mild performance growth (year 1994) (Figure 11). Investment decreasing
Figure 8. Performance development, current assets and fund efficiency dynamics in agriculture
[image:8.595.133.422.585.740.2]Figure 9. Development of the fund efficiency indexes in agriculture
Figure 10. Performance development, current assets and fund efficiency dynamics in food – processing industry 0.00
0.50 1.00 1.50 2.00 2.50
1992 1993 1994 1995 1996 1997 1998 1999 2000
ryx = 0.011776
y = 0.0027x – 4.3158
0 50,000 100,000 150,000 200,000 250,000 300,000 350,000
1993 1994 1995 1996 1997 1998 1999 thousand CZK
0.00 0.50 1.00 1.50 2.00 2.50 3.00 3.50 CZK/CZK
Fixed assets Performance Fund efficiecy
rxy = 0.613
0 200,000 400,000 600,000 800,000 1,000,000
1993 1994 1995 1996 1997 1998 1999 thousand CZK
0.00 0.50 1.00 1.50 2.00 2.50 3.00 3.50 CZK/CZK
Fixed assets Performance Fund efficiecy
was always the main source of the fund-saving type of technical development. Performance growth, mainly in the year 1995 and in the year 1999 was connected with fund-intensive type of technical development and al-ways meant a relative overrun of current assets. The av-erage annual relative overrun of long-term property is 3 855.7 thousand CZK and it is 1.2% share of the long-term property in the year 1993 (Table 5).
FUND EFFICIENCY IN FARMS IN PRODUCTION AREAS
Production areas were specified by the Economic Committee of the Agrarian Chamber as areas up to 450 metres above sea level. The farms mentioned specialise mainly in maize and sugar beet crops. The average soil price in these firm is 5.9 CZK/m2. It was necessary to get
records at each farm for the whole analysed period for evaluation of the type of technical development. Exact comparability considerably limited the number of moni-tored farms to 40 farms for both areas (Table 6).
The 19972000 period is characterized in the produc-tion area farms by a decrease in the average number of labourers. If in the year 1997 there were 69.5 labourers in an average farm, then in the year 2000 there were 59.3 labourers in the same farm. Index (2000/1997) is 85.4%. For these years a steady drop of labourers in a farm is a
common feature. From the aspect of country develop-ment it is almost adverse, because the number of job opportunities in the country is decreasing. On the other hand, the reduction of the number of labourers in farms increases their economic prosperity, which positive ex-presses the positive variation of technical development of the farm.
The average state of tangible assets has been increas-ing. If tangible assets in an average farm was 40 426 thou-sand CZK in the year 1997, then in the year 2000 tangible assets had increased to 41 060 thousand CZK. Basic in-dex (2000/1997) was 101%. The rate of growth of tangible assets (100.58%) has insufficiently covered simple repro-duction of these assets. The evidence is the increase in the relative age of these assets. In 1998 the average rela-tive age was 41.81% and in 2000 43.20%. This differenti-ation can be even bigger in natural expression because of the growth of the purchase prices of tangible assets. Increasing average tangible assets together with the drop in the number of workers are leading to a growth in the use of technical equipment in an average farm. In the monitored period the value of technical equipment in-creased from 581.67 thousand CZK to 692.06 thousand CZK. An increase in technical equipment characterized by the basic index (i2000/1997 = 118.98%) can be taken as
[image:9.595.117.441.58.256.2]adequate because this rate growth it was possible to re-alize the fund-saving type of technical development in farms.
Figure 11. Development of the fund efficiency indexes in food-processing industry
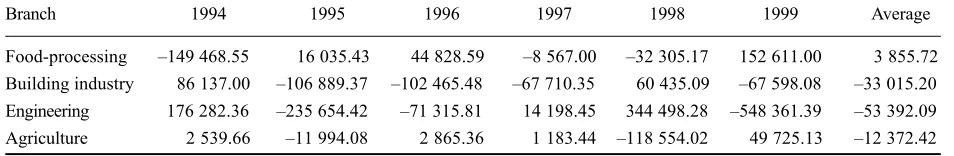
Table 5. Relative change of long - term tangible property due to fund efficiency
Branch 1994 1995 1996 1997 1998 1999 Average
Food-processing 149 468.55 16 035.43 44 828.59 8 567.00 32 305.17 152 611.00 3 855.72 Building industry 86 137.00 106 889.37 102 465.48 67 710.35 60 435.09 67 598.08 33 015.20 Engineering 176 282.36 235 654.42 71 315.81 14 198.45 344 498.28 548 361.39 53 392.09 Agriculture 2 539.66 11 994.08 2 865.36 1 183.44 118 554.02 49 725.13 12 372.42
0.00 0.20 0.40 0.60 0.80 1.00 1.20 1.40 1.60 1.80 2.00
1992 1993 1994 1995 1996 1997 1998 1999 2000
[image:9.595.54.531.320.398.2]differentiating in farms and together with a drop in the average number of workers the growth of productivity of labour was accelerating. In 1997 the performance volume Positive performance in the whole analysed period on
the one hand could have realized the fixed assets growth and consequently on the other hand no fund efficiency
Table 6. Dynamics of the selected indicators in an average farm in the years 19972000 in an production area
Indicator Specificunit Compared time 1998 time Basic1997 Index Difference change indexRelative Relativechange
Average evidence number
of labour labourer 68.00 69.50 0.98 1.50 5.94 0.09 Average state of fixed assets 1 000 CZK 41 612.00 40 426.00 1.03 1 186.00 1 399.20 0.03 Performance 1 000 CZK 40 199.50 37 783.30 1.06 2 416.20
Personal cost 1 000 CZK 10 618.50 10 090.00 1.05 528.50 928.25 0.09 Fixed assets depreciation 1 000 CZK 4 304.83 3 981.17 1.08 323.66 144.75 0.04
Interest rate % 4.00 4.00 1.00 0.00
Productivity of labour 1 000 CZK/lab. 591.17 543.64 1.09 47.53 Technical equip. of work 1 000 CZK/lab. 611.94 581.67 1.05 30.27 Fund efficiency CZK/CZK 0.97 0.93 1.03 0.03 Personal cost of a workers 1 000 CZK/lab. 156.15 145.18 1.08 10.97 FA depreciation/average
TA state CZK/CZK 0.103 0.098 1.05 0.005
Indicator Specificunit Compared time 1999 time Basic1998 Index Difference change indexRelative Relativechange
Average evidence number
of labour labourer 63.50 68.00 0.93 4.50 3.17 0.05
Aver. state of fixed assets 1 000 CZK 43 302.08 41 612.00 1.04 1 690.08 6 384.63 0.15 Performance 1 000 CZK 35 664.30 40 199.50 0.89 4 535.20
Personal cost 1 000 CZK 9 617.67 10 618.50 0.91 1 000.83 480.37 0.05 Fixed assets depreciation 1 000 CZK 5 150.50 4 304.83 1.20 845.67 759.41 0.18
Interest rate % 4.00 4.00 1.00 0.00
Productivity of labour 1 000 CZK/lab. 561.64 591.17 0.95 29.53 Technical equip. of work 1 000 CZK/lab. 681.92611.94 1.11 69.98 Fund efficiency CZK/CZK 0.820.97 0.85 0.14 Personal cost of a workers 1 000 CZK/lab. 151.46 156.15 0.97 4.69 FA depreciation/average
TA state CZK/CZK 0.119 0.103 1.15 0.015
Indicator Specificunit Compared time 2000 time Basic1999 Index Difference change indexRelative Relativechange
Average evidence number
of labour labourer 59.33 63.50 0.93 4.17 12.91 0.20 Aver. state of fixed assets 1 000 CZK 41 060.00 43 302.08 0.95 2 242.08 8 201.81 0.19 Performance 1 000 CZK 40 572.83 35 664.30 1.14 4 908.53
Personal cost 1 000 CZK 9 791.50 9 617.67 1.02173.83 2 130.53 0.22 Fixed assets depreciation 1 000 CZK 5 263.50 5 150.50 1.02113.00 1 051.39 0.20
Interest rate % 4.00 4.00 1.00 0.00
Productivity of labour 1 000 CZK/lab. 683.85 561.64 1.22 122.21 Technical equip. of work 1 000 CZK/lab. 692.06 681.92 1.01 10.14 Fund efficiency CZK/CZK 0.99 0.821.20 0.16 Personal cost of a workers 1 000 CZK/lab. 165.03 151.46 1.09 13.57 FA depreciation/average
in an average farm was 37.783 million CZK, in 1998 it was 40.199 million CZK and in the year 1999 this dynamic growth had increased to 35.664 million CZK; the basic index of performance (2000/1997 was 107.4% and the av-erage growth rate of performance was 102.45%.
Fund efficiency in the period analysed slightly in-creased. If in 1997 an average farm was able to produce with 1 000 CZK of current assets 930 CZK of performance, then in the year 2000 fund efficiency was 0.99(Figure 12). In 1997 the average productivity of labour in a farm was 543.4 thousand CZK per worker and in 2000 the average productivity of labour was 683.85 thousand CZK per worker. Basic index (2000/1997) is 125.8% and the aver-age growth rate 108.1% (Figure 14).
In the years 1998/1997 and 2000/1999 the fund-saving type of technical development accompanied by fund ef-ficiency and productivity of labour growth was realized in these farms; in the years 1999/1998, a fund-intensive type of technical development accompanied by fund ef-ficiency and a fall in the productivity of labour was real-ized (Figure 13).
The effects of the fund-saving type of technical devel-opment in the years 1998/1997 and 2000/1999 can be seen in following points:
In comparison with the previous periods, fund efficien-cy growth follows the fund-saving type of technical de-velopment in both periods.
In 1998/1997, fund efficiency increased from 0.93 to 0.97, fund efficiency index was 103%. Due to increasing fund efficiency, there was an underproportional fixed as-sets development considering performance volume and as a result there were relative savings. These savings in an average farm were 1 399.2 thousand CZK, (3.36% of fixed assets in the year 1998). Relative savings of fixed assets evoked relative depreciation savings of 144.75 thousand CZK, (3.36% of the depreciation cost of the year 1998).
Productivity of labour was increased from 543.64 thou-sand CZK to 591.17 thouthou-sand CZK (9 points). In relation to performance, the number of workers was developing underproportionally and that produced relative savings in the number of workers. These savings were 5.94 work-ers in an average farm: 8.7% of workwork-ers in the year 1998. Because of relative savings in the number of workers per-sonal costs were reduced by about 928.25 thousand CZK.
A fund-saving type of technical development in the period 19992000 was connected with the growth of the fund efficiency index and productivity of labour index. The dynamics of that growth were overtaking the rate of growth in the years 19971998.
A fund efficiency increase from 0.82 in the year 1999 to 0.99 in the year 2000 was due to farm performance growth and fixed assets drop (index 2000/1999 = 1995%).
Accord-Figure 12. Performance development, current assets and fund efficiency dynamics in an average farm in production areas
Figure 13. Development of the fund efficiency indexes in an average farm in production areas
0 0.2 0.4 0.6 0.8 1 1.2 1.4
1996 1997 1998 1999 2000 2001
y = 0.0464x – 91.629 rxy = 0.3923
0 10000 20000 30000 40000 50000
1997 1998 1999 2000
thousand CZK
0.000 0.200 0.400 0.600 0.800 1.000 CZK/CZK
Performance Average state of fixed assets Fund efficiency
ing to the fund-saving type of technical development, relative fixed assets savings of 8 201.81 thousand CZK and relative depreciation savings rose to the amount of 1 051.39 thousand CZK.
The decrease in the number of labourers on an average farm influenced the growth of productivity of labour. The average number of workers was 63.5 in the year 1999 and 59.33 in the year 2000. A decrease in the number of work-ers and performance growth have increased the produc-tivity of labour to 122% and accordingly, relative savings of 12.91 workers,to a personal cost 2 of 130.53 thousand CZK. Technical equipment work increased to 692.06 thousand CZK.
Effects of fund-intensive type of technical development in the years 1999/1998
During 1999/1998, fund-intensive type of technical de-velopment accompanied by a fall in productivity of labour was implemented in an average farm. Fund efficiency decreased to 85 % in comparison with the year 1998 and was 0.82 in the year 1999. This is below the level for the year 1997. This fund efficiency drop entailed a relative overrun of fixed assets of 6 384.63 thousand CZK. A rel-ative fixed assets overrun also resulted in a relrel-ative de-preciation overrun of 759.41 thousand CZK.This situation was caused by rather considerable investment dynamics in the given year. Chain growth index of fixed assets was 104 %, while the performance index was only 89%. Productivity of labour at this time decreased. Index 1999/1998 was 95 %. In consequence of the decrease in the productivity of labour, a relative overrun of personal cost in the amount of 480.37 thousand CZK occurred (Figure 14).
Fund-intensive type of technical development entailed the growth of technical equipment of work, because fixed assets dynamics were higher than the average number in terms of dynamics as well as performance dynamics.
A fund-intensive type of technical development in the period 1999/1998 was connected with a general relative cost overrun of 1 239.78 thousand CZK. From the
view-point of the period 19971999, the fund-intensive type of technical development had not affected the positive tendency of 1998 to any extent.
On the basis of the results of the evaluation of the type of technical development in the production areas in the years 19972000, the period will be evaluated positively. The development of productivity of labour was definite-ly positive, maindefinite-ly because of the annual reduction in the number of labourers. That affected the total dynamics of productivity of labour to the extent of 117.14%. The change in performance volume did not share growth to the same extent as the productivity of labour. The share of total dynamics of productivity of labour was 107.38 %. The fund-intensive type of technical development in the year 1999 had affected the total fund efficiency dy-namics in the analysed period. From the aspect of partic-ular factors fund efficiency was mainly influenced to the extent of 107.38% by performance increase. Fixed assets influence had been less important its increase entailed a fund efficiency decrease of 98.45%. It follows from the above-mentioned facts that a change in the type of tech-nical development is primarily affected by the dynamics of two factors work and capital.
FUND EFFICIENCY IN FARMS IN MARGINAL AREAS
In marginal regions the type of technical development evaluation was divided into two different groups accord-ing to sea level. The first are farms 450650 m above sea level, the second 650850 m.
In marginal areas the fund-saving type of technical development accompanied by productivity of labour growth occurred in the period. The fund-intensive type of technical development connected with productivity of labour growth occurred in this period only once in 1998 for the group of farms 650850 m above sea level. On one occasion the fund-intensive type of technical develop-ment accompanied by constant productivity of labour occurred namely in the year 1999 for the group of farms 450650 m above sea level. From this point of view the
Figure 14. Productivity of labour development in an average farm in the production areas
0.00 200.00 400.00 600.00 800.00
0.0 20.0 40.0 60.0 80.0
Technical specifications of work Productivity of labour
Number of workers
year 1999 was a hard year endangering the positive de-velopment in the monitored period (Table 7).
We can make a detailed statement of the type of techni-cal development in single zones of land above sea level.
In the zone 450650 m above sea level the fund-saving type of technical development joined with productivity of labour growth in 1998. Performances in that period increased in comparison with the previous year to 102%. Decrease in the average number of workers (index 1998/ 1997 91%) had also positively influenced the type of technical development. Technical equipment work in-creased from 573.91 to 628.90 thousand CZK. A higher index of productivity of labour (112%) than technical equipment caused a growth in the fund efficiency index to 102%. Due to the positive development of the
above-mentioned indicators, the farms realized fixed assets sav-ings in the amount of 1 300.28 thousand CZK. The ratio of these savings to total fixed assets of the year 1998 was 2.27%. Relative fixed assets savings also entailed depre-ciation savings of 122.93 thousand CZK. These savings represent 2.27% depreciation cost in the analysed peri-od. Productivity of labour growth produced relative sav-ings of 10.99 workers and relative savsav-ings of 1 656.55 thousand CZK of personal cost.
Compared to this, in the year 1999, there was a fund-intensive type of technical development accompanied by fund efficiency decrease and constant productivity of labour. The performance volume in that year fell to 92% and was 40 763.57 thousand CZK. The average number of workers fell to 92% and was 83.97. Tangible assets fell to 98%. Technical equipment of work increased by seven points and stabilized at 671 960 CZK. The fund efficien-cy index fell to 93% and consequently tangible assets relatively overran by 3 876.59 thousand CZK and relative depreciation overran by 396.82 thousand CZK. Produc-tivity of labour remained unchanged in comparison with the previous year. There was a relative overrun of sonal costs of 65 230 CZK. The main reason was a per-formance decrease in that year.
[image:13.595.131.410.400.522.2]The year 2000 experienced the stabilization of single indicators in the given sea level zone. A continuing fall in the average number of workers to 93% of the original Table 7. Development of fund efficiency and productivity of
labour in an average farm in marginal areas
Group 1998 1999 2000
450650 1 < i(Fu) < iv i(Fu) < 1 = iv 1 < i(Fu) < Iv 1< 1.02 <1.12 0.93 < 1 = 1 1 < 1.09 < 1.16 650850 i(Fu) < 1 < iv 1 < i(Fu) < iv 1 < iv < i(Fu)
0.95 < 1 < 1.03 1 < 1.03 < 1.09 1 < 1.11 < 1.19
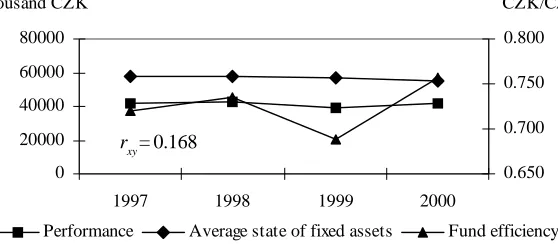
Figure 15. Revenues, fixed assets development and fund efficiency dynamics in an average farm in the marginal areas
Figure 16. Productivity of labour development in an average farm in the marginal areas
0 20000 40000 60000 80000
1997 1998 1999 2000
thousand CZK
0.650 0.700 0.750 0.800 CZK/CZK
Performance Average state of fixed assets Fund efficiency
rxy = 0.168
0.00 200.00 400.00 600.00 800.00
1997 1998 1999 2000
0.0 20.0 40.0 60.0 80.0 100.0 120.0
Technical equip.of work Productivity of labour
Number of workers
number was accompanied by a drop in tangible assets to 99%. Due to to the drop in the average number of labour-ers, technical equipment has increased 6 points (to 713.57 thousand CZK per one labourer). Growth of productivity of labour of 16 points has brought relative savings of 12.25 labourers and relative savings of personal costs of 2 072.89 thousand CZK. Fund efficiency has increased 9 points. On the basis of productivity of labour growth and an increase in fund efficiency we can evaluate de-velopment in this area very positively.
The development of the monitored indicators in the zone 650850 m above the sea level can also be positive-ly evaluated.
In the year 1998, the fund-intensive type of technical development joined with decreasing fund efficiency and produced increased productivity of labour. Performance continued unchanged in this period, however the aver-age number of workers fell to 97% and productivity of labour increased 3 points. Tangible assets increased to 105%, and technical equipment of work to 108%. The fund efficiency index had fallen to 95%, which caused a relative overrun of fixed assets of 1251.82 thousand CZK and a relative depreciation overrun of 135.37 thousand CZK. Performance remained unchanged, however a
de-crease in the number of workers led to personal cost sav-ings of 140.81 thousand CZK and growth in productivity of labour.
In the year 1999 the fund-saving type of technical de-velopment joined with increasing fund efficiency and produced an increased productivity of labour. The aver-age number of workers fell to 90% and fixed assets to 95%. Due to the drop in the average number of workers, technical equipment of work increased by 6 points and was 771.37 thousand CZK per worker. A productivity of labour increase of 9 points brought relative personal cost savings of 469.63 thousand CZK. Fund efficiency in-creased 3 points. On the basis of productivity of labour growth and fund efficiency increase we can very positiv-ely evaluate development in this area.
The year 2000 brought to that area a more significant increase in performance than in previous years (113%) that is by a minor increase in the average number of work-ers (102%) and a decrease in fixed assets to 95% of the primary value, which meant an increase in the productiv-ity of labour of 11 points and personal cost savings of 583.72 thousand CZK. A fall in fixed assets and low growth in the number of workers produced a decrease in the use of technical equipment to 93%. Fund efficiency
Figure 17. Development of the fund efficiency indexes in the average farm in marginal areas
Figure 18. Relative labourer savings and relative long-term property savings in an average farm in the marginal areas
0.9 0.95 1 1.05 1.1 1.15
1996 1997 1998 1999 2000 2001
y = 0.021x – 41.749 ryx = 0.4071
-15.0 -10.0 -5.0 0.0 5.0
1997 1998 1999 2000
-6000.0 -4000.0 -2000.0 0.0 2000.0 4000.0 thousand CZK
in that period increased by 19 points and development in respect the growth of productivity of labour in that peri-od has been positive.
If we summarize the results of the evaluation of the type of technical development in all marginal areas in the years 19972000, the development can be evaluated as definitely positive. Except in the year 1999, there was a fund-saving type of technical development with increas-ing fund efficiency and productivity of labour. Not even in the year 1999 was there any drop in the productivity of labour. A typical feature of this area is a steady fall in the number of workers and fixed assets. Performance has in-creased very slightly (2000/1997 100.75%) however pro-ductivity of labour has increased to 128.86 and primarily because of a reduction in the number of workers to 78% of the original figure.
CONCLUSION
The aim of this evaluation of the type of technical de-velopment is an understanding of dede-velopment propor-tionality between long-term tangible assets volume, the average number of labourers and performance volume. From this point of view the national economy is charac-terized by a slow investment rate, with tangible assets growing under proportionally according to gross domes-tic product. Productivity of labour growth has been achieved partly by gross domestic product growth, but also by a fall in the average number of labourers. Howev-er, this fall in the number of workers in the national econ-omy in contrast to an average farm has not been steady; in the years 1995 and 1996 it was growing.
The monitored sectors of the national economy are characterized by average relative long-term tangible as-sets savings, mainly in engineering, the building indus-try and agriculture. In the whole monitored period in
these industries the fund-saving type of technical devel-opment predominated. However in agriculture this trend was not much in evidence. In contrast, in the food-pro-cessing industry, fund efficiency decreased in the whole analysed period which led to average relative overrun of long-term tangible assets.
On an average farm in the production and marginal ar-eas the type of technical development can be nominated for the whole period under analysis as the fund-saving type. Only the year 1999 represented the fund-intensive type of technical development caused first of all by a drop in performance. Both monitored areas produced an almost steady fall in the number of workers and a growth in productivity of labour. In production areas the growth of productivity of labour has been effected by perfor-mance growth, while in marginal areas perforperfor-mance growth has been very mild, so that growth of productiv-ity of labour has been caused primarily by a reduction in the number of workers. From the viewpoint of the type of technical development we can evaluate development on an average farm as positive.
REFERENCES
Støeleèek F. (1991): Analýza podnikatelské èinnosti. VZ Praha, 61 s.
Jílek M. (2000): Systém finanènì ekonomického hodnocení podniku na základì údajù úèetních výkazù. [Disertace], ZF. JèU Èeské Budìjovice, 270 s.
Statistical Yearbook of the Czech Republic (19912001). Czech Statistical Office, Praha.
Støeleèek F., Kollar P., Lososová J. (2002): Economic results of agricultural companies in production and marginal areas in the year 2000. Agricultural Economics Czech, 48, (10): 433-443.
Arrived on 5th November 2002
Contact address:
Prof. Ing. Frantiek Støeleèek, CSc., Ing. Jana Lososová, Jihoèeská univerzita v Èeských Budìjovicích, Studentská 13, 370 05 Èeské Budìjovice, Èeská republika