Transportation Research Procedia 14 ( 2016 ) 3031 – 3039
2352-1465 © 2016 The Authors. Published by Elsevier B.V. This is an open access article under the CC BY-NC-ND license (http://creativecommons.org/licenses/by-nc-nd/4.0/).
Peer-review under responsibility of Road and Bridge Research Institute (IBDiM) doi: 10.1016/j.trpro.2016.05.444
ScienceDirect
6th Transport Research Arena April 18-21, 2016
Evaluation of the Traffic Speed Deflectometer data
using simplified deflection model
Gary Chai
a,*, Sittamapalan Manoharan
b, Andrew Golding
b,
Greg Kelly
a, Sanaul Chowdhury
aa
School of Engineering, Griffith University, Gold Coast, QLD 4222, Australia
b
Queensland Department of Transport and Main Roads, Brisbane, QLD 4001, Australia
Abstract
Falling Weight Deflectometer (FWD) has been used by many road agencies worldwide for structural evaluation of both flexible and concrete pavements since the 1980s. With the development of Traffic Speed Deflectometer (TSD), the laser-based deflectograph is increasing used to perform continuous bearing capacity measurement at a range of driving speeds. The two main advantages of the TSD technology are; its ability to carry out continuous deflection measurements rather than at discrete points and the tests can be carried out at traffic speed without the need for lane closure in the case a stationary device such as the FWD. The objective of this paper is to study the deflection basins generated by TSD on flexible pavements using Simplified Deflection Model (SDM). The study shows that TSD data can be modelled accurately using SDM that can be represented in a mathematical form of Y = K1 exp (-r/K2). K1 is equal to deflection at D0in micron and K2 is the structural parameter at the respective sensor
location r. It is observed that the majority of the pavement sections possess nonlinear subgrade behaviour in the TSD deflection data. The dynamic effects generated by the TSD axle load are likely to be the reason for the pavements to exhibit subgrade nonlinearity. A comparison between the FWD and TSD data shows a high level of correlation and a mathematical model has been established for estimation of FWD deflections using the TSD data. The study also shows that he theoretical deflections generated by the SDM are in good agreement with the actual deflection data obtained from FWD test. Statistical analysis confirms that the SDM generated D0 deflections are not significantly different from the D0 deflections recorded by FWD device.
* Corresponding author. Tel.: +61-7-5552-9142; fax: +61-7-5552-8065.
© 2016The Authors. Published by Elsevier B.V..
Peer-review under responsibility of Road and Bridge Research Institute (IBDiM).
Keywords: traffic speed deflectometer; falling weight deflectometer; simplified deflection model; subgrade nonlinearity
1.Introduction
Falling Weight Deflectometer (FWD) has been used by many road agencies worldwide for structural evaluation of both flexible and concrete pavements since the 1980s. Since the use of the deflectograph ceased in 1991, Danish Road Institute has been looking for a mean other than the FWD to perform a preliminary screening of the national highway network with regard to structural pavement condition. In middle of 1990s, Danish Road Institute established a project with the aim of developing a new laser-based high speed deflectogaph. The main partners in the project were Danish Road Institute and Greenwood Engineering, while Delft University of Technology in the Netherland and the Technical University of Denmark were engaged in the theoretical work in co-operation with the main partners (Hilderbrand, Rasmussen & Andres, 2000). The high speed deflectograph made use of laser Doppler sensors to provide a continuous measurement of the deflection velocity of a pavement surface loaded by a semitrailer driven at normal traffic speed.
With the development of Traffic Speed Deflectometer (TSD), the laser-based deflectograph is increasingly used to perform continuous bearing capacity measurement at a range of driving speeds. The two main advantages of the TSD technology are; its ability to carry out continuous deflection measurements rather than at discrete points and that tests can be carried out at traffic speed without the need for lane closure in the case a stationary device such as the FWD.
The key objective of this paper is to study the characteristics of the TSD deflection bowls using Simplified Deflection Model (SDM) and making a comparison between the D0 produced by TSD and FWD. The study will
establish a correlation for the D0 deflection between the two devices and analyse the degree of nonlinearity of TSD
data using the D900 deflections.
2.Testing program
Queensland Department of Transport and Main Roads (TMR) currently uses FWD deflection data predominantly for road rehabilitation projects using the TMR Pavement Rehabilitation Methodology. The D0 values of the
deflection bowls are used for identification of structural weakness along the road sections. Due to the cost and time of collection of the deflection using FWD, the use of the deflection data for structural evaluation in pavement management has been limited. To overcome this, TMR decided to undertake trials utilizing the TSD device to perform continuous bearing capacity measurement at a range of driving speed.
In 2010 a TSD trail was undertaken by TMR and Roads and Traffic Authority of New South Wales (RTA) for the first time in Australia to test 6000 km of the state-controlled road network in Queensland (QLD) and significant road in New South Wales. The TSD trial was carried out to achieve the following objectives:
x investigating the correlation of TSD data to that obtained from other deflection measuring devices such as FWD and Deflectograph;
x identifying any factors that affect repeatability and reliability of correlation;
x identifying factors that may affect TSD performance under local conditions; and
x assessing the suitability of the TSD as a network screening tool.
A total of six test sites with granular pavement were selected in QLD state. FWD tests were conducted along with the TSD to study the correlation between the two devices. The trail sections varied from 500 to 1000 meters in length and the FWD tests were measured at 5, 10 and 50 meters intervals in different test sites. After processing, the TSD and FWD data were finally clenched to 400 test points and were tabulated in Excel spreadsheet for analysis.
© 2016 The Authors. Published by Elsevier B.V. This is an open access article under the CC BY-NC-ND license (http://creativecommons.org/licenses/by-nc-nd/4.0/).
3.Data processing
The TSD is an innovative Rolling Wheel Deflectometer based on velocity measuring Doppler lasers. The device measures the velocity of the deflection of the pavement surface due to a 10 tons axle load while driving up to 80 km/h. In 2010, a trail on TSD was undertaken by two eastern states road authorities for the first time in Australia. A trial of 6000 km of road network was tested with TSD and six selected sites were tested with FWD to compare both testing devices. To establish a correlation for the D0 deflections, the trial sections were marked at the points
where the deflection tests were carried out by both TSD and FWD. Furthermore each trial section length varied from 500 to 1000 meters and the tests were conducted at 5, 10 and 50 meters intervals.
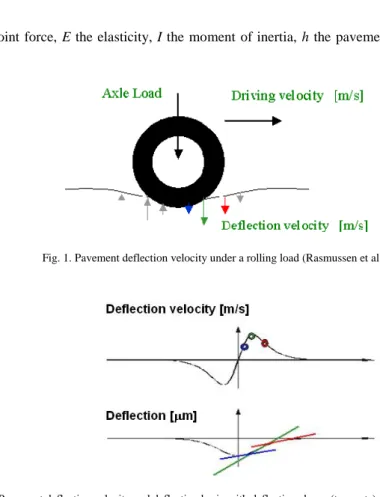
During operations, Doppler sensors measure vertical deflection velocities of the pavement surface at the discrete points and when divided by the instantaneous vehicle speed, they produce deflection slopes at those points (Rasmussen et al, 2008). Figure 1 shows the pavement deflection velocity vectors under a rolling wheel. Together with the deflection velocity the corresponding deflection basin is shown in Figure 2 where deflection slopes (tangents) are displayed.
In order to determine the actual pavement deflections, deflection slope curve must be integrated using a closed--form solution of a mechanical model such as an elastic beam on Winkler foundation (Rasmussen et al, 2008). This is expressed in the 2–parameter Euler-Bernoulli beam as shown in Equation 1:
4
4
( )
( )
( )
d
EI
w x
kw x
F x
dx
(1)
where, F is the point force, E the elasticity, I the moment of inertia, h the pavement thickness and k is the spring constant.
Fig. 1. Pavement deflection velocity under a rolling load (Rasmussen et al., 2008).
Graczyk et al. (2014) proposed a unique analytical solution for the pavement deflections in one-layer pavement system. The pavement is modeled as the Euler-Bernoulli beam supported by the viscoelastic foundation while the loading is assumed as a set of concentrated forces moving with a constant speed.
Another approach for analysing TSD data to produce TSD deflection bowl is known as the area under the curve (AUTC) method (Muller & Roberts, 2013). This method was developed following the initial TSD trials in Australia in 2010. The AUTC method uses a numerical integration approach in accordance with the following procedures: x The base TSD data consists of a set of vertical pavement velocities, referenced against horizontal offset spaced
along the axis of the wheel path and away from the loading of the dual tyred truck wheels. This data is termed the velocity profile;
x The value of the velocity at each point is a function of the pavement strength, the offset of the Doppler laser velocity sensor from the centre point of loading, and the horizontal speed of the TSD vehicle (which affects the speed of the vertical loading);
x The slope is the ratio between the vertical and horizontal velocities at each measurement point and actual physical slope of the pavement surface within the deflection bowl centred under the moving TSD vehicle rear wheel;
x By plotting slope values against offsets from the load point as a slope profile curve (analogous to the previously mentioned velocity profile), it is possible to show that the cumulative area under the slope profile working from the tail is exactly equal to the vertical deflection at that point;
x The vertical difference between any two deflection points, such as for the bowl curvature, (D0-D200), is equal to the area under the slope profile curve between these two points.
Full text of the AUTC procedure can be found in Austroads Publication No. AP-T279-14 entitled “Traffic Speed Deflectometer: Data Review and Lesson Learnt (Roberts et al., 2014).
4.Research methodology
Subgade nonlinear behavior of thin surfaced flexible pavements can also be analyzed using Simplified Deflection Modeling (SDM) (Chai et al. (2015)). In the studies carried out by Chai & Kelly (2008) and Chai et al. (2010), it was found that FWD deflection data obtained from the Southeast Queensland’s Long-Term Pavement Performance (SEQ-LTPP) sites can be modelled accurately using SDM. The exponential curve in SDM was found to have the
desired characteristics that match the FWD deflection bowls. The parameters used in the model are explained as follows: 2 ( / ) 1 r K r
Y
K e
(2)where Yr is the FWD deflection at the respective sensor location (micron) and r is the respective sensor offset
location (millimetres). K1 is equal to deflection at D0 in micron and K2 is the structural parameter at the respective
sensor location. For deflection at sensor D900, the equation becomes: 2,900 ( 900/ ) 900 1 K
Y
K e
(3) 2,900 900 0900
(log
log
)
K
eD
eD
(4)where Y900 is the FWD deflection at the sensor location D900 (micron) and K2,900 is the K parameter for FWD
deflection at D900. The rationale of using the D900 data is that the D900 deflection has been found to reflect a subgrade response that remains essentially unaffected by the structure of the overlying pavement [14]. Deflection D900 data is utilized because the deflection sufficiently far from the impact load is largely contributed by the subgrade. The D200
and D300 are not used because the deflections are indicative of the structural strength of the granular layers. D1500
deflection is not considered in the model because the dynamic effect of the FWD load on thin surfaced asphalt pavement, influences mainly the pavement materials near the impact load at the time of contact. Sensor D1500
positioned at 1.50 m away from the impact load is approximately four to six times the total thickness of the pavement layers and it would be outside the influence zone.
The parameter K2,900 is found to have a direct relationship with the material constant, -value (Ullidtz, 1998)
and the parameter can be used as a measurement of the degree of nonlinearity. The relationship between K2,900
parameters and n values has been developed and the equation can be expressed as follows:
( /0.4546)
2,900
435
143
n
K
e
(5)where K2,900 is the K parameter for FWD deflection at sensor location D900 (micron) and n is the degree of
nonlinearity. When the degree of nonlinearity, n valueis -0.50, K2,900 for the particular deflection basin is computed
to be 288. As the degree of nonlinearity increases to -1.00, K2,900 decreases to 191. It can be observed that when
K2,900 is smaller than 300, the deflection basin is associated with high degree of subgrade nonlinearity.For moderate
degree of nonlinearity, K2,900 falls within the range of between 300 to 500.As K2,900 increases and approaches 500,
the pavement structure is observed to possess linear elastic behaviour with n value is nearly equal to zero. Using the newly developed relationship, the degree of subgrade nonlinearity can be defined using the K2,900 and n value as
shown in Table 1.
The characteristics of the TSD deflection bowls shall be modelled using SDM and the degree of nonlinearity shall be analysed using the D900 data. The correlation between the maximum deflection D0 between TSD and FWD
devices shall be developed.
Table 1. Definition of Degree of Nonlinearity of Subgrade (Chai et al, 2015). Degree of subgrade nonlinearity K2,900 n-value
Linear >500 0.00
Moderate 300 to 500 0.00 to -0.50
High <300 <-0.50
5.Data analysis
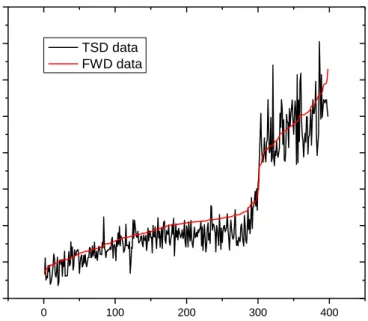
Four hundred TSD and FWD deflection data from pavement test sections in QLD were plotted in Figure 3. The TSD and FWD graphs show a consistent trend in the pattern of the maximum D0 deflection. A correlation has been
established between the two sets of data and the relationship is expressed in Equation 6. The mathematical model has an R2 value of 0.88 indicating a high level of correlation between the two data sets (see Fig. 4). This model can
be used for estimation of FWD deflection using the TSD data. Fifteen deflection bowls generated from the TSD Doppler lasers are presented in Table 2. The D0 deflection varies from 247 micron (0.247 mm) to 1,939 microns
(1.939 mm). For D300, the deflection is reported to be between 73 (0.073 mm) to 663 microns (0.663 mm).
Relatively small deflections were recorded at the D900 sensors. At this sensor location, the deflection varies from
4 (0.004 mm) to 110 microns (0.110 mm) and is nearly identical despite the increase in the deflection in D0. This
observation is particularly obvious for Test Sites No.7 and 15. One reason for these consistently small deflections is the dynamic affect of the TSD load which influences mainly the pavement materials near the impact load at the time of contact. The deflection basins show that the radius of influence zone for the thin granular pavements (with bituminous layer less than 50 mm) is confined within the distance of about 300 to 400 mm from the impact load.
The degree of subgrade nonlinearity (K900) was computed using Equation 4 and the values were included in
Table 2. It can be observed that majority of the K2,900 parameters are less than 500 and the deflection bowls are said
to possess either moderate or high degree of nonlinearity. Seven of the test sections show high degree of nonlinearity with K900 ranges from 218 to 279.
Fig. 3. TSD and FWD data collected along the test locations.
Fig. 4. Correlation between TSD and FWD data.
0 250 500 750 1000 1250 1500 1750 2000 0 250 500 750 1000 1250 1500 1750 2000 D0 deflection D0(FWD) = 0.896*D0(TSD)+110.65 R2 = 0.88 F alling Weight Def lect omet er D 0 (micron)
Traffic Speed Deflectometer D0 (micron)
0 100 200 300 400 0 250 500 750 1000 1250 1500 1750 2000 TSD data FWD data D0 def lect ion (micron) Test Location
Table 2. Traffic Speed Deflectometer deflection bowls data and the degree of subgrade nonlinearity.
TSD deflection (micron) Subgrade Nonlinearity Location D0 D200 D300 D450 D600 D900 K2,900 1 247 148 108 69 47 25 393 2 256 152 102 53 27 9 269 3 259 122 73 36 20 9 268 4 363 175 101 43 19 4 203 5 426 225 152 89 56 27 326 6 558 254 150 70 34 9 218 7 705 415 300 186 119 54 350 8 845 532 394 257 176 92 406 9 951 624 475 319 217 105 408 10 1063 673 496 313 212 93 369 11 1010 510 309 145 70 19 227 12 1263 589 352 172 91 31 243 13 1474 735 559 358 239 110 347 14 1483 796 521 283 161 59 279 15 1939 1024 663 349 189 58 256
The TSD-D0 deflection data were converted to FWD-D0 deflection using the FWD-TSD relationship in
Equation 6 and to deflection D200, D300, D450, D600 and D900 using SDM models shown in Equations 7 to 11. The
model (Eq. 6) was developed using the actual deflections obtained from both devices TSD and FWD (see Figure 4).
Table 3. Conversion of traffic speed deflectometer to FWD data using simplified deflection model.
Engineering Models Equation Identification
0(FWD)
0.896*
(TSD)110.65
D
D
(6) ( 200/ 2,200) 200( ) 0( ) K FWD FWDD
D
e
(7) ( 300/ 2,300) 300( ) 0( ) K FWD FWDD
D
e
(8) ( 450/ 2,450) 450( ) 0( ) K FWD FWDD
D
e
(9) ( 600/ 2,600) 600( ) 0( ) K FWD FWDD
D
e
(10) ( 900/ 2,900) 900( ) 0( ) K FWD FWDD
D
e
(11)Note: K2,200, K2,300, K2,450, K2,600, K2,900 are the K parameter and unique constants for the respective FWD sensor locations. Where
n is the degree of nonlinearity. Example, K2,900 is 527 for deflection bowl generated at test location No. 1 (see Table 4).
The TSD data from Table 2 that have been converted to FWD deflection are presented in Table 4. The deflection bowls generated by the SDM model shows linear elastic behaviour with the degree of subgrade nonlinearity, K2,900
Table 4. Theoretical FWD deflections generated using simplified deflection models.
Conversion of TSD data to FWD deflection using SDM (micron) Subgrade Nonlinearity Location D0 D200 D300 D450 D600 D900 K2,900 1 292 208 152 106 80 53 527 2 301 215 157 110 83 55 529 3 304 217 159 111 84 55 526 4 410 292 213 149 113 74 527 5 473 338 247 173 131 86 528 6 608 434 317 221 168 110 526 7 757 541 395 276 209 137 527 8 899 642 469 328 248 163 527 9 1007 719 525 367 278 183 528 10 1120 800 584 408 309 203 527 11 1067 762 556 389 294 194 528 12 1324 945 690 482 365 240 527 13 1538 1099 802 561 424 279 527 14 1547 1105 807 564 427 281 528 15 2010 1436 1048 733 554 365 528
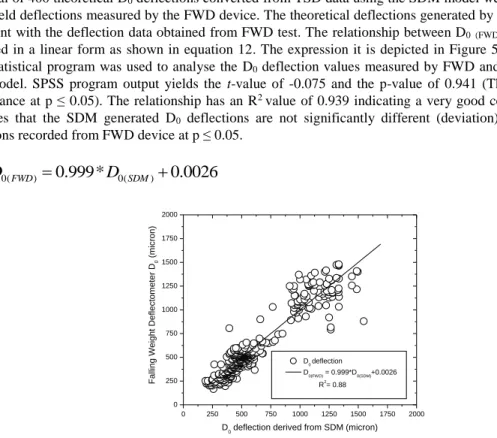
A total of 400 theoretical D0 deflections converted from TSD data using the SDM model were validated with the
actual field deflections measured by the FWD device. The theoretical deflections generated by the SDM are in good agreement with the deflection data obtained from FWD test. The relationship between D0(FWD) and D0(SDM) can be
expressed in a linear form as shown in equation 12. The expression it is depicted in Figure 5. The paired t-test in SPSS statistical program was used to analyse the D0 deflection values measured by FWD and that generated from
SDM model. SPSS program output yields the t-value of -0.075 and the p-value of 0.941 (The result shows
non--significance at p ≤ 0.05). The relationship has an R2 value of 0.939 indicating a very good correlation. The result
concludes that the SDM generated D0 deflections are not significantly different (deviation) from the actual D0
deflections recorded from FWD device at p ≤ 0.05.
0(FWD)
0.999*
0(SDM)0.0026
D
D
(12)Fig. 5. Validation of D0 deflection generated by SDM using actual FWD data. 0 250 500 750 1000 1250 1500 1750 2000 0 250 500 750 1000 1250 1500 1750 2000 D0 deflection D0(FWD) = 0.999*D0(SDM)+0.0026 R2 = 0.88 F alling Weight Def lect omet er D 0 (micron)
6.Conclusions and recommendation
The study shows that TSD deflection can be modelled accurately using SDM model. It is observed that the majority of the pavement sections possess nonlinear subgrade behaviour in the TSD deflection data. The dynamic effects generated by the TSD axle load are likely to be the reason for the pavements to exhibit subgrade nonlinearity. The deflection basins show that the radius of influence zone for the thin granular pavements (with bituminous layer less than 50 mm) is confined within the distance of about 300 to 400 mm from the impact load. The findings from the study are summarised as follows:
x The study shows that relatively small deflections were recorded at the D600 and D900 sensors of TSD. This is due
to the dynamic affect of the TSD load which influences mainly the pavement materials near the impact load at the time of contact; and
x It can be observed that majority of the K2,900 parameters of the TSD deflections are less than 500 and the
deflection bowls are said to possess moderate to high degree of subgrade nonlinearity.
The study has demonstrated the use of SDM model to convert the TSD data to FWD deflections. A comparison between the FWD and TSD data shows a consistent trend in pattern of the maximum deflection and a mathematical model has been established for estimation of FWD deflections using the TSD data. The study also shows that the theoretical deflections generated by the SDM are in good agreement with the actual deflection data obtained from FWD test. Statistical t-test confirms that the SDM generated D0 deflections are not significantly different from the
D0 deflections recorded by FWD device. It is recommended that further study be carried out to compare the SDM
and AUTC techniques for converting TSD data to FWD deflections. The aim is to examine alternative approaches for processing the TSD data for granular pavements with thin bituminous layers.
Acknowledgement
Special thanks to Queensland Department of Transport and Main Roads, Gold Coast, Redland and Logan City Councils, and the Southern Regional Roads Group for the financial support. The research funding is greatly appreciated.
References
Chai, G., Kelly, G., 2008. Structural Characterisation of LTPP Pavements using FWD, 6th International Conference on Road & Airfield Pavement Technology, Sapporo, Japan, 2008.
Chai, G., Kelly, G., Huang, A., Chowdhury, S.H., Manoharan, S., Golding, A., 2015. New Approaches for Modeling Non-linearity of Subgrade in asphalt pavements, Presentation at the 94th Transportation Research Board Annual Meeting, Washington D.C., 11–15 Jan. 2015. Chai, G., Lewer, G., Cancian, G., 2010. A Study of the FWD Deflection Characteristics of Composite and Sandwich Pavements. 11th
International Conference on Asphalt Pavements, Nagoya, Japan, 2010.
Graczyk, M., Zofka, A., Sudyka, J., Rafa, J., 2014. Analytical solution of pavement deflections and its application to the TSD measurements, 26th ARRB Conference-Research driving efficiency, Sydney, New South Wales, 2014.
Hilderbrand, G., Rasmussen, S., Andres, R., 2000. Development of a laser-based high speed deflectograph, Nondstrcutive Testing of Pavements and Backcalculation of Moduli: Third Volume, ASTM STP 1375, S.D. Tayabji and E.O. Lukanen, Eds., American Society for Testing and Materials, West Conshohocken, PA 2000.
Muller, W.B., Roberts, J., 2013. Revised approach to assessing traffic speed deflectometer data and field validation of deflection bowl predictions, International Journal of Pavement Engineering, Vol. 14, No.4, pp. 388–402.
Rasmussen, S., Aagaard, L., Baltzer, S., Krarup, J., 2008. A Comparison of two Years of Network Level Measurements with the Traffic Speed Deflectometer, 2nd European Transport Research Arena, Ljubljana, 2008.
Roberts, J., Ulysses, A., Toole, T., Martin, T., 2014. Traffic Speed Deflectometer: Data Review and Lesson Learnt, Austroads Publication No.AP-T279-14, Austroads Incorporated, Sydney, New South Wales, 2012.