Assessing Italy's Reform Challenges:What Do Growth Accounting and Structural Indicators Say?
57
0
0
Full text
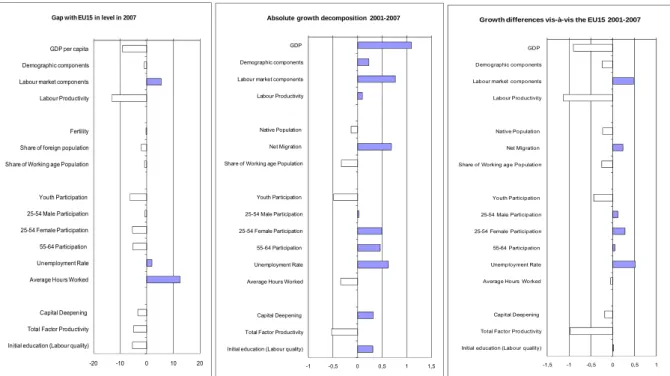
Figure
+5
Related documents