Quantifying the E
ff
ect on the Classification
Maria Filipa Mour˜ao1, Ana C. Braga2, and Pedro Nuno Oliveira3 1 School of Technology and Management-Polytechnic Institute of Viana do Castelo,
4900-348 Viana do Castelo, Portugal
2 Department of Production and Systems Engineering, Algoritmi Research Centre,
University of Minho, 4710-057 Braga, Portugal
3 Biomedical Sciences Abel Salazar Institute, University of Porto,
4050-313 Porto, Portugal
Abstract. Receiver operating characteristic (ROC) curves are a well-accepted measure of accuracy of diagnostic tests using in continuous or ordinal markers. Based on the notion of using a threshold to classify subjects as positive (diseased) or negative (no diseased), a ROC curve is a plot of the true positive fraction (TPF) versus the false positive frac-tion (FPF)for all possible cut points. Thus, it describes the whole range of possible operating characteristic for the test and hence its inherent capacity for distinguish between two status. The clinical severity scale CRIB - Clinical Risk Index for Babies, emerged in 1993 to predict the mortality of newborn at less than 32 weeks of gestation and very low birth weight (<1500gr) [4]. In previous work of Braga [3] this index was reported as showing a good performance in assessing risk of death for babies with very low birth weight (less than 1500 g weight). However, in some situations, the performance of the diagnostic test, the ROC curve itself and the Area Under the Curve(AUC) can be strongly influenced by the presence of covariates, whether continuous or categorical [5], [32], [33]. The World Health Organization and the Ministry of Health, de-fined as ”late pregnancy” that thus occurs in women over 35 years. In this work, using the conditional ROC curve, we analyze the effect of one covariate, maternal age, on the ROC curve that representing the diag-nostic test performance. We chose two age status, less than 35 years old and equal or greater than 35 years old, to verify the effects on the dis-criminating power of CRIB scale, in the process classification using R and STATA software.
Keywords: Conditional ROC (Receiver Operating Characteristic) curve, CRIB (Clinical Risk Index for Babies), maternal age, AUC (Area Under the Curve).
B. Murgante et al. (Eds.): ICCSA 2014, Part III, LNCS 8581, pp. 566–579, 2014. c
1
Introduction
The discriminatory capacity of a continuous marker or diagnostic testX, is usu-ally measured by means of the receiver operating characteristic (ROC) curve [1] [2]. Under the conventional assumption that high marker values are indica-tive of disease, classification on the basis of X of an individual as healthy ( ¯D) or diseased (D) can be made by the choice of a cut-off value c, such that, if X ≥ c, the individual is classified as diseased, and if X < c, the individual is classified as healthy. Hence, for each cut-offvalue,cwe define the true positive fraction,
T P F(c) =P[X ≥c|D] (1) and the false positive fraction,
F P F(c) =P[X ≥c|D]¯ (2) In such a situation, the ROC curve is defined as the set of all pairs for these frac-tions that can be obtained on the variation of cut-offvalue,c, (T P F(c), F P F(c)), c∈(−∞,+∞), or, equivalently, as a function:
ROC(p) =SD(SD−¯1(p)),forp∈(0,1) (3)
where SD andSD¯ denotes the survival functions of X in diseased and healthy
subjects, respectively [29]. The Area Under the ROC Curve (AUC) is considered as an effective measure of inherent validity of a diagnostic test. This index is useful in evaluating the discriminatory ability of a test to correctly pick up diseased and non-diseased subjects and finding optimal cut-off point to least misclassify diseased and non-diseased subjects.
In many practical situations, however, a marker’s discriminatory capacity may be affected by a set of continuous and/or categorical covariates.
1.1 Maternal Age as Covariate
Nowadays, fortunately, few women have a risky pregnancy. However, in cases where there is such a quiet evolution, because there is a chronic illness or be-cause medical or pregnancy related problems arise during the nine months, it is essential a proper and timely monitoring. By definition, there is a high-risk pregnancy when the probability, of an adverse outcome for the mother and/or infant during or following pregnancy and delivery, is increased above the mean baseline risk in the general population by the presence of one or more risk fac-tors. These factors can be divided into maternal and fetal. The maternal factors
include maternal age (less than 15 years and upper 35 years). Women over 35 years old are at greater risk of having a baby with chromosomal abnormalities. The existence of hypertension, diabetes and complications during labor is also more frequent. Below 15 years old, low birth weight and preeclampsia, may occur. There are many works in which the mother’s age is the subject of study, either in association with low birth weight, either because it can be the cause of preterm birth [8], [30], [31]. Most research indicates that very young mothers imply an increased risk of low birth weight and premature births. Few studies have been conducted to older mothers, although this is the current trend in most developed societies. The few studies associate old maternal age to a potential decrease in babys development during pregnancy. Aras [9] presents several studies in which it is concluded that low birth weight depends not only on the age of the mother but also of health care during pregnancy, biological characteristics, race, socio-economic factors, weight gain during pregnancy, among others. Friede et al. [7], in a study to examine the effect of maternal age on low birth weight and infant mortality, used data from young mothers and found a strong association between young maternal age and infant mortality and also with a high prevalence of infants with low birth weight.
2
Empirical Estimators of the ROC Curve
There are many estimators proposed for the ROC curve when it is defined by the expression (3). Assuming that two independent samples, one from diseased population (D) and another from healthy ( ¯D) are avaiable, we may obtain the empirical estimators of survival functions ofX in diseased and healthy subjects,
!
SD andS!D¯, respectively. Thus we can write the empirical ROC curve estimator
by the following expression: !
ROC(p) =SD(! S!−D¯1(p)),forp∈(0,1) (4)
For each possible cut-offvaluec, the fractions of true positives and false positives are obtained by:
" T P F(c) = 1 nD nD " i=1 I(XDi≥c) (5) and ! F P F(c) = 1 nD¯ nD¯ " i=1 I(XDi¯ ≥c) (6)
Thus, the estimated ROC curve is obtained by representing pairs of values (T P F"(c),!F P F(c)), c∈(−∞,+∞) (7)
Similarly, the empirical estimators of survival function of X in diseased and healthy subjects presents in the expression for the ROC curve estimator (4) can be obtained by ! SD(c) = 1 nD nD " i=1 I(XDi≥c) (8) and ! SD¯(c) = 1 nD¯ nD¯ " i=1 I(XDi¯ ≥c) (9)
One of the biggest advantages of using ROC curves is the possibility of compar-ing diagnostic tests, such in medical diagnosis, trough the AUCs obtained from these curves. In this study, we use the statistical approach to the Wilcoxon-Mann-Whitney test to calculate the estimate of AUC index, which summarize each ROC curve in terms of area bellow it. One possibility to test weather the difference between two ROC curves is statistically significant, involves the AUC index. ConsiderAU C1andAU C2the areas obtained from two ROC curves. The
relevant hypothesis to test,H0 is that the two data sets come from ROC curves
with the same AUC:
H0: AUC2−AUC1= 0 vs H1: AUC2−AUC1̸= 0
A method for testing the difference between the two areas for independent sam-ples is based on critical ratio Z [25]:
Z= # AU C2−AU C1 SE2 AUC1+SE 2 AUC2 ∼N(0,1) (10)
3
ROC Curve with Covariates
It is well known that a diagnostic test performance may be strongly influenced by covariates. In such situation, the ROC curve (and its summary indices, such as the area under the curve) may be underestimated if important covariates are neglected. In most studies, paralell to the diagnostic test used to classify indi-viduals in D and ¯D class, one or more covariates may be associated with the classification variable and can provide extra information about the individuals classification and increase the discriminating power of the curve. In such situa-tions, the interest must be focused on assessing the discriminatory capacity of markerXsregarding to the values assumed by the covariate that we represent by Y. The ROC curve in this case can be considered for each value of the co-variate,y. Changes that occurs in curve, due to these values, might mean that
the covariate has effect on the discriminating power of the diagnostic test. If the conditional survival functions ofXDandXD¯, givenY, are denoted bySDY and
SDY¯ respectively, the conditional ROC curve is defined as
ROCy(p) =SDY(SDY−¯1(p)),forp∈(0,1) (11)
The first works developed in the area of adjustment of covariates on the dis-crimination or classification of individuals into classes, are assigned to Cochran and Bliss [10], Cochran [11] and Rao [13]. These publications were focused on the selection of discriminating variables. The rules to adjust covariates requires the formulation of appropriate probability models and are developed later in works of Lachenbrush [12] and McLachlan [14]. However, these works focus on classification rules, providing only background of interest to the study. The first works on adjustment of covariates were from Guttman et al. [15] and Tolsteson and Begg [16]. The first authors, in the context of stress strength models, have obtained the ROC curve as a function of covariates by fitting linear regression models to X (diseased subjects) and Y (healthy subjects), assuming normality with different variances. The adjustment of ROC curves from continuous scales was studied by Smith and Thompson [17], Pepe [18], [19], [20], Faraggi [21], Janes and Pepe [22], [23] among others. The summary measures from ROC curves with adjustment of covariates was studied by Faraggi [21] and by Dodd and Pepe [24].
4
Covariate ROC Curve Adjustment
To assess the possible covariate effects on the ROC curve, two different ap-proaches have been suggested in the statistical literature. TheInduced method-ology proposed by Tolsteson and Begg [16]; Zheng and Heagerty [26]; Faraggi [21], in which the covariates effect on diagnostic test is modeled in the two popu-lations (Dand ¯D) separately. The covariate effects on the associated ROC curve can then be computed by deriving theinduced form of the ROC curve.
Otherwise theDirect method proposed by Pepe [20]; Alonzo and Pepe [28]; Cai [27], assumes a ROC curve with direct effect of the covariates on it. 4.1 Induced Adjustment
Suppose there is a set of covariatesYD associated with the diseased population and a set of covariates YD¯, associated with the healthy population. In many
applications, some if not all covariates are common to both populations, but there is no need for two sets are identical. If αD and αD¯ are scalars, βD and βD¯ are vectors of unknown parameters with YD and YD¯ elements, then the
average values associated with the diagnostic test for the diseased and healthy populations, for certain values of the covariates, can be modeled as [29]
and
µD¯(YD¯) =αD¯+βDT¯YD¯ (13)
The model specification is complete assuming that these average values are normally distributed with standard deviation σD and σD¯, respectively. This
model is essentially the binormal by specifying the population average. Then it follows that the equation of the ROC curve is given by
ROCy(p) =φ !µD(YD) −µD¯(YD¯) +σD¯φ−1(p) σD " , p∈(0,1) (14) The least squares regression can be used to obtain point estimates ofαD,αD¯, βDandβD¯. Substituting these estimates in the above expression for certainyD,
yD¯ values ofYD andYD¯, we obtain the ROC curve for covariates.
4.2 Direct Adjustment
This approach, contrasts with the approach set before. Instead of separately modeling the effect of covariate in the two distributions results of the diagnostic test and then obtains the ROC curve from the modified conditional distributions, direct adjustment model the covariate effects directly on the ROC curve. There are several advantages to the direct modeling approach. Foremost amongst them is that of any parameter associated with the covariate has a direct interpretation in terms of the curve. The heart of this approach is the specification of a suitable model that captures the effect of the covariate on the ROC curve, which allows a flexible and easy interpretation. The flexibility of the model is in terms of how this relationship works in the ROC curve, to preserve the condition that either the domain and the curve lie in the interval (0,1) and that the curve continues to be monotone increasing in this range. The knowledge of least squares method to fit measures of variables, such as diagnostic test, and to evaluate the relationship between his results and the subject diseased status, suggested that the relationship between the ROC curve and the covariate effect was measured. This relationship is evaluated by using Generalized Linear Models (GLM). This methodology, leads the general form of the conditional ROC curve given by:
ROCY(p) =g(Y′β+h(p)), p∈(0,1) (15) where Y is a p-dimensional vector of covariates, β is a p-dimensional vector of unknown parameters, his an unknown monotone increasing function of the F P F s, and g is a known link function, describing the functional relationship between the ROC curve and the covariates. Models such as (15) define the so-called class of ROC-GLMs [29].
The most common link functions are probit, logistic and logarithmic. Together with the advantage of directly evaluating the effect of the covariate on the ROC curve, direct methodology has some other appealing features:
– the ROC curve property of being invariant to monotonic transformation of the test result is preserved,
– any possible interaction between covariates and FPFs is easy to incorporate into the regression model,
– allows modeling the performance parameters and allows the comparison of different classifiers.
5
Application and Results
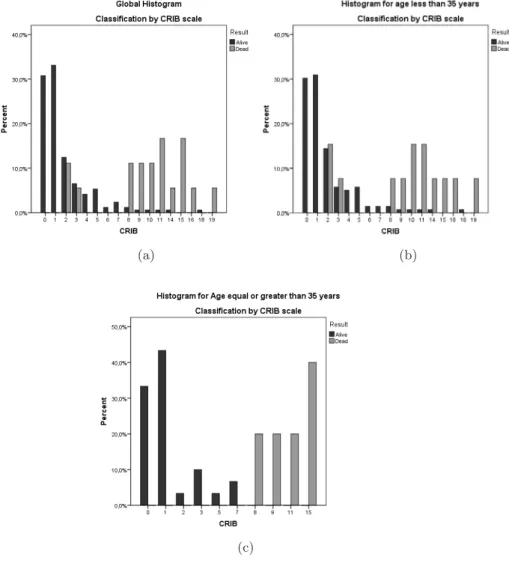
5.1 Study DescriptionIn this work, to check if the age of the mother affects the discriminating ability of the CRIB index, we used a sample of 187 infants of very low birth weight (< 1500gr and/or gestational age < 32 weeks) from a hospital in North of Portugal. Thus, the variableX will correspond to the CRIB, and the covariate of interest will be the age of the mother. We will consider the age of the mother as a binary variable, with reference to the age of 35 years old. So, we will have two categories: age greater or equal than 35 years and younger than 35 years. Of the 187 infants, 152 are newborns from mothers with less than 35 years old and the remaining 35 are newborns of mothers aged 35 years or older. The rating assigned according to the CRIB scale regarding their clinical status was, for the first newborn mothers, 8.55% of the babies classified as ”dead” and 14.29% of the babies on the second group with the same classification. In the sample, 9.63% of babies are classified as ”dead”.
To asses the objective of our study, we choose to apply the direct method, because the advantages listed above.
5.2 Results
We begin by characterizing the distribution of babies, according to the classifi-cation assigned by the CRIB scale, when we consider that the mother’s age has no effect on this classification and then considering this possible effect (Fig. 1). According to this characterization, we obtained the respective empirical ROC curves (Global and separately by mother’s age) with R software, which are shown in Fig. 2.
We compute the AUC, the standard deviation and the confidence intervals for each of the ROC curves plotted above. These values are summarized in Table 1. Obtained the intervals, with 95% of confidence, for the ROC curves, we pro-ceed to its graphical representation to visualize possible dispersion of the pairs of values (1−specif icity, sensitivity). Figure 3 show the ROC curves with the corresponding confidence interval, obtained by the application of R software.
To verify if maternal age has effect on the CRIB scale when used to classify clinical babies status, we used the critical reasonZ. The value computed by this statistic wasZ = 2.28 (p−value= 0.0226).
(a) (b)
(c)
(a) (b)
(c) (d)
Table 1.ROC curves Results
AUC SE 95% IC Lower Bound 95% IC Upper Bound
Global 0.942 0.025 0.8929 0.991
Maternal age less than 35 years 0.9203 0.035 0.8515 0.9891
Maternal age equal
or greater than 35 years 1.000 6.8E-9 1.000 1.000
(a) (b)
Fig. 3.ROC curves and Confidence Intervals 5.3 Direct Adjustment of Covariate with Stata Software
The results above suggest that the impact of maternal age on CRIB scale should be statistically adjusted in the ROC analysis. Stata software, using ROC re-gression, models the ROC curve (CRIB ROC curve) as a function of covariates (maternal age), via GLM. In statistic, the GLM is a flexible generalization of ordinary linear regression that allows for response variables that have error dis-tribution models other than normal disdis-tribution. The GLM generalizes linear regression by allowing the linear model to be related to the response variable using a link function and by allowing the magnitude of the variance of each measurement to be function of its predicted value. We start by computing the graph of the ROC curve conditioned to maternal age (Fig. 4) with correspon-dent AUCs (Fig. 5) and test of equality of those areas (Fig. 6). The AUC for the conditioned CRIB ROC curve and the correspondent confidence intervals ((N) normal confidence interval; (P) percentile confidence interval; (BC) -bias-corrected confidence interval) is shown in (Fig. 7).
0.00 0.25 0.50 0.75 1.00 Sensitivity 0.00 0.25 0.50 0.75 1.00 1−Specificity
(Age < 35 years) ROC area: 0.9203 (Age>= 35 years) ROC area: 1 Reference
Fig. 4.ROC curve conditioned by Maternal Age (from STATA)
Fig. 5.AUCs for ROC curve conditioned by Maternal Age (from STATA) Regarding the ROC curve for the CRIB, conditioned on maternal age, we found that the behavior is identical to that observed in the study described above with R software. The CRIB for age less than 35 year old mother discriminates 92.03% while for maternal age equal or greater than 35 years, discriminates in 100% of cases. We also found that a greater variability in the results is observed for the curve generated from the first data set. When performed the test of equality of the two areas, we found the following results:
Fig. 6.ROC curve conditioned by Maternal Age - comparison test (STATA output)
that leads to the rejection of the null hypothesis.
Fig. 7.AUC for the CRIB ROC curve conditioned by Maternal Age (STATA output) By the results presented in (Fig. 7), we found a discrimination power for the CRIB ROC curve in 93.13% of the babies (AUC = 0.9313) and with a standard deviation equal to 0.0309. The confidence intervals to evaluate the dispersion of the pairs of values (1−specif icity, sensitivity) was also computed.
6
Conclusions
From the estimated values of AUCs for the global ROC curve we may observe that, without considering the effect of maternal age, the CRIB scale discrimi-nates between babies ”alive” and ”dead” in 94.2% of cases. This power, when considering maternal age as covariate, is 92.03% for age less than 35 years old and equal to 100% when maternal age is equal or greater than 35 years. We can see too, that the ROC curve for maternal age less than 35 year old shows greater variability (Table 1) and (Fig. 3). Applied the statistical test previously set out in Section 2 to determine whether maternal age has an effect on the classification of baby’s, when CRIB scale is used, we conclude that there is a significant difference in the performance of CRIB scale when conditioned on ma-ternal age and mama-ternal age equal or greater than 35 years old has effect on the discrimination power of CRIB scale. From the results obtained above, it is apparent that mother’s age appears to affect the discriminatory power of CRIB scale when used to classify babies. For this reason, we consider useful to verify the performance of this scale when conditioned on maternal age by using the ROC-GLM regression models (CRIB ROC analysis with correspondent CRIB ROC curve). The results presented in (Fig. 7) suggest that the performance of CRIB scale decreases when one incorporates the age of the mother in her review (AUC = 0.9313). The standard deviation, in turn, is greater than the standard deviation of the ROC curves obtained without the covariate. Consequently, it also increases the dispersion of the pairs of values (1−specif icity, sensitivity).
Fig. 6 shown the results for comparison test by the STATA software that in-dicated also that maternal age has effect on the classification of babies by the CRIB scale. CRIB scale perform better for maternal age equal or greater than 35 years old.
Motivated by these results we propose as future work, to check if the sex of the babies along with the mother’s age, also have an effect on the classification of infants when using the CRIB scale.
References
1. Metz, C.E.: Basic principles of ROC analysis. Seminars in Nuclear Medicine 8, 183–298
2. Swets, J.A., Pickett, R.M.: Evaluating of Diagnostic System: Methods from Signal Detetion Theory. Academic Press, New York
3. Braga, A.C., Oliveira, P., Gomes, A.: Avalia¸c˜ao do risco de morte em rec´em-nascidos de muito baixo peso: uma compara¸c˜ao de ´ındices de risco baseada em curvas ROC. IV Congresso Anual da Sociedade Portuguesa de Estat´ıstica. Edi-tores: Lu´ısa Canto e Castro, Dinis Pestana, Rita Vasconcelos, Isabel Fraga Alves. Edi¸c˜oes Salamandra
4. Dorling, J.S., Field, D.J., Manketelow, B.: Neonatal disease severity scoring sys-tems. Arch. Dis. Child. Fetal Neonatal 90, F11–F16
5. L´opez-de-Ullibarri, I., Cao, R., Cardaso-Su´arez, C., Lado, M.J.: Nonparametric estimation of conditional ROC curves: application to discrimination tasks in com-puterized detection of early breast cancer. Computational Statistics & Data Anal-ysis 52(5), 2623–2631
6. Metz, C.E.: Statistical Analysis of ROC Data in Evaluating Diagnostic Perfor-mance. Multiple Regression Analysis: Application in Health Sciences. American Institute of Physics 13, 365–384
7. Friede, A., Baldwin, W., Rhodes, P.H., Buehler, J.W., Strauss, L.T., Smith, J.C., Hogue, C.J.R.: Young Maternal Age and Infant Mortality: The role of low birth weight. Public Health Report 102(2) (March-April)
8. Friede, A., Baldwin, W., Rhodes, P.H., et al.: Older maternal age and infant mor-tality in the United States. Obstet. Gynecol. 72, 1527
9. Aras, R.Y.: Is maternal age risk factor for low birth weight? Archives of Medicine and Health Sciences 1(1) (January-June)
10. Cochran, W.G., Bliss, C.I.: Discriminant functions with covariance. Ann. Math. Statist. 19(2), 151–291
11. Cochran, W.G.: Comparison of two methods of handling covariates in discriminant analysis. Annals of the Institute of Statistical Mathematics 16, 43–53
12. Lachenbrush, P.A.: Covariance adjusted discriminant functions. Annals of the In-stitute of Statistical Mathematics 29, 247–257
13. Rao, C.R.: On some problems arising out of discrimination of multiple characters. The Indian Journal of Statistics 9, 343–366
14. McLachlan, G.J.: Discriminant analysis and pattern recognition. Wiley, New York 15. Guttman, I., Johnson, R.A., Bhattacharayya, G.K., Reiser, B.: Confidence limits for
stress-strenght models with explanatory variables. Technometrics 30(2), 161–168 16. Tolsteson, A.N., Begg, C.B.: A general regression methodology for ROC curve
17. Smith, D.J., Tompson, T.J.: Correcting for confounding in analising receiver oper-ating characteristic curves. Biometrical Journal 38, 357–863
18. Pepe, M.S.: A regression modelling framework for receiver operating characteristic curve in medical diagnostic testing. Biometrika 84, 595–608
19. Pepe, M.S.: Three approaches to regression analysis of receiver operating charac-teristic curves for continuous tests results. Biometrics 54, 124–135
20. Pepe, M.S.: An interpretation for the ROC curve and inference using GLM proce-dures. Biometrics 56, 352–359
21. Faraggi, D.: Adjusting receiver operating characteristic curves and related indices for covariates. Journal of the Royal Statistical Society: Series D (The Statisti-cian) 52(2), 179–192
22. Janes, H., Pepe, M.S.: Adjusting for covariates effects on classification accuracy using the covariate-adjusted ROC curve. UW Bioestatistics Workin Paper Series. Working paper 283,http://biostats.bepress.com/uwbiostat/paper283
23. Janes, H., Pepe, M.S.: Adjusting for covariates in studies of diagnostic, screening, or prognostic markers: An old concept in a new setting. UW Bioestatistics Working Paper Series. Working paper 310,
http://biostats.bepress.com/uwbiostat/paper310
24. Dodd, L.E., Pepe, M.S.: Partial AUC estimation and regression. Biometrics 59(3), 614–623
25. Hanley, J.A., McNeil, B.J.: A method of comparing the areas under receiver oper-ating characteristic curves derived from the same cases. Radiology 148, 839–843 26. Zheng, Y., Heagerty, P.J.: Semiparametric estimation of time-dependent ROC
curves for longitudinal marker data. Biostatistics 4, 615–632
27. Cai, T.: Semiparametric ROC regression analysis with placement values. Biostatis-tics 5, 45–60
28. Alonzo, T.A., Pepe, M.S.: Distribution free ROC analysis using binary regression techniques. Biostatistics 3, 421–432
29. Pepe, M.S.: The Statistical Evaluation of Medical Tests for Classification and Pre-diction. Oxford University Press, New York
30. Carolan, M., Frankowska, D.: Advanced maternal age and adverse perinatal out-come: A review of the evidence. Midwifery, doi:10.1016/j.midw.2010.07.006 31. Linda, J., Heffner, M.D.: Advanced Maternal Age How Old Is Too Old? The
New England Journal of Medicine 351, 19
32. Rodriguez- ´Alvarez, M.X., Roca-Pardi˜nas, J., Cardaso-Su´arez, C.: ROC curve and covariates: Extending induced methodology to the non-parametric framework. Sta-tistical and Computing 21, 483–499
33. Gonz´alez-Manteiga, W., Pardo-Fern´andez, J.C., Keilegom, I.: ROC curves in Non-Parametric Location-Scale Regression Models. Scandinavian Journal of Statis-tics 38(1), 169–184