WestminsterResearch
http://www.westminster.ac.uk/westminsterresearch
Semantic Data Pre-Processing for Machine Learning Based
Bankruptcy Prediction Computational Model
Yerashenia, N., Bolotov, A., Pierantoni, G. and Chan You Fee, D.
This is a copy of the author’s accepted version of a paper subsequently published in the
proceedings of the 22nd IEEE International Conference on Business Informatics (IEEE
CBI 2020), Antwerp, Belgium, 22 - 24 Jun 2020 IEEE .
The final published version will be available online at:
https://ieeexplore.ieee.org/Xplore/home.jsp
© 2020 IEEE . Personal use of this material is permitted. Permission from IEEE must be
obtained for all other uses, in any current or future media, including
reprinting/republishing this material for advertising or promotional purposes, creating
new collective works, for resale or redistribution to servers or lists, or reuse of any
copyrighted component of this work in other works.
The WestminsterResearch online digital archive at the University of Westminster aims to
make the research output of the University available to a wider audience. Copyright and
Moral Rights remain with the authors and/or copyright owners.
Semantic Data Pre-Processing for Machine Learning
Based Bankruptcy Prediction Computational Model
1
stNatalia Yerashenia
School of Computer Science and Engineering University of Westminster
London, United Kingdom [email protected]
2
ndAlexander Bolotov
School of Computer Science and Engineering University of Westminster
London, United Kingdom [email protected]
3
dDavid Chan
School of Computer Science and Engineering University of Westminster
London, United Kingdom [email protected]
4
thGabriele Pierantoni
School of Computer Science and Engineering University of Westminster
London, United Kingdom [email protected]
Abstract—This paper studies a Bankruptcy Prediction Compu-tational Model (BPCM model) – a comprehensive methodology of evaluating a company’s bankruptcy level, which combines storing, structuring and pre-processing of raw financial data using semantic methods with machine learning analysis tech-niques. Raw financial data are interconnected, diverse, often potentially inconsistent, and open to duplication. The main goal of our research is to develop data pre-processing techniques where ontologies play a central role. We show how ontologies are used to extract and integrate information from different sources, prepare data for further processing, and enable communication in natural language. Our Ontology of Bankruptcy Prediction (OBP Ontol-ogy) which provides a conceptual framework for a company’s financial analysis, is built in the widely established Prot´eg´e environment. An OBP Ontology can be effectively described with a Graph database (DB). A Graph DB expands the capabilities of traditional databases by tackling the interconnected nature of economic data and providing graph-based structures to store information, allowing the effective selection of the most relevant input features for the machine learning algorithm. To create and manage the BPCM Graph DB, we use the Neo4j environment and Neo4j query language, Cypher, to perform feature selection of the structured data. Selected key features are used for the supervised Neural Network with a Sigmoid activation function. The programming of this component is performed in Python. We illustrate the approach and advantages of semantic data pre-processing, applying it to a representative use case.
Index Terms—semantic data analysis, graph database, ontol-ogy, financial analysis, financial ratios, bankruptcy prediction, computational model, neural network, Prot´eg´e, Neo4j, Python
I. INTRODUCTION
In this paper, we extend our analysis of the application of machine learning (ML) [1] to the dynamics of business. While our previous research set up the conceptual level, proposing a general computational model for bankruptcy prediction, here we address one of the most relevant aspects of data manage-ment – data pre-processing to ensure a more efficient applica-tion of ML-based predicapplica-tion. Using an informal descripapplica-tion, the methodology of ML includes the ”training” stage, where
ML algorithms are trained on some given datasets, and a machine-learning model is generated. At the next stage, this model is populated with an input, some real data to analyse and from these it generates outputs corresponding to the underlying ML algorithms. For example, with the predictive model and prediction algorithms, we will get a specific prediction based on the input data [2]–[4].
However, the quality of ML-based prediction (such as market prediction, bankruptcy prediction, etc.) substantially depends on the quality of prepared data: both the training and the input data. Raw financial data are interconnected, diverse, often potentially inconsistent, and open to duplication.
Inter-connectedness. In financial datasets, there is a high level of relationships between elements. For example,Return on Shareholders Fundsratio (sometimes also calledReturn on Equity – ROE) is responsible for the company’s profitability. It is built from the data taken from two standard financial documents: Income statement (including Profit/Loss before Tax) and Balance Sheet (includingShareholders Funds). Any changes in the values of these two documents’ elements affect the alteration of ROE volume. Since this Ratio is also associated with other numerous profitability ratios, it is challenging to reveal all the relevant connections in a raw dataset, without applying any structuring techniques.
Heterogeneity.To ensure complete and reliable analysis of business data we need to use diverse sources – for example, to recognise the relationship between the quantitative company’s financial records and market news, or new legislation which also affects the stability of the business. Moreover, the data can be presented in various forms: text, tables, graphs, pictures, etc. and can be both qualitative and quantitative.
Format inconsistency and duplication.Identical data can have different presentation formats. For example, a report on business’s profits and losses over a specific period can be called either ”Income Statement” or ”Profit and Loss Account”. In this case, if we program the system to work with
data in one format, it may not work with the data in another format. Accordingly, the link between the terms with similar meaning would be needed. Besides, since the Financial Ratios can be built using similar components, the data can appear in the documentation numerous times with minor alterations.
To enable modern ML algorithms, such as a neural network (NN) [5], to analyse financial data, finding non-linear patterns, there must be a relevant amount and quality of training and input data. The better datasets are prepared, the more efficiently the ML will work. The main goal of our research is to develop such data pre-processing techniques and to integrate these with ML-based prediction methods.
We apply an effective ’semantic data’ analysis, developing further the ’Semantic Database System’ introduced in [1]. Here, ontologies play a central role [6]. While we formally define this term inSection III-A, we note here that ontologies describe the structure of the subject area knowledge explicitly showing the main concepts and relations between them. Using ontologies, we give meaning to the disparate and raw business data, build logical relationships between data in various for-mats and sources and establish relevant context. We will show how ontologies are used to tame the features of the raw data mentioned above.
In this paper we will solve the practical task of integrating the individual components of the Semantic Database System with the graph database (Graph DB)1, Ontology representation
and a Machine Learning based Prediction Engine. The desired integration will be based upon a component-based architecture of the Bankruptcy Prediction Computational Model (BPCM model)and will involve the integration of the following system components and a mechanism enabling data exchange among them:
• aOBP ontology in Prot´eg´e environment2
• a Graph DB for financial data of a company using the formats agreeable with the OBP ontology, and,
• a NN that uses the structured data from the Graph DB
for training and as its input.
We will test and validate the viability of the developed prototype based on the data of a real company. The prototype’s architecture is flexible enough to allow for further experimen-tation aimed at tuning and advancing the system.
The structure of this paper is as follows.Section IIcontains a critical review of related literature. Section III presents an account of features of the Financial Data Preparation process in ML: we describe relevant aspects of data processing in
Section III-A and the Methodology of tackling the issues in
Section III-B. The subsequent sections introduce the BPCM model:Section IV gives the details of the overall architecture and the implementation details are provided in Section V. In
Section VIwe test these developments and the assumptions of the paper by applying our approach to build a BPCM model 1https://neo4j.com/neo4j-graph-database/, this and other web links the
paper refers to were last checked for the accessibility on the 23rd March 2020
2https://protege.stanford.edu
for a specific Use Case with the financial data from two UK companies. Finally, inSection VIIwe provide conclusions and discuss open issues.
II. RELATEDWORKS: DATAPRE-PROCESSING
Data collected for the subsequent processing must meet certain quality criteria. Data quality is a generalised concept that reflects the degree of data suitability for solving a specific problem [7]. Following ISO 9001, the main quality criteria are completeness, reliability, accuracy, consistency, availability and timeliness [8]. Thus, data pre-processing is an essential sub-step of the financial data analysis process.
The input data obtained from corporate storage do not always have a clear structure. The initial data are often distorted and unreliable: they may contain values that go beyond the limits of acceptable ranges (noise), abnormal values (outliers), as well as gaps (lack of values) [9]. Besides, contrary to popular opinion, ML does not work autonomously and independently. For the adequate functioning of this tool, like any IT tool, clearly defined source data and instructions are needed. It is not possible to load into the ML algorithm all the accumulated data of different formats and simply get the correct results on the output.
One of the critical stages in creating a computational model that precedes the application of ML methods is the stage of data pre-processing, which includes various types of transformations. It is not by chance that CRISP-DM, SEMMA and other Data Mining standards (seeSection III-B) consider data preparation as a separate Data Mining phase.
Our analysis of several sources (such as [10], [11], [5], [12], [13], etc.), showed that the data pre-processing process should include the following tasks:
Feature Selection. Select only the most indicative signs (for example, financial ratios) and shift out the rest, taking into account their relevance for data analysis, quality and technical limitations (e.g. volume and type).
Data cleaning. Remove typos, errors, incorrect values (for example, the number in a string parameter, etc.), missing values, exclusion of duplicates and different descriptions of the same object, restore the uniqueness and integrity.
Feature generation.Derive features and convert them into data vectors for the ML model, as well as data transformation to increase the accuracy of ML algorithms.
Integration. Merge data from various sources (information systems, tables, protocols, etc.), including their aggregation, when new values are calculated by summing information from many existing records.
Formatting.Apply syntactic modifications that do not change the meaning of the data, but are required for modelling tools, for example, sorting in a particular order or removing unnecessary punctuation marks in text fields, trimming long words, rounding real numbers to an integer, etc.
Hence, before applying ML algorithms, data must be con-verted to a tabular representation, which is most common in ML and Data Mining [5]. Having received a file with raw data, for example, in CSV format, the analyst first looks at it
to understand the nature of the records (rows), as well as the meaning, type and range of values of the attributes (columns). Then the data scientist defines a dataset, and selects data that is potentially related to the ML hypothesis being tested.
Next, improve the quality of the dataset by cleaning the data using built-in data software tools to identify and remove errors and inconsistencies of data [14]. Incorrect, duplicated, or lost information can cause inadequate statistics and inaccurate conclusions in the context of the business.
For numerical variables, data normalisation is applied to bring the datasets to the same area of change and use them together in the same ML model [15]. Normalising data means converting the original numerical values to new ones in the range from 0 to 1, based on the initial minimum and maximum. Having defined independent predictors and target charac-teristics based on them, the data scientist checks the re-ceived dataset again to eliminate multicollinearity of factors to decrease the dimension of the ML model and prevent its retraining [16]. For this, Feature Selection methods are used. Integration and formatting of the dataset, as a rule, are performed using DBMS tools for data or other tools designed for such operations (for example, SAS [10]). In our case, we are going to use Graph DBs.
All these actions, from sampling to data sorting, are carried out several times until the dataset becomes suitable for mod-elling, taking into account the characteristics of the selected ML algorithms and the hypothesis being tested.
It is proven that data pre-processing has a positive effect when using a NN: [17], [18], [19], [15]. However, it should be noted that earlier studies of bankruptcy prediction mechanisms did not take data pre-processing into account.
III. DATAPREPARATION INMACHINELEARNING
ANALYSISFINANCIALDATA A. Problem Set-up
As mentioned in the introduction, for ML algorithms data pre-processing and cleaning are essential tasks that must be completed before the dataset can be used to train the model [5].
To tackle these issues, we further develop the semantic approach introduced in [1], where the concepts of Graph DB and OBP Ontology were defined. We resolve the crucial problem of finding a software solution to integrate these components into a system which is able to perform both data pre-processing for the bankruptcy prediction and the ML-based prediction itself.
B. Methodology
Mathematically, an ML problem – classification, regression, or clustering – is a standard optimisation task with constraints. To prevent the solution of the problem turning into an endless search, and to make a predictable process, it is necessary to adhere to an explicit algorithm. Knowledge Discovery in Databases (KDD), Cross-Industry Standard Process for Data Mining (CRISP-DM) andSEMMAcan be considered as standards that detail the steps to carry out data mining [20].
The results of [1] showed that the concepts of Graph DB, OBP Ontology could be used to analyse the preliminary assessment of the financial data. They are compliant with the essence of these standards.
Having already a good understanding of the domain for which we are conducting data mining and with no prospects to deploy the findings of the data mining at this prototype stage, we decided to use the SEMMA process of data mining for the reason that it more closely reflected the steps we thought would be relevant at this stage of the project, such that it excludes the more business-oriented steps present in the KDD and CRISP-DM processes. SEMMA is positioned as a unified approach to the iterative process of data mining [21], and despite not imposing any strict rules, it contains clear methods for assembling a project concept, its implementation, and evaluation of the results [20], [22]. According to SEMMA, an analytical project consists of five main steps that are carried out sequentially [23]:
Data sampling. Generate the initial dataset, large enough to contain sufficient information for the subsequent analysis, yet restrained to be used effectively. In our case, the dataset concerns company’s financial records and will be used later for bankruptcy prediction purposes.
Research. Identify associations, perform visual and inter-active statistical analysis, and gain an understanding of data by detecting expected and unforeseen relationships between variables, as well as deviations using data visualisation. Our main idea here is to use the semantic approach utilising ontologies which reflects the meaning by identifying the data structure and the relationships between its components. Later, in the paper, we will show how the ontology we are developing explicitly reflects these.
Modification. Select features, create and transform variables in preparation for modelling. Our main idea here and for storing data is to use a Graph DB with its own, built-in query language.
Modelling. Construct and process data models. We are going to use an ML method of neural network.
Assessment. Compare the results with the planned indicators or already known information, and analyse the reliability and usefulness of the created models. Our approach here is to test the model using real financial data of UK companies as an input; in other words, we are building a use case for the assessment of the proposed approach.
In practice, this SEMMA standard is implemented in the SAS Data Mining Solution environment3. However, we
pro-pose this standard as the basis for the development of the BPCM model (see Section IV) applying the new semantic methods of information research and modification.
Formal semantic approach. Modern information systems deal with complex problems associated with managing the flow of incoming raw data – automatic classification and automatic indexing, prompt and adequate distribution of new information, transferring, storage and search for data. The
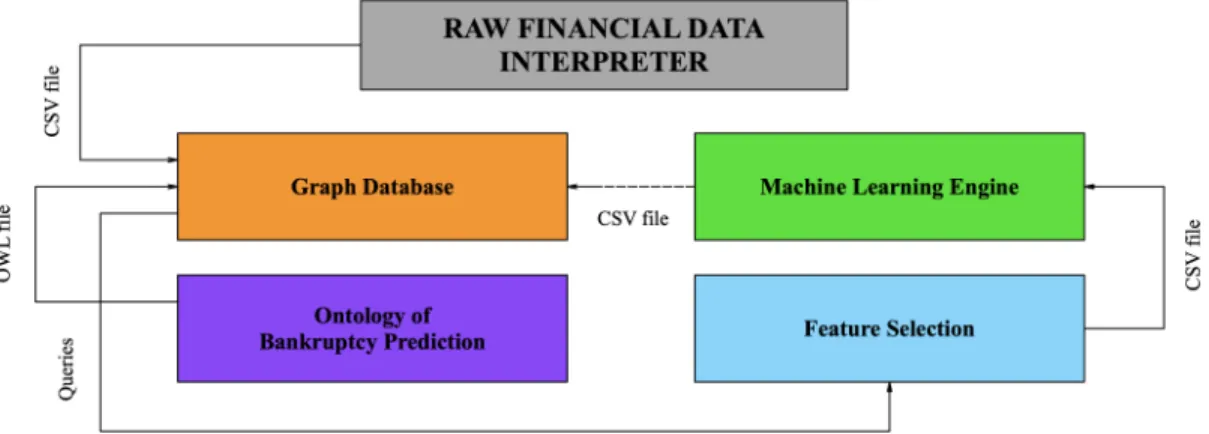
Fig. 1. BPCM Components and Dataflow
semantic approach utilises logical models to describe concepts and manage them, in particular, representing data in the form of ontologies allows to avoid ambiguity in the interpretation of data by various systems.
Definition III.1 (Ontology, Taxonomy). An Ontology is the description of the subject area conceptual knowledge, where sets of concepts and relations determine the general scheme for storing data presented as sets of statements about instances of concepts or ontology axioms [6].
A Taxonomy is a classification hierarchical structure [24], where the relationships between taxons are of the type – superclass-subclass-individual object; it is an integral part of any ontology.
Semantic approach processes information based on its meaning, specifying data inResource Description Framework (RDF) or Web Ontology Language (OWL) – languages with formal semantics [25]. It transforms the information space into the space of metadata – ‘data about data’ [26].
We create a formal ontology in the Prot´eg´e environment
which is a free, open-source tool for editing ontologies and knowledge management systems4. It should be noted that we
worked with Protege to create OWL files only, so in the long run, it doesn’t matter what ontology development tool is used. Both the Graph DB and the ontology approach effectively deal with highly-connected financial data [1]. Our idea is to use an ontology structure as the foundation for the Graph DB, which is supposed to store the data contextually and to process it using a built-in Graph DB query language.
Using OBP Ontology structure as a framework for data, we build a Graph DB for the BPCM model in Neo4j en-vironment5. This allows us to import the ontology into the
Graph DB, preserving the semantic relations between its nodes. The ontology can also be visualised, enabling easy identification of relations. The Graph DB search is highly efficient in comparison to relational databases [27], especially
4https://protege.stanford.edu
5https://neo4j.com/neo4j-graph-database/
when dealing with highly connected data6 – a useful feature
to work with more complex data in future developments. Its native Neo4j’s query language, Cypher simplifies managing the ontology, represented in Neo4j allowing the retrieval of a node based on its relations to other nodes7. For example, it is possible to retrieve a node containing an element of Financial Statements value based on its role in calculating a Financial Ratio.
IV. SYSTEMARCHITECTURE
Figure 1 reflects a component-based generic architecture of the Bankruptcy Prediction Computational Model which consists of the following components: Raw Financial Data Interpreter;OBP Ontology;Graph DB;Feature Selection; and
Machine Learning Engine. In Figure 1, we also describe the following dataflow. The interpreted raw financial data collected from the companies’ standard database are subsequently stored in a convenient form – Graph DB in the Neo4j environment. Our Neo4j graph uses the OBP Ontology as the framework for data pre-processing and feature selection from the analysis of Ratios, Elements of Financial Statements, etc., and the relationships between them. The selected features are essential for the subsequent ML-based prediction.
To make our approach mathematically rigorous, we formally define a graph-based ontology representation in the form of a Labelled Graph. Our intuition here is as follows – nodes and edges of the graph structure would reflect the ontology structure while we will use a dedicated language to label graph nodes. Informally, labels will allow us ‘to keep track of the data management process’ – labels evolve from just an ‘abstract container’ for a specific value to those containing concrete data. Subsequently, we define an OBP Ontology template graph where nodes are labelled by these ‘abstract containers’ (definition IV.2) and an OBP Ontology full graph (definition IV.1), where these ‘abstract containers’ are filled with the values gained from the concrete financial data.
6
https://neo4j.com/business-edge/connected-data-cripples-relational-performance/
7
Definition IV.1(OBP Ontology full graph). AnOBP Ontology full graph is a labelled graph G = < V, E, L > where V
is the set of vertices, E is the set of edges, and L is the set of labels value:i, whereiranges over the real values taken from a company dataset. The label of the formvalue: 0is a constant meaning ‘the value is not yet identified’.
Definition IV.2 (OBP Ontology template graph). An OBP Ontology template graph is a labelled graph which, as the full graph, contains a full set of vertices, edges, and labels exported from OBP Ontology, where the values in labels are not identified. In other words, it is a graph which contains no information about a particular company.
When the template graph containing the ‘generic’ ontology information is created, it should be filled with the data – in this way we transform a template graph into the full graph.
The OBP Ontology and the Graph DB are integrated to form a core of the computational model – the ‘Semantic Database System’. It is a vital part of the model, which ensures the efficiency of data pre-processing, by selecting, structuring and giving meaning to raw financial data. The attributes used to train the model have a big impact on the quality of the results. Uninformative or poorly informative features may reduce the effectiveness of the model. Therefore, the process of selecting features that have the closest relationship with the target variable (bankrupt, not bankrupt) is performed using the built-in query language Cypher. Fbuilt-inally, fbuilt-inancial analysis usbuilt-ing selected key features can be carried out through ML Engine. In our use case, we use a feed-forward NN with the Sigmoid activation function created in Python.
V. SYSTEMIMPLEMENTATION A. Developing an OBP Ontology in Prot´eg´e
The composite Ontology of Bankruptcy Prediction content is based on the IFRS Standards8 and the UK Companies
Act 20069, which sets the principles for the preparation and
analysis of financial statements.
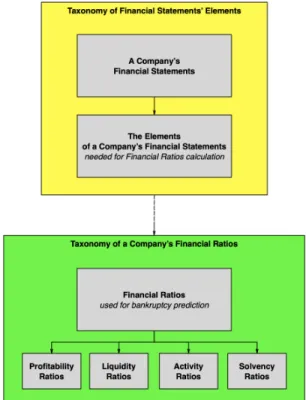
To create the OBP Ontology, we initially define an informal conceptual map shown in Figure 2 and then formal repre-sentation of ontology (OWL file). The upper part (yellow) of the OBP Ontology represents the structure of the Elements of a Company’s Financial Statements (e.g. Turnover, Operating Cash Flow, Current Liabilities, etc.), which are taken from a company’s financial records (Cash Flow Statement, Income statement, Balance Sheet). The lower part (green) contains knowledge about the Ratios that characterise the financial con-ditions of a company. Currently, the OBP Ontology includes 14 indicators that are most often used in bankruptcy prediction models: Return on Capital Employed, Liquidity Ratio, Cash Flow Coverage, etc. The upper and lower parts of the OBP Ontology are interconnected by various types of relationships that determine the nature of the dependencies of Financial Statements’ Elements and Ratios.
8https://www.ifrs.org
9http://www.legislation.gov.uk/ukpga/2006/46/contents
Fig. 2. OBP Ontology Framework
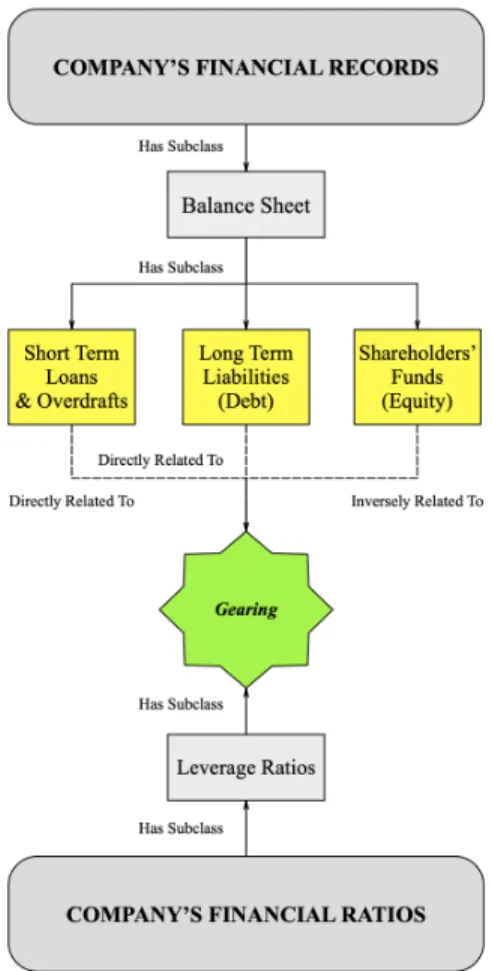
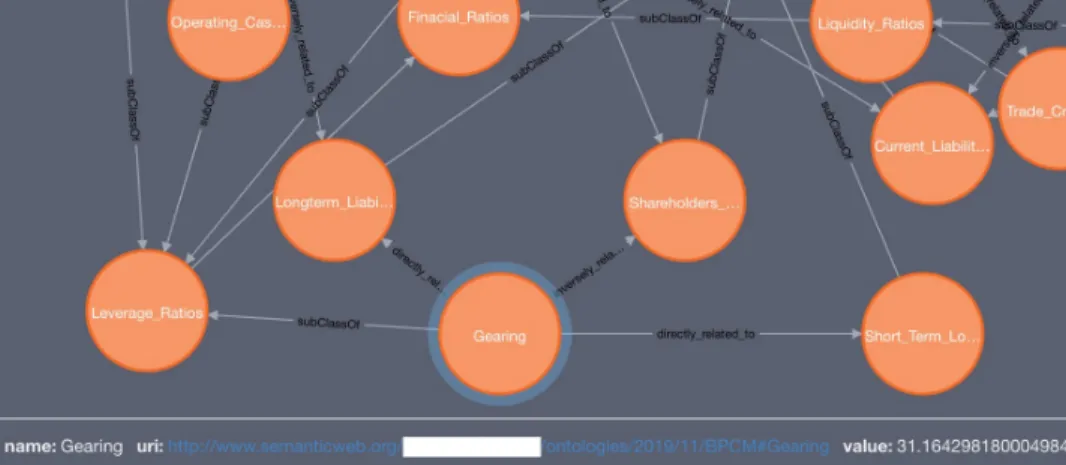
Noting that the structure of the ontology is a graph, we illustrate these types of the OBP Ontology interconnections by an example of one of its paths – the components of theGearing
Ratio (see Figure 7). Gearing is responsible for the balance of borrowed and own funds. High Gearing may potentially indicate extreme credit risk. As seen in Figure 7, this Ratio is calculated using three Elements of Financial Statements – Short Term Loans & Overdrafts plus Long-Term Liabilities, divided by Shareholders Funds, all of which are components of a company’s Balance Sheet.
Once the structure is created, the next step is to build an OBP Ontology in a software environment and generate an OWL file. Here we utilise Prot´eg´e. The composite OBP Ontol-ogy is divided into two parts: data from accounting documents and financial ratios. These two parts are hierarchical class taxonomies with one type of relationship between components – a SubClass of (SCO). Figures 4 and 5 show the resulting class and subclass trees of the two taxonomies.
Note that at this stage, the OBP Ontology has a simplified structure and contains only quantitative indicators. In the future, we plan to expand it by adding various types of input data, which will improve the effectiveness of the analysis of the financial condition of the company. Moreover, we also intend to take into account historical financial data, which will allow the BPCM model to conduct time-series analysis. Also, creating taxonomies, we did not specify data attributes. It is assumed that the data attributes are ”empty containers” for information about the indicators of a particular company (such as the value of the Financial Statements’ Elements
Fig. 3. Ontological Path of Gearing Ratio Components
in a given year, the value of the Elements in the past few years, the industry normative value, etc.). These values will be subsequently filled with data in a Graph DB see Figure IV. Our software solution reflects the limitations of the Neo4j environment. At the moment, it is problematic to automat-ically transfer a full-fledged OBP Ontology (in the OWL format) as a graph in Neo4j, since this environment does not recognise data attributes converting all communications other than hierarchical into separate nodes. To tackle this, we adopt the approach of identifying in the OBP Ontol-ogy ‘least unaffected’ parts which allows us to move them to the Graph DB without any manual editing. Two OWL files containing Taxonomy of Financial Statements’ Elements (’BPCM ontology part 1.owl’) and Taxonomy of Financial Ratios (’BPCM ontology part 2.owl’) are used to create the skeleton of the BPCM model Graph DB in Neo4j.
B. Developing a Semantic Graph Database in Neo4j
The first step in creating a Neo4j Graph DB for a company is to transfer the OBP Ontology OWL files made in Prot´eg´e into Neo4j. Each part of the OBP Ontology is imported using the following code in Cypher10:
CALL semantics.importOntology("url",
10https://neo4j.com/docs/labs/nsmntx/current/importing-ontologies/
Fig. 4. Prot´eg´e Environment: Taxonomy of Financial Statements’ Elements used in Bankruptcy Prediction
Fig. 5. Prot´eg´e Environment: Taxonomy of Financial Ratios used in Bankruptcy Prediction
"Turtle", { subClassOfRel: "subClassOf" });
where ”url” is substituted with a web address to each ontology file and the ”subClassOfRel” option is specified as ”subClassOf”. This improves the readability of the ontology as we replace the default subclass relationship labels of ”SCO” to ”subClassOf”.
Further, the non-hierarchical connections between the El-ements of a Company’s Financial StatEl-ements and Financial Ratios taxonomies are created manually using Cypher. For example, to show the relationship between Gearing Ratio and the Financial Statements’ Elements, which are used to calculate it, we utilise
gear, f, i, j
Overdrafts, Long Term Liabilities, and Shareholders Funds. The relevant Cypher command is:
Create (gear)-[: directly_related_to]->(f) Create (gear)-[: directly_related_to]->(i) Create (gear)-[: inversely_related_to] ->(j)
Now we have an abstract Graph DB which can be filled in with a company’s data. Each node of the upper taxonomy (”Element of a Company’s Financial Statements”) should contain a node attribute called: ”value”, which is supposed to reflect the financial data from a CSV file taken from the traditional database which a company usually uses for keeping its business data. To load the values from the CSV file, we first specify the Elements of Financial Statements nodes and give them variable names so that we can reference them later.
MATCH (f:Resource {name: "Short_Term_Loans_&_Overdrafts"}) MATCH (i:Resource {name: "Long_Term_Liabilities"}) MATCH (j:Resource {name: "Shareholders_Funds"})
Next we use variable names to set the attribute values of the nodes with the row containing the Element of Financial Statements values in the CSV file, choosing the values by matching the node label with the column name in the CSV file. SET f.value = toFloat(row.Short_Term_Loans_and_ Overdrafts) SET i.value = toFloat(row.Long_Term_Liabilities) SET j.value = toFloat(row.Shareholders_Funds)
Thus, the quantitative data from the CSV file containing a company’s records are transferred to Neo4j as ”value” attributes of corresponded nodes. The next step is to calculate the “value” attributes of the Ratios by using built-in math formulae. The formula of Gearing Ratio can be shown as:
MATCH (gear:Resource {name: "Gearing"}) SET gear.value =
(-(stlao.value + ll.value) / sf.value) * 100
RETURN gear.value;
It should be noted that Ratio formulas were taken from Fame Bureau Van Dijk (Fame)11, to subsequently compare the obtained results with the corresponding ready-made data in Fame.
Now a company’s Graph DB is ready to be used for Feature Selection and analytical purposes. At this stage of research, we have only simplified OBP Ontology which contains a
11https://fame.bvdinfo.com/
limited number of Features (Ratios), but this is sufficient for the purpose of the paper. We leave as an open question of how the Graph DB and OBP Ontology components can be effectively used to improve Feature Selection. However, there are solid grounds to believe that the Feature Selection can be provided with the Cypher queries, i.e. an additional code with filtering, sorting, searching, or merging queries can be added to the main code, so the required selection can be made automatically. Besides, the ML classifier (such as a NN we use) can be looped with Graph DB component (shown as a link in Figure 1). Similar to the concept of back-propagation, the information about the weights of each Ratio can be transferred to the Graph DB, to select only those features with the relevant weights (correlation-based technique).
Finally, the structured and selected Features (Ratios) are transferred to the Python environment as a CSV file – an input data for the NN. To export the values of the Ratios as a CSV file, we first construct a query that finds the nodes containing the values of the calculated ratios and returns the values of those nodes under an alias.
WITH "MATCH (...),
(k:Resource {name: ’Gearing’}), (...), (...)
RETURN (...),
k.value AS Gearing, (...), (...)
The aliases would function as column names for the ratio values in the exported CSV file. After the export function has been called, it will return the file name and whether the function managed to run to completion12.
"AS query
CALL apoc.export.csv.query
(query, "Ratios_Export_NN.csv", {}) YIELD file, done
RETURN file, done;
C. Developing a Neural Network in Python
After the data have been structured, selected and saved in a convenient format by means of the Neo4j Graph DB, we can proceed directly to the data analysis – the bankruptcy prediction of a company. Determining the financial conditions of companies is a solution to the classification problem, i.e. assigning of available data samples to specific classes [28]. At the moment, theML Engineof the BPCM model is equipped with a NN program written in Python.
Feed-forward (perception) Neural Network is a common approach to approximating functions, which can be used as classifier [29]. We create a network which has a direct signal transmission, so signals travel from inputs through hidden elements and eventually arrive at output elements. In our case, there are two classes of output: [0.] – a company with a stable financial position, [1.] – a bankrupt company.
12
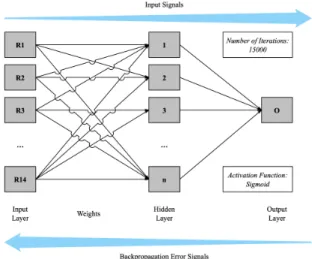
In Figure 6 we provide the architecture of the NN for the BPCM model, where R1, R2, R3, ..., R14 – are the financial ratios of the company, and ‘0’ – is the output of the NN.
Fig. 6. The Architecture of the BPCM Neural Network
For supervised network training, it is necessary to prepare a set of training data: examples of input data and their corresponding outputs. For the training data, we used
• a CSV file with data from 14 ratios of some companies. The financial situation of these companies was already defined according to the auditors’ reports.
• a CSV file with the result of the selected companies status
containing values of 0 or 1.
Next, we train the NN, searching for a set of weights, which allows the input signal after passing through the network to be converted to the corresponding output. Each input signal passes through a connection having a specific weight. Subse-quently, the weighted sum of the inputs and the activation value of the neuron is calculated. The activation value is converted using the activation function. For the analysis of financial data, a Sigmoid activation function can be used [30]. It displays only numbers in the range [0, 1].
The Sigmoid (logistic) function is a smooth monotonous non-linear S-shaped function that is used in NN to introduce some non-linearity into the network, but not changes the result of its operation too much [7]. One of the reasons why the Sigmoid function is used in NN is a simple expression of its derivative through the function itself. This can significantly reduce the computational complexity of the method of back-propagation of errors, making it applicable in practice. In Python, the Sigmoid function can be presented as:
d e f s i g m o i d ( s e l f , x ) :
r e t u r n 1 / ( 1 + np . exp (−x ) )
The activation function returns an output signal of the neuron. To minimise the error of the multilayer perceptron and obtain the desired output, an iterative gradient algorithm is used – the method of back-propagation of the error [31]. The main idea of this method is to propagate error signals from the network outputs to its inputs, in the direction opposite to the
direct propagation of signals in normal operation [30]. Thus, the errors will be taken into account during the next iteration. When applying the back-propagation method, the derivative of the activation function must be found.
We utilise a perceptron NN in combination with the back-propagation algorithm as it is one of the most popular methods for assessing bankruptcy of companies (for example [32], [33]). The NN turns out to be a more efficient classifica-tion method than statistical methods (regression) because NN generates a fewer number of regression models (one iteration equals one regression). In our NN there are 15000 iterations. During the testing of the quality of the NN, the financial ratios of one company, which are not part of the training dataset, were used as input data. Once the NN has passed the testing, the network is ready for use. As an input source, a file with examined company ratios is used, which was exported in CSV format from Neo4j (’Ratios Export NN.csv’).
The ”DictReader” class from the CSV module in The Python Standard Library was used to read the row containing the ratios in the CSV file. We identify individual Ratio values by specifying the column name of the Ratio, and store in program variables. These variables form an array passed as input for the Sigmoid function to perform computations. The NN program written in Python returns values [0.] or [1.].
In our research, we used standard NN algorithms. In the future, we plan to elaborate the developed NN, adding a more sophisticated algorithm, which could describe the company’s position in more details, rather then stating if the company is bankrupt or not. Besides, we intend to supplement ML Engine with a number of different methods, such as Support Vector Machines, Decision Trees, Genetic Algorithms [3], etc.
VI. USECASE
Collecting Companies’ Data.To explore our approach in a real-life environment and give a better understanding of the methodology presented, we apply the developed software solution of the BPCM model to analyse a bankruptcy level of two companies referred to as Company A and Company B (for ethical reasons, we refer to these companies anonymously).
According to the Companies House website13 Company A
is a private limited company of medium size with a turnover of around £25,500k. In 2018 it made a loss of around £1,100k. The independent auditors report states that the company has notable problems with their financial sustainability, and there is an extremely high risk of going bankrupt. Besides, the auditors concluded that the company needs significant addi-tional funding and changing management strategy, including ongoing cost controls. Company B is also a medium-size private limited company. As stated by its Annual Report given in the Companies House website, its turnover is around £8,800k. Independent auditors found the financial position of the company as sustainable. Company B had quite a successful year; the profit comprised above £1,200k.
Fig. 7. Part of a Neo4j representation graph with Gearing Ratio Components ontological path
The financial data of Company A and Company B including the Elements of Cash Flow Statement, Income statement and Balance Sheet were taken from Fame Bureau Van Dijk database and saved as CSV files – ’Company A Fin Elements.csv’ and
’Company B Fin Elements.csv’. (In the real conditions a company’s data can be taken from the company’s database and should be saved as CSV file.)
Model Approbation.Once the dataset needed for the anal-ysis of each company is collected, it is exported to the template Neo4j Graph DB as the ”values” of the particular nodes (”Elements of Financial Statements” – upper taxonomy). There is no need to create Graph DB and OBP Ontology from scratch in every new case, as they represent the general framework for companies data pre-processing. Using the given values of Financial Statements’ Elements, the system automatically calculates the Financial Ratios of Company A and Company B. The obtained results match with the calculations provided in Fame, so the system works correctly. A part of a Graph DB for Company A with calculated Gearing ratio ”value” attribute is presented in Figure 7.
Further, the data with the company’s Financial Ratios can only be exported from Neo4j as’Ratios Export NN.csv’file. This file is used as Input Data in the already created NN. For the training data, the ’Training Data 2019 45.csv’ file with 14 Financial Ratios values of 45 UK medium-sized companies can be used. This data was taken from Fame database as well. The bankruptcy level of these companies was evaluated based on auditors reports. 18 out of 45 companies are bankrupt; the rest have a satisfiable financial position. File
’Training Output 2019 45.csv’ contains the training output: 18 companies – [1.], 27 companies – [0.].
After exporting these datasets to the NN, we have the following results: for Company A, it is [1.], which means the company is bankrupt, and for Company B – [0.], which means the company is stable. Both conclusions resemble the expert’s opinion, which approves the accuracy of the NN built.
VII. CONCLUSIONS ANDFUTUREWORK
This paper illustrates the efficiency of the ‘semantic data” analysis applied to business data. It proposes an effective
software solution integrating individual components of the ‘Semantic Database System’ introduced in [1] – Graph DB, OBP Ontology, and ML-based Prediction Engine. This has been achieved by
• creating a formal conceptual representation of the OBP Ontology through using Prot´eg´e environment,
• introducing a formal framework for the graph-based representation of the OBP Ontology,
• implementing a Graph DB for financial data of a company in Neo4j environment using file and input data values,
• developing a NN in Python which uses the structured data from the Graph DB as its input, and
• establishing a mechanism to transfer the data between the components of the system: from Prot´eg´e to Neo4j and then from Neo4j to Python NN.
The developed system has been applied to analyse the data of two UK companies taken from the Fame Bureau Van Dijk database. Our experiments have shown the correctness and efficiency of the system.
The underlying system’s architecture is component-based to foster flexibility and elasticity – the existing components could potentially be substituted by ‘equivalent’ elements, for example, a different Graph DB. Moreover, new components (modules) could be plugged in – for example, those to analyse and mine business documents based on AI algorithms could be substituted with new components that can add more semantical values to the data in use.
The developed prototype is fully functioning and allows experimentation aimed at tuning and advancing the system. The proposed software solutions enable interested researchers (or even practitioners) to assemble similar systems, following the presented methodology. In fact, this paper fulfils several tasks of the road map presented in [1]: it has significantly improved the structure of the OBP Ontology by proposing a novel formal approach for OBP Ontology graphs as labelled graphs and by creating its formal, conceptual representation through OWL/RDF languages. It further enhanced the seman-tic database, and, finally, it solved the problem of the data exchange between the structural parts of the Semantic DB.
model, the outcome it gives is not detailed. The fact that the response variable is binary is based on the Sigmoid activation function choice. To attain the higher specification level, the model should distinguish more classes of companies’ financial positions rather than only two. Furthermore, it should identify and output the particular weak points of companies’ financial statuses. The other limitation of the proposed solution, at this stage, is that the conducted financial analysis is taken out of the environmental context, i.e. the external factors (political, economic, social, technological, environmental). As a result, for example, market rates, interest rates, inflation, etc. are not considered as input parameters.
In the future, we will investigate how other ML techniques for the prediction purposes can be plugged in and their effi-ciency. We will also study the supplement the OBP Ontology with new components taking into account both qualitative and quantitative financial data as well as external factors and how to utilise Graph DB to optimise feature selection. In the latter task, we will, in particular, look at the various techniques of using the query language as the basis to select the relevant input data for the ML component, e.g. partitioning of the graphs, creating subgraphs, etc. Furthermore, we will examine the issues of extending the Graph DB with the data from the ML Component to use this information for the correlation-based feature selection technique. Finally, the results of the paper open the perspective to incorporate the semantic text mining techniques to tackle the issue of searching the relevant information as input data for the system from various financial documents.
VIII. ACKNOWLEDGEMENT
We are grateful to Dr Bijan Hesni, Prof Andrei Kuznetsov
and to the anonymous reviewers for their useful comments and suggestions to improve the paper.
REFERENCES
[1] N. Yerashenia and A. Bolotov, “Computational modelling for bankruptcy prediction: Semantic data analysis integrating graph database and finan-cial ontology,” in2019 IEEE 21st Conference on Business Informatics (CBI), vol. 1, pp. 84–93, IEEE, 2019.
[2] H. Son, C. Hyun, D. Phan, and H. Hwang, “Data analytic approach for bankruptcy prediction,”Expert Systems with Applications, vol. 138, p. 112816, 2019.
[3] H. A. Alaka, L. O. Oyedele, H. A. Owolabi, V. Kumar, S. O. Ajayi, O. O. Akinade, and M. Bilal, “Systematic review of bankruptcy prediction models: Towards a framework for tool selection,”Expert Systems with Applications, vol. 94, pp. 164–184, 2018.
[4] D. Zhao, C. Huang, Y. Wei, F. Yu, M. Wang, and H. Chen, “An effective computational model for bankruptcy prediction using kernel extreme learning machine approach,”Computational Economics, vol. 49, no. 2, pp. 325–341, 2017.
[5] J. Qiu, Q. Wu, G. Ding, Y. Xu, and S. Feng, “A survey of machine learning for big data processing,” EURASIP Journal on Advances in Signal Processing, vol. 2016, no. 1, p. 67, 2016.
[6] J. De Bruijn, “Using ontologies-enabling knowledge sharing and reuse on the semantic web,” 2003.
[7] J. Han, M. Kamber, and J. Pei,Data mining concepts and techniques, 3d edition. Morgan Kaufmann, 2011.
[8] U. Grimmer and H. Hinrichs, “A methodological approach to data quality management supported by data mining.,” inIQ, pp. 217–232, 2001.
[9] Y. Roh, G. Heo, and S. E. Whang, “A survey on data collection for ma-chine learning: a big data-ai integration perspective,”IEEE Transactions on Knowledge and Data Engineering, 2019.
[10] M. Refaat,Data preparation for data mining using SAS. Elsevier, 2010. [11] J. Huang, Y.-F. Li, and M. Xie, “An empirical analysis of data preprocessing for machine learning-based software cost estimation,” Information and software Technology, vol. 67, pp. 108–127, 2015. [12] I. Taleb, R. Dssouli, and M. A. Serhani, “Big data pre-processing: A
quality framework,” in2015 IEEE international congress on big data, pp. 191–198, IEEE, 2015.
[13] S. Garc´ıa, S. Ram´ırez-Gallego, J. Luengo, J. M. Ben´ıtez, and F. Herrera, “Big data preprocessing: methods and prospects,”Big Data Analytics, vol. 1, no. 1, p. 9, 2016.
[14] C.-F. Tsai and J.-S. Chou, “Data pre-processing by genetic algorithms for bankruptcy prediction,” in2011 IEEE International Conference on Industrial Engineering and Engineering Management, pp. 1780–1783, IEEE, 2011.
[15] S. I. Koval, “Data preparation for neural network data analysis,” in 2018 IEEE Conference of Russian Young Researchers in Electrical and Electronic Engineering (EIConRus), pp. 898–901, IEEE.
[16] G. G. Dumancas and G. A. Bello, “Comparison of machine-learning techniques for handling multicollinearity in big data analytics and high-performance data mining,” inSC15: The International Conference for High Performance Computing, Networking, Storage and Analysis, pp. 41–42, 2015.
[17] N. Mohd Nawi, W. H. Atomia, and M. Z. Rehman, “The effect of data pre-processing on optimized training of artificial neural networks,” 2013. [18] L. Yu, S. Wang, and K. K. Lai, “Data preparation in neural network data analysis,” Foreign-Exchange-Rate Forecasting With Artificial Neural Networks, pp. 39–62, 2007.
[19] L. Yu, S. Wang, and K. K. Lai, “An integrated data preparation scheme for neural network data analysis,”IEEE Transactions on Knowledge and Data Engineering, vol. 18, no. 2, pp. 217–230, 2005.
[20] A. I. R. L. Azevedo and M. F. Santos, “Kdd, semma and crisp-dm: a parallel overview,”IADS-DM, 2008.
[21] U. Shafique and H. Qaiser, “A comparative study of data mining process models (kdd, crisp-dm and semma),”International Journal of Innovation and Scientific Research, vol. 12, no. 1, pp. 217–222, 2014.
[22] G. Mariscal, O. Marban, and C. Fernandez, “A survey of data mining and knowledge discovery process models and methodologies,” The Knowledge Engineering Review, vol. 25, no. 2, pp. 137–166, 2010. [23] D. L. Olson and D. Delen,Advanced data mining techniques. Springer
Science & Business Media, 2008.
[24] A. Rasnitsyn, “Ontology of evolution and methodology of taxonomy,” Paleontological Journal, vol. 40, no. 6, pp. S679–S737, 2006. [25] F. Antoniazzi and F. Viola, “Rdf graph visualization tools: A survey,”
in 2018 23rd Conference of Open Innovations Association (FRUCT), pp. 25–36, IEEE, 2018.
[26] D. Perez-Rey, A. Anguita, and J. Crespo, “Ontodataclean: Ontology-based integration and preprocessing of distributed data,” inInternational Symposium on Biological and Medical Data Analysis, pp. 262–272, Springer, 2006.
[27] A. A. Patel and J. N. Dharwa, “An integrated hybrid recommendation model using graph database,” in2016 International Conference on ICT in Business Industry & Government (ICTBIG), pp. 1–5, IEEE, 2016. [28] D. L. Olson, D. Delen, and Y. Meng, “Comparative analysis of data
mining methods for bankruptcy prediction,”Decision Support Systems, vol. 52, no. 2, pp. 464–473, 2012.
[29] D. D. Wu, Z. Yang, and L. Liang, “Using dea-neural network approach to evaluate branch efficiency of a large canadian bank,”Expert systems with applications, vol. 31, no. 1, pp. 108–115, 2006.
[30] S. Lee and W. S. Choi, “A multi-industry bankruptcy prediction model using back-propagation neural network and multivariate discriminant analysis,”Expert Systems with Applications, vol. 40, no. 8, pp. 2941– 2946, 2013.
[31] L. Medsker, “Design and development of hybrid neural network and expert systems,” inProceedings of 1994 IEEE International Conference on Neural Networks (ICNN’94), vol. 3, pp. 1470–1474, IEEE, 1994. [32] W.-S. Chen and Y.-K. Du, “Using neural networks and data mining
techniques for the financial distress prediction model,”Expert systems with applications, vol. 36, no. 2, pp. 4075–4086, 2009.
[33] F. J. L. Iturriaga and I. P. Sanz, “Bankruptcy visualization and prediction using neural networks: A study of us commercial banks,”Expert Systems with applications, vol. 42, no. 6, pp. 2857–2869, 2015.