University of Nebraska - Lincoln
University of Nebraska - Lincoln
DigitalCommons@University of Nebraska - Lincoln
DigitalCommons@University of Nebraska - Lincoln
Faculty Publications from the Department of
Electrical and Computer Engineering
Electrical & Computer Engineering, Department
of
2011
Risk-Based Failure Mode and Effect Analysis for Wind Turbines
Risk-Based Failure Mode and Effect Analysis for Wind Turbines
(RB-FMEA)
(RB-FMEA)
Salman Kahrobaee
University of Nebraska-Lincoln
Sohrab Asgarpoor
University of Nebraska-Lincoln, [email protected]
Follow this and additional works at: https://digitalcommons.unl.edu/electricalengineeringfacpub Part of the Electrical and Computer Engineering Commons
Kahrobaee, Salman and Asgarpoor, Sohrab, "Risk-Based Failure Mode and Effect Analysis for Wind Turbines (RB-FMEA)" (2011). Faculty Publications from the Department of Electrical and Computer Engineering. 172.
https://digitalcommons.unl.edu/electricalengineeringfacpub/172
This Article is brought to you for free and open access by the Electrical & Computer Engineering, Department of at DigitalCommons@University of Nebraska - Lincoln. It has been accepted for inclusion in Faculty Publications from the Department of Electrical and Computer Engineering by an authorized administrator of
Risk-Based Failure Mode and Effect Analysis
for Wind Turbines
(RB-FMEA)
Salman Kahrobaee and Sohrab Asgarpoor
Department of Electrical Engineering University of Nebraska Lincoln Abstract—Failure Mode and Effect Analysis (FMEA) has
already been used as a qualitative measure for identifying failure modes and causes, in order to mitigate the effects of failure in different sectors of power systems. This paper presents a quantitative approach called Risk-Based-FMEA, based on the failure probabilities and incurred failure costs instead of rating scales. As a case study, this approach has been applied to a direct drive wind turbine. The results show that the definition of failure modes priorities based on their contribution to the total failure cost of the wind turbine is more realistic and practical than the common FMEA approach. Using MS Excel spreadsheet platform, the proposed method can be generalized for different types of wind turbines. In addition, the effective failure cost factors are investigated through sensitivity analysis, by which the wind turbine owner can determine the suitable approach to reduce the total failure cost.
Index Terms—RB-FMEA, wind turbine, failure mode, criticality, cost.
I. INTRODUCTION
Recently, renewable energy has proven to be the key solution for the energy crisis in the fast growing and populated world which continues to deplete fossil-based resources [1]. Wind energy is a justifiable resource among the renewables because of technological improvements and consequently cost reduction of wind power generation in recent years [2]. In United States, wind generation installed capacity reached to more than 40,000MW by the end of 2010, and continues to increase based on the US renewable energy portfolio [3].
Integration of large capacities of wind farms, on the other hand, introduces new challenges in terms of output power variability of the wind turbines due to stochastic parts failures and wind speed changes [4, 5]. As a result, these uncertainties can cause complications for the owners of the wind farms in order to estimate the day-ahead energy generation inquired by the market, where, off estimation, imposes penalties to them. Therefore, reliability evaluation and proper maintenance scheduling using probabilistic techniques is indispensable to predict the expected energy not served, and to minimize the loss of the wind turbines failures and unavailability [6]. Moreover, it will provide more power to the market and increases the profit margin of
wind power generation.
Many studies have been conducted to evaluate the reliability of wind farm as the integrated part of the grid [7- 9]. Some of these studies have addressed the individual wind turbine reliability modeling, and investigated the major factors contributing to the total failure of the turbine [4, 10]. The wind turbine reliability studies are essentially critical in the design stage of the wind power generation systems. Each year, manufacturers introduce new types of wind power conversion systems based on technological improvements. A detailed reliability study for each individual design would assist them in prioritizing their investment in material enhancement and proper adjustments in the turbine structure.
Another valuable outcome of the reliability study for individual wind turbines is exposed in the operation stage. Based on this type of study, the wind farm owner may adjust the manufacturer’s primary maintenance recommendations in order to increase their performance and eventually their profits. The adjustments are dependent on the wind farm’s specific operation conditions such as the location, site weather, power purchase rate, and available facilities.
Failure Mode and Effect Analysis (FMEA) is a proactive process to determine several key potential failures in the system through the comparison of some predefined factors, and as a result, it helps increase the availability of that system [11, 12]. This process has been used on almost any equipment from cars to space shuttles, and as of the last decade wind turbines have been briefly studied [13-15].
Although FMEA has proven to be essential in various industries, there are some shortcomings with this method. Inherently, FMEA is a qualitative approach which results in calculation of an index known as Risk Priority Number (RPN) for each part of the system. The value of RPN for a single part is not self-informative and it only can be used in comparison with other parts’ RPNs for prioritization purposes. This method also requires scaling of different affecting parameters and so far, there is no one- fits-all solution for rating scale definition. As for the wind turbine, researchers have to define their own rating scales or adopt other developed tools and standards which are not specifically designed for wind turbines, and, so, the result may not necessarily represent the true priorities of the wind generation system [15].
North American Power Symposium (NAPS), 2011 doi: 10.1109/NAPS.2011.6025116
This paper proposes an extension to the FMEA method which incorporates the cost associated with each failure mode, hence called Risk-Based FMEA (RB-FMEA). Limited use of this concept has been considered in previous literatures [16, 17]. The authors believe it is more realistic to consider cost which is the common language among different sectors of turbine design, operation and maintenance. In addition, it is a quantitative approach whose outcome is proportional to the wind turbine performance and so can easily be compared with costs of different maintenance strategies or design improvements in order to make an optimum decision. One of the advantages of this proposed strategy is its simplicity, where it is implemented using Microsoft Excel worksheets and can be easily edited or adapted for use by manufacturers of different types of wind turbines.
II. FMEAPROCESS
This section describes the strategy for FMEA and the improvements achieved by including cost in the study.
FMEA is considered as a process of ranking the most critical parts of a system for efficient resource allocation to higher priorities. In the literature, there are few FMEA studies reported on wind turbines. In FMEA study, after determination of the failure modes, the main calculation procedure comprises of three steps:
1) The probabilities of the failure modes occurrences need to be determined. These may be obtained from the previous data for the failed parts. These probabilities are then categorized and assigned a scaling number; with the lowest number for the least probable category.
2) The rate of severity of each failure mode is assigned and scaled due to the consequences of the failure and the amount of damage to the equipment.
3) Another scale number is assigned to the fault detection possibility; with the lowest number to the most likely detection of the failure.
The outcome of this study is the Risk Priority Number (RPN) which is calculated by multiplying all these three scale numbers. The RPNs are then ranked in order of importance.
As discussed earlier, there are some shortcomings with using FMEA. Specifically there are a variety of wind turbine types with different structures and it is not possible to assign the same set of scale numbers for all of them. For example, the damage to a synchronous generator in a direct drive wind turbine is generally more severe and more costly than an induction generator in a fixed speed wind turbine. Another issue with the current calculation method is that, the evaluated RPN doesn’t inherently discriminate between a highly severe but low probable failure mode and a less severe with higher occurrence probability mode.
In order to overcome these problems, this paper proposes a definition based on the cost consequences of wind turbines failure modes. The new definition is more realistic and practical which allows direct comparison of different wind turbines. In addition, this paper provides a simple calculation
tool in spreadsheet format which enables wind farm owners to edit the input data and perform their own RB-FMEA.
III. PROPOSED RB-FMEAPROCEDURE
Given the failure modes, the proposed RB-FMEA procedure for wind turbine is as follows:
• Determine the probability of occurrence of each failure mode given that the wind turbine has failed, , based on the historical data.
• Determine the probability of not detecting the failure, .
• Calculate the cost consequence of the failure, . • Evaluate the risk of each failure mode, called
Cost Priority Number (CPN), by multiplying the probabilities and the cost calculated in previous steps.
(1)
where, “ ” is the index of ith failure mode. The calculated CPN is expressed in dollars and can be easily compared for different failure modes.
is calculated by dividing the number of actual failures, , to the total Number of Failure Vulnerabilities,
, as:
(2) Number of Failure Vulnerabilities is defined as the sum of number of actual failures and the number of detected possible failures prior to their occurrences, for any given period of time. These risks of failure may be detected during online monitoring, inspection, or maintenance.
The cost of failure, , is incurred due to the severity of failure consequence. Here, we only consider those consequences that are affecting the wind turbine itself. However, it should be denoted that, the failures may have other consequences endangering the safety of the site crew and neighbor residents which is specific for a given site and have not been included in this study.
Therefore, the cost of failure is defined as:
(3)
where, is comprised of four major costs. , is the cost of parts which need to be replaced due to the failure. , is the cost of service, and it includes all the costs associated with the required facilities and devices due to the failure, such as renting a crane, or transportation, etc. , represents the opportunity cost, which is the sum of revenues the wind farm owner would have received from selling power generation, in case the failure didn’t occur. It can be expressed as:
(4) where, corresponds to the duration of failure, and
and are the average output wind power of turbine, and average energy purchase rate, within this duration, respectively.
Finally, in equation 3 represents the total cost of extra labor required for the repair, and can be expressed as:
(5) In the above equation, and are number of repair crew, and man-hour rate, respectively.
While CPN represents a cost based risk factor, it can easily be incorporated in calculation of the total failure cost of the system for any specific duration of interest ( ). The total failure cost can be derived as:
∑ , (6) Where, m represents the total number of the failure modes, and , denotes the number of failure vulnerabilities of failure mode for the duration of interest. In this paper, the total failure cost for duration of one year is denoted by annual failure cost (AFC).
IV.RB-FMEA FOR WIND TURBINE TECHNOLOGIES
There has been a variety of wind power generators developed in recent decades. For our RB-FMEA study, various wind turbine structures and their sub-assemblies need to be identified.
Fig.1. Wind turbine hierarchy for RB-FMECA
The failure of the wind generation system is defined through three levels as shown in Figure 1. The wind turbine stands in the highest level (level I); where, wind turbine sub-assemblies and parts are divisions of middle (level II) and low (level III) levels respectively.
A. Different wind generation systems, subassemblies and parts
According to reference [18], wind energy systems can basically be categorized by generator, gearbox, and converter types as shown in Table I.
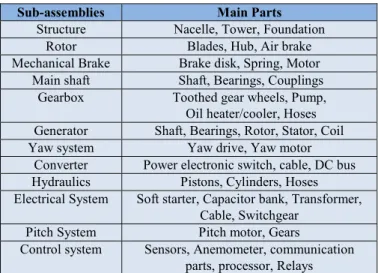
After recognizing the wind turbine types in level I, a general set of wind turbine sub-assemblies and parts are defined for levels II and III of Figure 1, as presented in Table II.
Apparently, many other parts could be spotted in a wind turbine, if more details were needed. However, for this study, the focus is on the major parts with higher failure probabilities and serious consequences.
TABLEI
WIND GENERATION SYSTEMS IN MARKET
Type of generation system
Turbine
concept Gearbox Converter
Single Cage Induction Generator (SCIG)
Fixed speed Multiple stage _
Variable speed Multiple stage Full scale
Permanent Magnet Synchronous Generator (PMSG)
Variable speed _ Full scale
Variable speed
Single or Multiple stage
Full scale Doubly Fed Induction
Generator (DFIG) Variable speed
Multiple stage Partial scale Electrically Excited Synchronous Generator (EESG)
Variable speed _ Full scale Partial &
Wound Rotor Induction Generator (WRIG) Limited variable speed Multiple stage Partial scale Brushless Doubly Fed
Induction Generator (BDFIG)
Variable speed Multiple
stage
Partial scale
TABLEII
GENERAL SET OF WIND TURBINE SUB-ASSEMBLIES AND MAIN PARTS
Sub-assemblies Main Parts
Structure Nacelle, Tower, Foundation
Rotor Blades, Hub, Air brake
Mechanical Brake Brake disk, Spring, Motor
Main shaft Shaft, Bearings, Couplings
Gearbox Toothed gear wheels, Pump,
Oil heater/cooler, Hoses
Generator Shaft, Bearings, Rotor, Stator, Coil
Yaw system Yaw drive, Yaw motor
Converter Power electronic switch, cable, DC bus
Hydraulics Pistons, Cylinders, Hoses
Electrical System Soft starter, Capacitor bank, Transformer,
Cable, Switchgear
Pitch System Pitch motor, Gears
Control system Sensors, Anemometer, communication
parts, processor, Relays B. Failure modes
The failure occurs when a device no longer operates the way intended. There are numerous failure modes that can be defined for a complicated assembly like wind turbines. These failure modes can cause partial or complete loss of power generation. Mainly, the key failure modes, which cause complete loss of power generation, are malfunction and major damage of the main parts of the turbine stated in Table II. Other failure modes are less significant and may be surface damage and cracks, oil leakage, loose connection, etc. However, if they are not taken care of, minor failure modes can initiate major failures as well.
Evidently, each one of the failure modes has a root cause, and the probability of that failure mode is directly related to the probability of its root cause. Table III provides different categories for these causes. Human error in this table, refers to the errors occurred during operation or maintenance. I. Wind
Turbine
III. Turbine Parts II. Sub-Assemblies
TABLEIII
ROOT CAUSES OF THE FAILURE MODES
Weather Mechanical Electrical Wear
High wind Icing Lightening Manufacturing and material defect Human error External damage Grid fault Overload Human error Software failure Aging Corrosion C. Failure probabilities
Failure probability of each failure mode is calculated from the contribution of that failure mode in the interruption of the wind turbine operation. The limiting factor in FMEA study of wind turbines is that the detailed failure data are not available for all of the failure modes. Today, the number of reports providing statistics on failure probabilities is increasing. Some of these statistics have been categorized based on the capacity of the wind turbines, while some others have been divided according to the type of the wind generation system [19, 20].
D. Failure detection
There are a variety of ways to detect the probable failure modes as categorized in Table IV.
TABLEIV
MAJOR DETECTION METHODS OF THE FAILURE MODES
Inspection Condition Monitoring Maintenance
Visual Olfactive Auditive Vibration analysis Oil analysis Infrared thermography Ultrasonic Time-Based Condition-Based
The common ways are through inspection or while the turbine is being maintained. However, the fastest and the most reliable method is condition monitoring which can increase the availability of wind turbine considerably by using online systems. With condition monitoring, the
probability of not detecting the failure decreases to the failure probability of the human error or the monitoring system itself.
E. Cost based failure criticality
As described by equation 3, four different costs should be calculated. The data needed for the cost study include repair or new part expenses, duration of repair, etc, which are specific for each wind turbine type and should be provided by the wind farm owner.
V. CASE STUDY
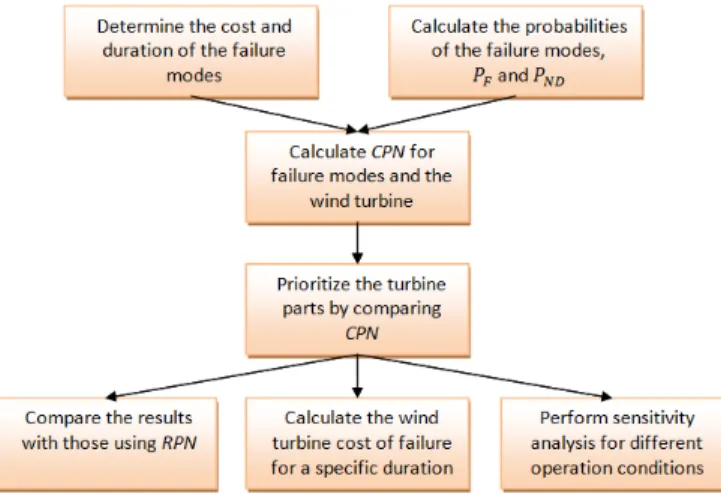
The proposed RB-FMEA method is applied to a 3MW direct drive wind turbine. Figure 2 demonstrates the flowchart for the study.
Fig.2. Flowchart for the case study
The required failure probabilities, vulnerabilities, costs, and durations are calculated based on the available data in [19-26]. A spreadsheet was set up using Microsoft Excel, and the result parameters were derived for the wind turbine parts as shown in Table V.
TABLEV
For the base condition, it is assumed that of the failures, the Capacity Factor (CF) of t and the EPR have been 0.4 and 5¢/kWh respe The resulted CPN column shows that, t ranked the most critical part of the studied d turbine followed by electrical system, blade This analysis can be conducted for any othe turbine and for any operation condition. summing up the CPN of all the parts of a t estimate the overall CPN of that wind turbin can then be compared with the overall CPN of wind turbine in order to rank them perspective. For our study, the overall CP $25.5k.
The calculation of RPN was also included evaluation, and the required parameters w using rating scheme of reference [27]. Figure results of RPN and CPN for our study case.
Fig.3. RPN and CPN for major parts of the wind turb
While two methods are in agreement abo being the most critical part of the direct driv the building blocks of RPN are discrete and therefore cannot represent the strength effectively. Nevertheless, CPN is calculate actual costs, and, so, is more rational to be l making adjustments on design, operation and wind turbines.
In order to estimate the Annual Failure C drive wind turbine, Equation 6 was used and shown in Figure 4.
Fig.4. AFC and CPN for major parts of the wind turb
for the duration the wind turbine ectively.
the generator is direct drive wind
s and converter. er types of wind In addition, by turbine, one can ne. This number Ns of other types from criticality PN adds up to d in Table V for were determined e 3 compares the bine
out the generator ve wind turbine, d qualitative, and h of criticality ed based on the looked up to for d maintenance of ost of this direct d the results are
bine
In fact, each part’s CPN has bee Vulnerability as a weighting fac specifies how many times per year parts has been detected with a risk failed.
Based on the results, the total A $55.5k, which implies an overall fa per year for our wind turbine.
VI.SENSITIVITY A
As mentioned earlier, the result dependent on a number of parame
CF, , etc. The effects of some investigated in this section.
One of the key parameters a failure is duration of the failure. wind turbine may be delayed du inventory, unavailability of the r weather condition, or human erro failure cost was determined by inc as shown in Figure 5.
Fig.5. Sensitivity of the turbine AFC to
The results of this study may amount of money to be spent in ord delays. For example, one week of the initial annual failure cost of $ Hence, any solution for delay p more labor or providing extra tools less than $14.5k per year. The a according to our previously selecte CF. However, the proposed approa wind turbines and operation conditi In fact, CF and EPR are two ma due to the wind speed and the therefore, alter the cost of opportu of the turbine. Figure 6 displays parameters on the annual failure c our case study.
en multiplied by its Failure tor. Failure Vulnerability r each of the wind turbine k of failure or has actually AFC of the wind turbine is ailure vulnerability of 2.17 ANALYSIS
s of RB-FMEA analysis is eters such as , , EPR, e of these parameters are ffecting the total cost of Generally, the repair of a ue to lack of parts in the required facility, adverse or. Therefore, the annual reasing the imposed delay
the additional imposed delay
y suggest the reasonable der to avoid these types of f delay in repairs escalates $55.5k to more than $70k. prevention, like recruiting s, would work if its cost is above results are derived ed base values for EPR and
ach is flexible for different ions.
ajor parameters which vary location of the site, and unity during the downtime s the effect of these two cost of the wind turbine in
Fig.6. Sensitivity of the turbine AFC to the EPR and
According to these results, annual cost change more than 25%, due to the change in and the wind speed.
In another study, the effects of cost of t parts in the marketplace are investig Renewable Energy Laboratory (NREL) percentages of commodities making up each wind turbine [21]. Using these categories, incorporated Producer Price Index (PPI) as U.S. Department of Labor and U.S. Bu Statistics Report [28], to estimate the rate costs of the wind turbine parts for duration Jan.2011. The highest rates were determine change in costs of iron castings and drive these changes have been applied to Table determine the AFC. Considering the costs 2010 as the base values, the results show indicate that the annual failure cost of th turbine will increase by 1.7% in 2011.
Fig.7. Percentage of cost increase due to the inflation
One effective approach to reduce the fa improving the failure detection system. As s the case study of this paper, “generator” priority to start with. Figure 8 illustrates the turbine’s AFC, by 10 percent improvement fault detection system under different operatio
CF
of failure may the energy price the wind turbine gated. National
has provided h main part of a
this paper has described in the ureau of Labor of increment in n of Jan.2010 to ed to be due to e motors. Then, e V in order to of the parts in wn in Figure 7 he studied wind n from 2010 to 2011 ailure cost is by stated before, for has the highest total savings in
in the generator on conditions.
Fig.8. Annual failure cost before and aft the generator fault detection system
As an example, for the capacity 5cents/kWh, the total savings are year. This implies that a condition costs less than this amount and can improvement in fault detection, is r in this case.
VII. CONCLU
This paper introduced a new qu FMEA study of the wind turbin modes contribution to the total fail applied to a 3MW direct drive win and results illustrate a more realisti failure modes priorities. The valu this paper, not only specify the c they can also be utilized for calcul of wind turbines for duration of int special software was avoided by us platform, and therefore, this metho for different types and location Finally, sensitivity analyses were determine the impact of various pa turbines.
ACKNOWLED
The authors are grateful to t Energy Sciences Research for their
REFEREN [1] International energy outlook 201 Administration. Available: www.eia.g [2] Renewable fuels module. U. S. Ene
Report: DOE/EIA-0554(2010). [3] U.S. wind industry year-end 2010
Energy Association, January 2011. [4] Spinato, 20091201, Reliability of w
Renewable Power Generation 3(4), pp [5] P. J. Tavner, R. Gindele, S. Faulstic Study of effects of weather and locati Presented at EWEC 2010.
[6] Jesse A. Andrawus, John Watson an Modelling system failures to optimise Eng 31(6), pp. 503.
ter 10 percent improvement in m
factor of 0.4 and EPR of approximately $3000 per monitoring system, which n guarantee the ten percent reasonable to be purchased
USION
uantitative approach for the es based on their failure lure cost. This method was nd turbine as a case study, ic identification of credible ues of CPN introduced in critical failure modes, but lation of total failure costs erest. Complexity of using sing MS Excel spreadsheet d can simply be employed ns of the wind turbines.
e performed in order to arameters on AFC of wind
DGMENT
the Nebraska Center for r support of this project.
NCES
10. U.S. Energy Information gov/oiaf/ieo/index.html.
ergy Information Administration market report. American Wind wind turbine subassemblies. IET
p. 387.
ch, B. Hahn and M. W. Whittle. ion on wind turbine failure rates. nd Mohammed Kishk. 20070101, wind turbine maintenance. Wind
[7] P. Hu, R. Karki and R. Billinton. 2009, Reliability evaluation of generating systems containing wind power and energy storage. Generation, Transmission & Distribution, IET 3(8), pp. 783-791. [8] S. Kahrobaee and S. Asgarpoor. Short and long-term reliability
assessment of wind farms. Presented at North American Power Symposium (NAPS), 2010.
[9] H. Lingling and Fu Yang. Reliability evaluation of the offshore wind farm. Presented at Power and Energy Engineering Conference (APPEEC), 2010 Asia-Pacific.
[10] H. Guo, S. Watson, P. Tavner and J. Xiang. 20090601, Reliability analysis for wind turbines with incomplete failure data collected from after the date of initial installation. Reliab. Eng. Syst. Saf. 94(6), pp. 1057.
[11] D. H. Stamatis. 2003, Failure Mode and Effect Analysis: FMEA from Theory to Execution .
[12] R. J. Mikulak, R.McDermott and M. Beauregard. 2008, the Basics of FMEA (2nd ed.) .
[13] W. E. Klein and V.R. Lali. Model-OA wind turbine generator: Failure modes and effects analysis. Presented at Annual Reliability and Maintainability Symposium, 1990.
[14] J. Andrawus, J. Watson, M. Kishk and A. Adam. 20060101, The selection of a suitable maintenance strategy for wind turbines. Wind Eng 30(6), pp. 471.
[15] P. J. Tavner, A Higgins, H. Arabian, H. Long and Y. Feng. Using An FMEA Method to Compare Prospective Wind Turbinee Design Reliabilities Presented at European Wind Energy Conference (EWEC 2010).
[16] A. Hassan, I. Dayarian, A. Siadat and J. -. Dantan. Cost-based FMEA and ABC concepts for manufacturing process plan evaluation. IEEE Conference on Cybernetics and Intelligent Systems, 2008.
[17] C. M. Spencer and S. J. Rhee. Cost based failure modes and effects analysis (FMEA) for systems of accelerator magnets. Particle Accelerator Conference, 2003. PAC 2003.
[18] H. Li and Z. Chen. 2008, Overview of different wind generator systems and their comparisons. Renewable Power Generation, IET 2(2), pp. 123-138.
[19] E. Echavarria, B. Hahn, G. J. W. van Bussel and T. Tomiyama. 20080801, Reliability of wind turbine technology through time. Journal of Solar Energy Engineering 130(3), pp. 031005.
[20] J. Ribrant and L. Bertling. Survey of failures in wind power systems with focus on Swedish wind power plants during 1997-2005 IEEE Power Engineering Society General Meeting, 2007.
[21] L. Fingersh, M. Hand and A. Laxson. 2006, Wind turbine design cost and scaling model. NREL. Available: http://www.nrel.gov/wind/pdfs/32495.pdf.
[22] H. Polinder, F. F. A. van der Pijl, G. -. de Vilder and P. J. Tavner. 2006, Comparison of direct-drive and geared generator concepts for wind turbines. Energy Conversion, IEEE Transactions on 21(3), pp. 725-733.
[23] R. Poore and C. Walford. 2008, Development of an operations and maintenance cost model to identify cost of energy savings for low wind speed turbines. NREL. Available: http://www.nrel.gov/docs/fy08osti/40581.pdf.
[24] R. Poore and T. Lettenmaier. 2003, Alternative design study report: WindPACT advanced wind turbine drive train designs study. NREL. Available: http://www.nrel.gov/docs/fy03osti/33196.pdf.
[25] Deok-je Bang, Henk Po Under, G. Shrestha and J. A. Ferreira. Promising direct-drive generator system for large wind turbines. Presented at Wind Power to the Grid - EPE Wind Energy Chapter 1st Seminar, 2008. EPE-WECS 2008.
[26] G.J.W. van Bussel and M.B. Zaaijer. Reliability, availability and maintenance aspects of large-scale offshore wind farms, a concepts study. Presented at Marine Renewable Energy Conference.
[27] H. Arabian-Hoseynabadi, H.Oraee and P.J. Tavner. 20100901, Failure modes and effects analysis (FMEA) for wind turbines. International Journal of Electrical Power & Energy Systems 32(7), pp. 817. [28] U.S. Department of Labor and U.S. Bureau of Labor Statistics; PPI