The
influence
of
private
school
enrollment
on
public
school
performance
Michael
L.
Marlow
Department of Economics, California Polytechnic State University, San Luis Obispo, CA 93407
E-mail: mmarlow@calpol.edu
Schoolchoicereformreferstochangesthatallowparentsgreaterfreedom to chooseschools fortheir children.Schoolchoice reformis contentious because it fundamentally alters the environment in which public and private schools operate and could result in significant changes for both demanders and suppliers of education. This article develops a model of public education with imperfect exit to predict how private school enrollment influences performanceof public schools. Empirical evidence from data on all private and public schools in California provides substantial support for the hypothesis that public school test scores are inversely related to private school enrollments and charter school enrollmentswhenprivateandcharterschoolingreflectsexitingbyparents unhappywithlocal publicschools.Implicationsregardinghow expanded private school choice might influence public school performance in Californiaandelsewherearediscussed.
I.Introduction fundamentally alters the environment in which public and private schools operate and could result Proposals callingfor school choice reformareoften in significant changes for both demanders and attributed to Milton Friedman’s (1955) advocacy of suppliersof(publicandprivate) education.
tuitionvouchersasameansofimprovingpublicand Opponents of expanded choice often fear that private schools. School choice reform refers to poorlyperforming public schools will lose quality changes that allow parents greater freedom to students as parents exercise greater opportunities to choose schools for their children. For example, transfer to other public schools or choose private vouchers or tax-preferences that subsidize tuition, schools. Such sorting is often termed ‘cream-skim booksandtransportationcostsexpandprivateschool ming’ by opponents who predict that it lowers choice because they lower costs associated with peer group quality and public funding for public private schooling. Easing of restrictions that base schools losing students and fear that gaps between publicschooladmissiononhousinglocationexpands poor-quality and high-quality schools could widen. public school choice bywideningnumbers of public Proponents argue that public schools should schools to choose from. It is not surprising that worry about greater school choice only when school choice reform is contentious because it schools are perceived to be inferior to other public
or private schools. Poor performance is considered likely according to proponents because lack of exit opportunitiessubjectspublic schoolsto littlecompe tition and thereforeexpanded opportunities for exit should create incentives for poor quality schools to improve or keep losing students and funding. As performance improves, performance gaps between schoolsmightshrink.
This article addresses the debate over expanded school choicebyexamininghow privateenrollments influence performance of public schools. Private schooling is clearlyone option for parents unhappy withpublicschoolsandthereforeprivateenrollments mayinverselyinfluencepublicschoolperformanceas long as private schools outperform public schools. This article examines data on all private and public schoolsinCaliforniain2003andconcludesthat,after controlling for other factors that might influence performance, public school performance isinversely related to private school enrollments. Implications regardinghowexpandedprivateschoolchoicemight influence future public school performance in Californiaandelsewherearediscussed.
II. PublicEducationwithImperfectExit Public education programmes result from exchange between voters-demanders and policymakers-suppli ers and, as in private markets, exchanges may take place under different market structures. Public education markets may be competitive or monopo listic as influenced by the degree to which voter-demanders have exit options over public programs they receive. Voters-demanders include parents, homeowners, and employers who all view quality education in one way or another linked to their interests. When parents conclude that local public schools are unable to deliver programs they desire, theymayexittopreferrededucationprogramsalong the lines outlined by Tiebout’s (1956) model of ‘voting-with-your-feet’. Exiting behaviour may include transfers to other public schools, home schools or private schools. The Tiebout model predicts that citizens with similar interests tend to assemble in similar political jurisdiction which suggeststhatlocalresidentswillexhibitfairlyuniform
preferences for programmes such as public educa tion.1Under certain conditions,Tiebout-type mobi litywithinasystemofmany exitopportunitiesleads toa Pareto-efficientequilibrium.2
Ability-to-exitaparticularpublicschool,however, isclearlyimperfectandinfluencedbyeaseoftransfer to other public schools and affordability and avail ability of local private schools. Parents are often assignedspecificschoolswithin theirschool districts and such ‘exclusive territories’ force parents to undertake costly relocation if they want different public schools, even though moves may be short distances.3 Tuition at private schools may also be prohibitive thus also lowering exit ability of some parents. Few exit options enable public schools to exhibitsomedegree ofmonopolypower.
Financingpublic educationthroughtheability-to pay principle may also contribute to lower school performance as parents with public school children maybelessinterestedinmonitoringqualitythanthey would under the benefit principle of taxation. Tax billsofparentsarenotsensitivetonumbersof school-age children andprobably lead to less concern over quality than would arise if tax bills rose with consumption. That is, taxpayers with school-age children do not facehigher tax bills, at themargin, forsendingchildrentopublicorprivateschoolsthan taxpayers without school-age children. Moreover, because parents do not have abilities to quitpaying forpubliceducationiftheyexittoprivateeducation, thisfinancingsystemlikelypromotesless scrutinyof public school performance than would arise if they did not ‘pay twice’ for education when exiting to private schools. In contrast, parents purchasing private education face tuition bills directly related to numbersof childrensentandthereforeincentives arise for these parents to carefully monitor perfor mance because they have the ability to exit and no longerfundprivate education.
This discussionsuggests thatprivate schoolshave greater incentives to provide superior performance over public schools because parents have choices aboutwhethertheywillchooseprivateschoolingand pay tuition. Parents therefore have great financial incentivestomonitorperformancevery closelywhen theychoosetofundprivate schools.Averagetuition in 1999 ranged from $3263 for Catholic schools to $19992 for secular schools, with $4689 being the
1
Martinez-Vazquez and Seaman (1985) and Hamilton and Macauley (1991) find that, when communities with diverse
populations have relatively few school districts, there are more private schools. Evidence then suggests that private
enrollments are higher when public schools do not support diverse preferences and so greater numbers of private schools
provide more exit opportunities for demanders.
2
Assumptions include perfect information and mobility and absence of free riders and interjursidictional externalities.
3
average for all private schools.4 Evidence indicates thatprivate schoolsconsistentlyachievehigher rates of attendance and graduation, levels of parental satisfaction and college admission rates than public schools.5 However, added expense of tuition clearly places private schools at a price disadvantage that contributes to the fact that private schooling com mands only about 10% of primary and secondary education in the United States. Proponents of expanded school choice predict that greater exit opportunities would lead to greater threats of exodusout of public educationifpublic schools fail to respond to heightened competitive pressures by improvingperformance.
TheNationalEducationAssociation(NEA),which is the largestteachers’ organization with2.7 million members, holdsanopposingview.Thisviewfocuses on improving public education by raising salaries, numbersofteachersandotherconventionalinputsin the production of education. NEA’s opposition to expandedschoolchoice isclear:
Teachers, parents, and the general public have long opposed private school tuition vouchers — especially when funds for vouchers compete with funds for overall improvements in America’s public schools. NEA and its affiliates have been leaders in the fight to improve public schools — and oppose alternatives that divert attention, energy, and resources from efforts to reduce class size, enhance teacher quality, and provide every student with books, computers, and safe and orderly
6 schools.
NEA appears to equate quality with inputs and predicts that expanded school choice lowers public education quality whenever it leads to less public funding. While this view is consistent with the Tiebout-model prediction that expanded private school choice raises flightto private schools, appar ently ‘voting-with-your-feet’ is not considered a viable method for improvement due to fears of
4See National Center for Education Statistics (2002).
5
funding reduction and/orthatexiting willbe under taken mostlyby higher-aptitude students or higher-incomefamilies.7
This discussion leadsto the hypothesisthat when privateschoolingreflectsexitingbyparentsunhappy with local public schools, relatively high private enrollments reflect greater dissatisfaction with local public schools. Public school performance should thenbeinverselyrelatedtoprivateenrollmentsbased on the viewthatparents choosingprivate education are sensitive to public school quality as reflected in suchmeasuresastestscores.Empiricalevidencethat private enrollments are inversely related to public schoolperformancethenindicatesthatpublicschools lose quality students to private schools under the assumption that parents choosing private education are more interested in higher quality education. Of course, there are many possible factors that might explainwhyparentsperceiveprivateeducationtobe worth tuition payments and include better peer groups, more interested parents, and/or greater incentives to producehigher quality product follow ing our previous discussion on why private schools mayout-perform publicschools.
According to proponents of expanded school choice, this negative relationship may eventually disappear if public schools respond by raising performance to levels that counter exodusof better students. In this case, no relation between private enrollments and public school performance should appear. Otherwise, a negative relation is consistent with the view that private schools provide perfor mancethatissufficientlyabovepublicschoolstolead to relatively high private enrollments. Stated differ ently, public schools are expected to exhibit higher testscoresincommunitieswithrelativelylowprivate enrollmentsbecausesuchcommunitieshaverelatively littledemandforprivateschoolsbecausetheirpublic schoolsofferrelatively highperformance.
See, for example, Alt and Peter (2003). However, it should be noted, that Coleman etal. (1966), or the so-called Coleman
Report, concluded that the strongest predictor of student performance was family background as, for example, measured by
household income and parental socio-economic status. Therefore, conventional measures such as per pupil spending and
student-to-teacher ratios were found to be relatively unimportant in most cases. This report prompted numerous studies that
mostly supported the original findings of the Coleman Report as discussed in Hanushek’s (1986) extensive survey of the
literature. More recently, others have argued that school effects such as per pupil funding are more important than previously
believed. See, for example, Card and Krueger (1992) and Hedges etal. (1994). Several researchers doubt the validity of recent
studies concluding that school effects are important; see, for example, Betts (1995), Grogger (1996) and Hanushek et al.
(1996). While debate continues on how important school effects are, most researchers appear to agree that nonschool effects
such as family and community background are quite important when it comes to determining student performance.
Therefore, perhaps school effects are less important as well than nonschool effects in explaining student performance
differences between private and public schools.’’
6
Quote taken off http://www.nea.org/vouchers/index.html during December 2005.
7
The following quote from NEA’s website http://www.nea.org/vouchers/index.html during December 2005 makes it clear
that they view vouchers as a threat to poorly-performing public schools: ‘NEA and its affiliates support direct efforts to
improve public schools. There is no need to set up new threats to schools for not performing. What is needed is help for the
III. SchoolChoiceinCalifornia
California provides a large dataset to examinehow private enrollments are related to public school performance. California enrolls roughly 13% of all public primary and secondary students in the nation.8 There are more than 6 million public school students (primary and secondary education) served by about 9000 public schools in over 1000 public school districts. There are roughly 600000 private school students served by 3700 private schools. The private share of all education in California then is roughly 9%and is consistent with the national average.9
California Department of Education publishes data on many aspects of private schools.10 All private schools serving elementary or high school students, and who enroll at least six students, are required to file an affidavit or statement each year with the State Superintendent of Public Instruction. A summary of selected information for the 2003�2004 school year follows. Students in private schools accounted for 9% of 2003�2004 enroll ments in all public and private schools. Of the 599605 private school students, 450274 were enrolled in elementary grades (K-8) and 149331 were enrolled in secondary grades (9�12). Sixty-four percent of students enrolled in private schools attended church-affiliated (religious) schools, with Roman Catholic schoolsaccounting for 39%of the total number of church-affiliated schools and serving 59% of students attending such schools.
The data exhibit wide variation in shares of students in private school enrollments and between counties thus indicating substantial range of private school choice.11 The average (median) share of students enrolled in private schools as a percentage of all enrollments is 6.2% (5.1%), with a range of 0�29.1%. The average (median) share of students enrolled in religious schools as a percentage of all enrollments is 5.0% (4.4%), with a range of 0�22%. The average (median) share of students enrolled in Catholic schools as a percentage of all enrollments is 2.1% (1.4%), with a range of 0�17%. Finally, the average (median) share of
8
Data from Statistical Abstract of the United States, 2003.
9
students enrolled in secular schools as a percentage of all enrollments is 1.1% (0.4%), with a range of 0�8.8%. Data indicate that a majority of private school enrollments are in religious schools, with roughly 40% of those enrollments in Catholic schools.
Two propositions that would have allowed vou chers in California were defeated in recent years.12 Proposition 174 in 1993 would have amended the stateconstitutiontoprovidevouchersforfamilies to enroll their children in public, private or parochial schools.In2000,Proposition38,avoterinitiativeto provideparents,regardlessof income,withuniversal vouchersworth$4000perchildforuseatanypublic orprivate school,wasalsodefeated.
Private and public school choices may also be expanded through tax preferences. The federal government offers education savings accounts such as the Coverdell Educations Savings Accounts that enableparentstosave upto $2000annuallyin bank accountsthatarefreefromtaxationandtoapplythis moneytoK–16educational expenses.Variousstates allow tax credits and deductions for certain educa tionalexpensessuchasprivate schooltuition,books and transportation, but California does not offer similartax-preferences.
While California does not directly subsidize private school choice through vouchers or tax-preferences, recent developments have expanded public school choice. In 1992, the Charter School Act was passed (amended in 1998, 1999, 2002 and 2003) and currently permits establishment of 650 charter schools and raises the cap by 100 schools for each subsequent academic year. Local school boards, county boards of education and the California State Board of Education may authorize charters and these schools receive 100% of public schools’ per-pupil funding. Teachers in charter schools are required to be certified. In 2003, there were 154365 students enrolled in 443 charter schools.
Two California bills passed in 1993 � Assembly Bill 1114 and A.B. 19 � give parents rights to transfer childrento other public schoolswithin and outside their district, subject to space limitations or
In 1999–2000, approximately 27 000 private schools, with 404 000 full-time-equivalent (FTE) teachers, enrolled 5.3 million
students. These schools accounted for 24% of all schools in the United States, 10% of all students, and 12% of all FTE
teachers; see US Department of Education (2002).
10
Numbers discussed here are from California Department of Education (2004).
11
Counties having 10% or more of their total students enrolled in private schools in 2003�2004 were: Alameda (11.8%),
Contra Costa (10.3%), Los Angeles (10.5%), Marin (18.7%), Napa (13.4%), Orange (10.1%), San Francisco (29.1%), San
Mateo (15.4%), Santa Clara (12.4%) and Santa Cruz (11.2%).
12
These defeats are consistent with Kenny’s (2005) discussion of initiatives that concludes that voucher bills have been passed
racial balance policies. Successfultransfer mayhave previously required residential relocation. These mandatory intradistrict choice laws enable parents to choose from schools within their district of residence. Interdistrict transfers are limited to districts that elect to participate. Unfortunately, it is unclear how California fits into national trends because the California Department of Education does not report how many parents elect public school choice. But, the US Department of Education (2003) reports that 14% of students attended a public school of choice in 1999 and the trend away from public, assignedschool enrollment and toward public, chosen school enrollment between 1993 and 1999 was most evident in low-income households. Under the 2002 federal No Child Left Behind Act, children attending schools that have failed to make adequate yearly progress toward meeting state standards for two consecutive years are eligible to transfer to better-performing schools within their district.
Insum,Californiadoesnotfacilitateprivateschool choice through vouchers or tax-preferences, but public school choice is fostered to the extent that parents can take advantage of mandatory intradis trict and voluntary interdistrict transfers laws. It remainsunclearhoweasyitisforparentstoexercise public school choice because enrollmentsaredepen dentuponspacelimitationandracialbalancepolicies and no data arereported on thesetransfers. Thisis unfortunatebecauseprivate enrollmentsarelikelyto be related to both ease of intradistrict and interdis trict transfer and to perceived quality gaps between high- andlow-performing schools.Data onlocation andfrequencybywhichtransfersoccurmightreveal much about parental preferences regarding public school choice as well as how it influences private enrollments.
Easeof public school choice should be relatedto numbers of school districts within counties because choice should rise with numbers of school districts whenlocalpolicies affectingschoolqualityaremade atthelevelofschooldistricts.TheHerfindahlindex, or the sum of squared shares of school district enrollments within counties, then measures ease of transferfromonedistricttoanotherandcontrolsfor influences of public school choice on private enroll ments.Greater public transfer options, asmeasured byHerfindahlscores,ishypothesizedtolowerprivate enrollmentswhengreaterpublicschoolchoicelessens need for parents to exit public schools for private schools.
IV. ModellingEffectsofPrivate Enrollmentson PublicSchool Performance
Endogeneity is an issue of concern if the causal relationship betweenpublic school performanceand private school enrollment is two-way. One possible direction is that public school performance causes private school enrollment as, for instance, high-test scoresin publicschoolscauseprivate enrollmentsto be relatively low. But, private school enrollment couldalsocausepublicschoolperformancewhen,for instance, better studentsexit to private schools thus causingpublicschoolscorestofall.Disentanglement of these causal effects is a critical issue when we examine influences of private enrollments on public schoolperformance.Possibilityoftwo-waycausality isaddressedherebyusingtwo-stageleastsquaresto estimate models of public school performance. Ordinary least squares produces biased and incon sistent estimates of coefficients in presence of simultaneity. Also, to control for possibility of differential variance by county size, equations are estimated with SEs and variances that use White’s (1980) covariance estimator.Estimates ofcoefficient covariances are calculated in presence of heteroske dasticity ofunknownform.
The model of public school performance in (1) is estimated by two-stage least squares, where 57 counties in 2003 are the unit of observation. All CaliforniacountiesareincludedexceptAlpinewhich is excluded because of missing data.13
Cross-county estimationisappropriatebecauseschooldistrictsare organizedwithin countiesinCaliforniaandoverseen by county boards of education, all of which are electedexceptforLosAngelesCounty’sboardwhich isappointedbyitsBoardofSupervisors.
SCOREi ¼f(INCOMEi, DENSITYi, TAKEi,
SPENDi, HERFi, PRIVATEi, LEARNERSi,
CHARTERSi)(1)
Thefirst-stageequationis
PRIVATEi ¼f(INCOMEi, DENSITYi, TAKEi,
SPENDi, HERFi, HISPi, ASIANi, BLACKi,
LEARNERSi,CHARTERSi)(2)
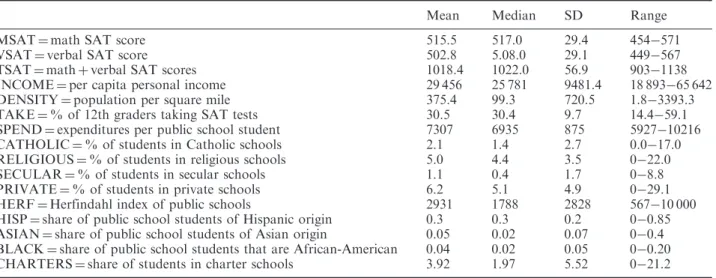
Variablesaredefinedalongwithsummarystatistics in Table 1. Data werecollected from the California Department of Education website to measure and calculate all education-related variables. Income (INCOMEi), and population density (DENSITYi)
Table 1. Summarystatistics
Mean Median SD Range
MSAT ¼math SAT score 515.5 517.0 29.4 454�571
VSAT ¼verbal SAT score 502.8 5.08.0 29.1 449�567
TSAT ¼math þverbal SAT scores
INCOME ¼per capita personal income
1018.4 29 456 1022.0 25 781 56.9 9481.4 903�1138 18 893�65 642
DENSITY ¼population per square mile 375.4 99.3 720.5 1.8�3393.3
TAKE ¼% of 12th graders taking SAT tests 30.5 30.4 9.7 14.4�59.1
SPEND ¼expenditures per public school student 7307 6935 875 5927�10216
CATHOLIC ¼% of students in Catholic schools 2.1 1.4 2.7 0.0�17.0
RELIGIOUS ¼% of students in religious schools 5.0 4.4 3.5 0�22.0
SECULAR ¼% of students in secular schools 1.1 0.4 1.7 0�8.8
PRIVATE ¼% of students in private schools 6.2 5.1 4.9 0�29.1
HERF ¼Herfindahl index of public schools 2931 1788 2828 567�10 000
HISP ¼share of public school students of Hispanic origin 0.3 0.3 0.2 0�0.85
ASIAN ¼share of public school students of Asian origin 0.05 0.02 0.07 0�0.4
BLACK ¼share of public school students that are African-American 0.04 0.02 0.05 0�0.20
CHARTERS ¼share of students in charter schools 3.92 1.97 5.52 0�21.2
variables were collected from the California StatisticalAbstract,2004.
Thedependentvariablein(1)isSCOREi andrefers
totwopublicschooltestscores:SATverbalandSAT math scores. Higher values indicate higher perfor mance and these measures are consistent withthose usedin otherstudies.14 Maximumscoresofseparate verbalandmathSATsare800.
INCOMEi controlsforinfluenceofincomeontest
scores based on the hypothesis that higher incomes raise demand for quality in public education. This hypothesized effect is consistent with the view that parents prefer quality education. Alsopublic school quality is a critical component of local property values and, because income is probably highly correlated with property values, income is hypothe sized to exert a positive influence. It is common to include education attainment in the community as anotherfactorinfluencingschoolperformance,butit isnot includedherebecauseofhighcorrelationwith income.15
DENSITYi measurespopulationdensityasdefined
by population divided by square milesand controls for differences that might arise between urban and rural counties. Itisoften arguedthat urbanschools experiencegreaterscaleeconomiesthanruralschools thus allowing for greater performance from a given budget. However, urban schools may also suffer manysocialillsoftenassociatedwithinnercitiesthus suggesting that greater density may exert an inverse
14
influenceaswell.Theneteffectoftheseinfluencesis anempiricalissue.
Percentage of 12th grade students taking SAT exams (TAKEi) controls for the expectation that
higher values result in lower test scores because higher percentages indicate, at the margin, lower aptitudestudentsaretakingtests.Largerpercentages therefore are hypothesized to indicate that more lower-aptitude students take tests thus exerting downwardpressureon averagetest scores.
PublicschoolspendingSPENDi controlsforeffects
ontest scoresthatarisefrom differencesinspending across counties. Spending is measured as spending per student in ‘average daily attendance.’ While conventional wisdom appears to be that higher spending leads to higher performance, the often-cited review of the literature by Hanushek (1986) suggeststhatthisrelationshipisweakat best.
TheHerfindahlscoreHERFiisexpectedtoexerta negativeeffectontestscoresbasedonthehypothesis that fewer public school choice options should negatively influence public school performance. As discussed, larger Herfindahl scores indicate fewer inter-district transfer options thus indicating fewer exit options, or simply less public school choice. BorlandandHowsen(1992),BlairandStaley(1995), Zanzig (1997) and Marlow (2000) find that Herfindahl indices exert competitive pressures on public school performance.The Herfindahl index is the sum of squared shares in each market and
For instance, see the review of more than 35 studies assessing public school performance in Belfield and Levin (2001). Also, Lankford and Wyckoff (1992) find that parents are sensitive to school quality as measured by test scores of public and private
elementary schools.
15
Educational attainment is measured by the percentage of adults over the age of 25 with at least a bachelor’s degree in 2000
and is published in the Statistical Abstract of the United States, 2003. Results did not change when educational attainment
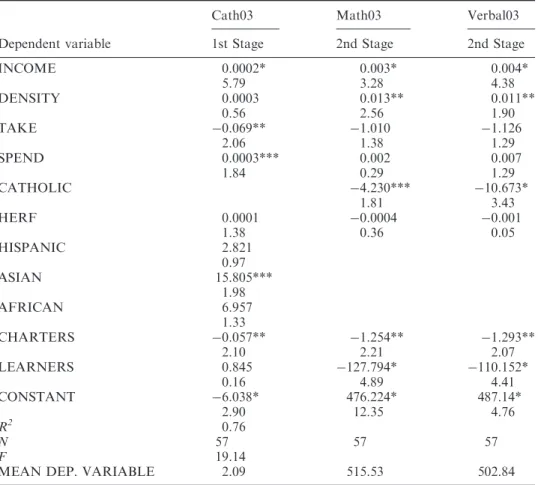
Table 2. 2SLS Estimates of catholic enrollments on public school performance estimated coefficients(t-statisticsinparentheses)
Cath03 Math03 Verbal03
Dependent variable 1st Stage 2nd Stage 2nd Stage
INCOME 0.0002* 0.003* 0.004* 5.79 3.28 4.38 DENSITY 0.0003 0.013** 0.011** 0.56 2.56 1.90 TAKE �0.069** �1.010 �1.126 2.06 1.38 1.29 SPEND 0.0003*** 0.002 0.007 1.84 0.29 1.29 CATHOLIC �4.230*** �10.673* 1.81 3.43 HERF 0.0001 �0.0004 �0.001 1.38 0.36 0.05 HISPANIC 2.821 0.97 ASIAN 15.805*** 1.98 AFRICAN 6.957 1.33 CHARTERS �0.057** �1.254** �1.293** 2.10 2.21 2.07 LEARNERS 0.845 �127.794* �110.152* 0.16 4.89 4.41 CONSTANT �6.038* 476.224* 487.14* 2.90 12.35 4.76 R2 0.76 N 57 57 57 F 19.14
MEAN DEP. VARIABLE 2.09 515.53 502.84
Note: *, ** and *** significant (two-tailed test) at 1, 5 and 10% levels, respectively
therefore has a minimum value of near 0 and a maximum value of 10000. Lower values indicate competitive markets and, at the extreme value of 10000, a perfect monopoly district that controls all public educationin thatcounty.
PRIVATEi measuresprivateschoolenrollmentsas
percentages of all (private and public) students in each county. Previous discussion hypothesized that greater private school choice leads to lower public schooltestscoreswhenpublicschoolsareconsidered inferiorto privateschools.Four measuresof private schoolchoiceareexamined:enrollmentsat Catholic, religious, secular and all or combined schools. It is possible that religious school enrollments, and especiallythoseofCatholicschools,exertcompetitive pressures on public schools that differ from those from secular schools. Religious enrollments tend to offersubsidizedtuitiontoalargesegmentofstudents as well as religiousinstruction thatmay not directly raise performance on standardized tests. Secular schools generally charge higher tuition and are
‘college-prep’ in nature and so may cater more to higher-aptitude students than do religious schools. Each of three private school enrollments are con sidered separately and then combined to examine whether each exerts different influences on public schooltestscores.
CHARTERSi isdefinedastheshareofallcounty
students attending charter schools in 2003 and is calculated from data on the California Education Department’s website. Charters schools provide parents with another means of avoiding more traditionalpublicschoolsandthereforeitishypothe sized that a negative sign would indicate greater charterschoolchoiceleadstolowerpublicschooltest scoreswhentraditionalpublicschoolsareconsidered inferiortoprivateschools.
Percentage of all students that are classified as English-learners LEARNERSi is hypothesized to exert a negative influence on test scores based on theconventionalviewthattheirlackoffluencyplaces themat adisadvantage.
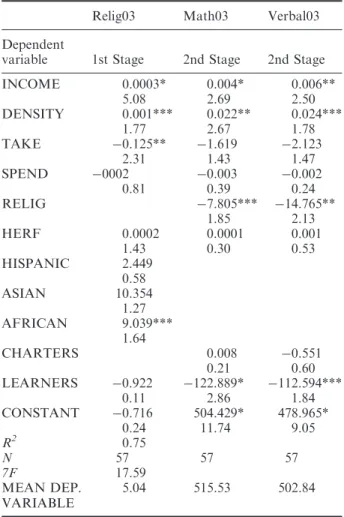
Table 3. 2SLSestimatesof religiousenrollments on public school performance estimated coefficients (t-statistics in parentheses)
Relig03 Math03 Verbal03
Dependent
variable 1st Stage 2nd Stage 2nd Stage
INCOME 0.0003* 0.004* 0.006** INCOME 0.0002* 0.004** 0.006** 5.08 2.69 2.50 5.21 2.15 3.01 DENSITY 0.001*** 0.022** 0.024*** DENSITY �0.001 0.009** 0.001 1.77 2.67 1.78 0.45 2.43 0.18 TAKE �0.125** �1.619 �2.123 TAKE �0.033 �1.075 �1.331 2.31 1.43 1.47 1.58 1.21 1.55 SPEND �0002 �0.003 �0.002 SPEND 0.0004** 0.004 0.013** 0.81 0.39 0.24 2.37 0.64 2.22 RELIG �7.805*** �14.765** SEC �10.307 �27.448** 1.85 2.13 1.10 2.43 HERF 0.0002 0.0001 0.001 HERF �0.0002 �0.001 �0.002 1.43 0.30 0.53 0.44 1.10 1.47 HISPANIC 2.449 HISPANIC 2.546 0.58 1.38 ASIAN 10.354 ASIAN 6.285** 1.27 2.04 AFRICAN 9.039*** AFRICAN 0.600 1.64 0.21 CHARTERS 0.008 �0.551 CHARTERS �0.028 �1.320** �1.505** 0.21 0.60 1.38 2.16 2.36 LEARNERS �0.922 �122.889* �112.594*** LEARNERS �2.788 �130.988* �116.064** 0.11 2.86 1.84 0.85 3.51 2.03 CONSTANT �0.716 504.429* 478.965* CONSTANT �6.227* 438.704* 312.160* 0.24 11.74 9.05 3.79 6.68 4.16 R2 0.75 R2 0.79 N 57 57 57 N 57 57 57 7F 17.59 F 21.43
MEAN DEP. 5.04 515.53 502.84 MEAN DEP. 1.15 515.53 502.84
VARIABLE VARIABLE
Note: *, ** and *** significant (two-tailed test) at 1, 5 and
10% levels, respectively
Instrumentsforfirst-stageestimationin(2) areall independent variables in (1) except PRIVATEi and
the addition of HISPi (share of public school
population of Hispanic origin), ASIANi (share of
public school population of Asian origin) and BLACKi (share of public school population of
African�American origin). Previous studies have shown thatprivate schoolenrollments are higher in areas of higher income and those with stronger religious preferences.16 Downes and Greenstein (1996) examinelocationchoice of California private schools in 1978�1979 and conclude that locational choice is influenced by local demographics and ethnicity. Shares of public school populations that areofHispanic,AsianandAfrican�Americanorigin are included to control for ethnic composition.
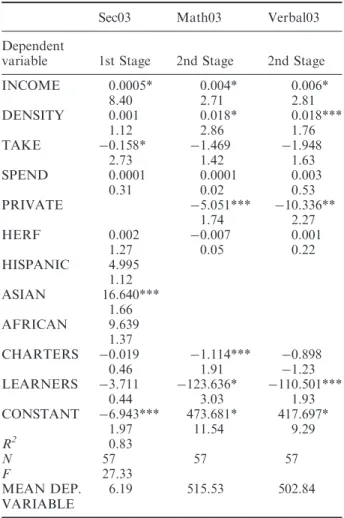
Table 4. 2SLS estimates of secular enrollments on public school performance estimated coefficients (t-statistics in parentheses)
Sec03 Math03 Verbal03
Dependent
Variable 1st Stage 2nd Stage 2nd Stage
Note: *, ** and *** significant (two-tailed test) at 1, 5 and
10% levels, respectively
Ethnicitywasexcludedfromthesecond-stageeduca tion outcome equations because studies have sug gested that English fluency is more important than ethnicityin explainingeducational outcomes.17 High correlation between fluency and ethnicity would likely leadto multicollinearityandthereforeinflated SEsaswell.
V. EstimationResults
Four sets of estimations are discussed with each containingadifferentmeasurementofprivate school enrollment. Only relationships found to be statisti callysignificantarediscussed.Table2displaysresults
16
See, for example, Hamilton and Macauley (1991) and Schmidt (1992).
Table 5. 2SLS estimates of (total) private enrollments on public schoolperformanceestimatedcoefficients(t-statistics inparentheses)
Sec03 Math03 Verbal03
Dependent
variable 1st Stage 2nd Stage 2nd Stage
INCOME 0.0005* 0.004* 0.006* 8.40 2.71 2.81 DENSITY 0.001 0.018* 0.018*** 1.12 2.86 1.76 TAKE �0.158* �1.469 �1.948 2.73 1.42 1.63 SPEND 0.0001 0.0001 0.003 0.31 0.02 0.53 PRIVATE �5.051*** �10.336** 1.74 2.27 HERF 0.002 �0.007 0.001 1.27 0.05 0.22 HISPANIC 4.995 1.12 ASIAN 16.640*** 1.66 AFRICAN 9.639 1.37 CHARTERS �0.019 �1.114*** �0.898 0.46 1.91 �1.23 LEARNERS �3.711 �123.636* �110.501*** 0.44 3.03 1.93 CONSTANT �6.943*** 473.681* 417.697* 1.97 11.54 9.29 R2 0.83 N 57 57 57 F 27.33 MEAN DEP. 6.19 515.53 502.84 VARIABLE
Note: *, ** and *** significant (two-tailed test) at 1, 5 and
10%levels, respectively
for Catholic school enrollments. The first-stage regression indicates that enrollments are positively influenced by income, shares of students of Asian origin and public school spending. Percentages of students in charter schools and taking SAT exams exert negative effects. Second-stage regressions are displayed separately for verbalSAT andmath SAT scores.Incomeexertshypothesizedpositiveinfluences on all test scores. More densely populated counties are found to exhibit higher math and verbal SAT scores. Catholic school enrollments exert negative effects onalltestscoresthussupporting thehypoth esis thatareaswith greaterprivate (Catholic) school enrollment also have relatively lower public school performance.Charterenrollmentsandpercentagesof studentswhoareEnglish-learnersexerthypothesized negativeinfluenceson bothtestscores.
Table 3 displays results for all religious school enrollments. Thefirst-stage regression indicates that
enrollments are positively influenced by income, population density and shares of students of African descent. Percentage of test-takers exerts a negative influence. Second-stage regressions show that income and population density exert hypothe sizedpositiveinfluencesonbothtestscores.Religious schoolenrollmentsexertnegativeeffectsonbothtest scoresthusindicating thatareas withgreaterprivate (religious) school enrollment also have relatively lower public school performance. Percentages of English-learners exert negative influences on both testscores.
Table 4 displays results for secular school enroll ments. The first-stage regression indicates that enrollments are positively influenced by income, public school spending and shares of students of Asian descent. Second-stage regressions show that income exerts hypothesized positive influences on both test scores, that population density exerts positive influences on math SAT scores,and public school spending positively influences verbal SAT scores. Secular school enrollments exert negative effects on verbal, but not math, test scores thus indicating that areas with greater private (secular) school enrollment also have relatively lower public school performance. Charter enrollments and per centages of students who are English-learners exert hypothesizednegativeinfluenceson bothtest scores. Table 5 displays results for all private school enrollments. Thefirst-stage regression indicatesthat enrollments arepositively influencedbyincome and shares of students of Asian descent and negatively related to percent of students taking tests. Second-stage regressions show that income and population densityexertspositive influencesonbothtestscores. Private school enrollments exert negative effects on bothtestscoresthusindicatingthatareaswithgreater private school enrollment also have relatively lower publicschoolperformance.Charterenrollmentsexert negativeinfluenceson mathSATscoresandpercen tages of students who are English-learners exert hypothesizednegativeinfluenceson bothtest scores.
VI. Discussion ofTestResults
First-stageestimations of private schoolenrollments indicatepositiveinfluencesfromincomethussuggest ing that vouchers wouldelicit positive responses by parents seeking greater private school choice to the extentthattuitionissubsidized.Asianenrollmentsin public schools positively influence enrollments of Catholic, secular and all private schools. Public school spending positively influences Catholic and
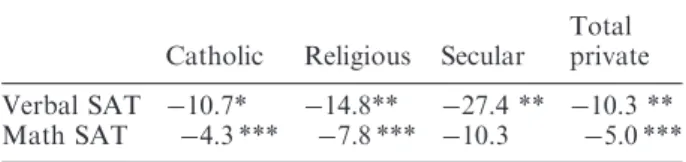
Table 6. Summary of estimated coefficients on private schoolenrollments
Catholic Religious Secular
Total private Verbal SAT Math SAT �10.7* �4.3 *** �14.8** �7.8 *** �27.4 ** �10.3 �10.3 ** �5.0 ***
Note: *, ** and ***significant (two-tailed test) at 1, 5 and
10% levels, respectively
secularenrollments,whichsuggestthatpublicspend ing expansion by itself would not lead to higher public school performance has reflected by higher public enrollments.Public school spendingdoes not exert significant influences on religious or total private enrollments.Greater availability of charters, as measured bypercentage of allstudentsserved by charter schools, only exerts a significant negative effecton Catholic enrollments.Second-stage estima tionsindicatethatfivefactorscontributesignificantly to public school test scores: income (positive), population density (positive), private enrollments (negative), charter enrollments (negative) and English-fluency(negative).
Table 6 compares estimated coefficients of influ ences on public test scores by type of private schooling. Twogeneralconclusions aredrawn. One, effects from private enrollments on (public school) verbal SATs are roughly 50% larger than on math SATs. This differencemay suggest thatparentswho focus on verbalskillsexit publicschools moreoften than those focused on math skills. Two, secular enrollments display largest effects on verbal public school test scores indicating perhaps that secular schoolsservestudentswithrelativelyhighverbaltest scores. The effect on verbal SAT scores is roughly larger by a factor of 2.7 when compared with all private schoolstogether.Thisdifferenceisconsistent with the view that secular schools prepare students for entry into elite universities. Interestingly, the estimated coefficient of the effect of secular enroll mentsonpublicmathSATscoresisnotsignificantly differentfromzero,andthisistheonlycoefficientin thetablethatisnotstatisticallysignificant.However, it should also benoted thatthe effects of theother three private enrollments on math SAT scores are onlysignificantat the10%levelthusindicatingthat overall effects of private enrollments on math SAT scoresarenot particularlystrong whencompared to thoseexertedon verbalSATscores.
Effectsofprivateenrollmentson publictestscores are quiteimpressive whenevaluatedat averageSAT scores. For example, a 10% increase in (combined) privateenrollmentsexertsa20%fall� a103.4point
dropfrom 503 to 399.6 – in public verbalSAT test scores. A 10% increase in (combined) private enrollments exerts a 10% fall – a 50.5 point drop from515 to464.5–in publicmathSATtestscores.
VII. Conclusion
Theevidence indicates thatpublic schooltest scores are inversely related to private enrollments thus supporting the view that private enrollments partly reflect exiting from public schools due to poor academic performance. A 10% increase in private enrollmentsisestimatedtoexerta20%fallinverbal SAT scores and a 10% fall in math test scores of publicschools.Theevidencethereforeindicatesthat, after controlling for other important factors, public schoolsexhibithighertestscoresincommunitieswith relatively lowprivate enrollments.Theevidencealso indicatesthatcharterschoolenrollmentsareexerting negativeinfluencesonpublictestscoresthusreinfor cing the evidencefrom private schoolsthat suggests that traditional public schools are perceived as inferior.
Results should be interpreted with caution. It is inappropriatetosimplyprojecttheseempiricalresults tothefuturebecause estimatesaredrawn from data on currentenrollments thatareunlikelyto resemble future populations. Although more parents may chooseprivate schoolingfollowingexpandedprivate schoolchoice,itremainsuncleariftheywouldexhibit similar commitments to private education and bear childrenwithsimilaracademiccapabilities.Itremains unclearwhat marginal effecta newbatch of private enrollments would exert on test scores of public schoolsanditisunlikelythateffectswouldapproach thosereportedinthisarticle.
Itis alsoprobablyinappropriate to concludethat private school choice reform would lead to perma nent further erosion of public school performance based on our empirical evidence because long-term effects on performance critically depend on how public schools react to heightened private school competition. Proponents of school choice predict changes thatarisefrom thecompetitive model – i.e. exitingtoprivateschoolsisashort-termphenomenon that fades as public schools improve performance. However, another scenario is that public schools somehow fail to stem student flight when, for example, public schools do not view student flight as much of a threat – financially or otherwise – to theirexistence,especiallygivenlowprobabilitiesthat public schools will be shut-down in the process. Private school choice reform that expands private
enrollmentstocriticalcompetitivethresholdsmaybe required beforeimprovements inpublic schoolsmay be detected.18 Some public schools may alsofind it very difficult to improve performance, given that constraintsimposedbyschoolboards,teacherunions or falling peer group quality may hinder improve ment efforts despite growing threats from private schools. Empirical examination of these dynamics requires a longer time period and data sets that include significant changes in private school choice suchassizablevouchers.
Acknowledgements
I am indebted to an anonymous referee for many excellentcomments.
References
Alt, M. N. and Peter, K. (2003) Private Schools: A brief
portrait, in The Condition of Education 2002, US
Department of Education, Washington, DC.
Belfield, C. R. and Levin, H. M. (2001) The effects of
competition between schools on educational outcomes:
A review for the United States, ReviewofEducational
Research, 71, 279–341.
Betts, J. R. (1995) Does school quality matter? evidence
from the national longitudinal survey of youth, The
reviewofeconomicsandstatistics, 77, 231–50.
Blair, J. P. and Staley, S. (1995) Quality competition and
public schools: Further evidence, Economics of
EducationReview, 14, 193–208.
California Department of Education. (2007) Enrollmentand
Staff in California PrivateSchools2003-2004, School
Improvement Division, Sacramento.
Card, D. and Krueger, A. (1992) Does school quality
matter: returns to education and the characteristics of
public schools in the United States, JournalofPolitical
Economy, 100, 1–40.
Coleman, J., Campbell, E., Hobson, C., McPartland, J.,
Mood, A., Weinfeld, F. D. and York, R. (1966)
Equality of Educational Opportunity, Education and
Welfare, Washington D.C.
Dee, T. S. (1998) Competition and the quality of
public schools, Economics of Education Review, 17,
419–27.
Demie, F. (2001) Ethnic and gender differences in educa
tional achievement and implications for school
improvement strategies, Educational Research, 43,
91–106.
Downes, T. A. and Greenstein, S. M. (1996) Understanding
the supply decisions of nonprofits: Modeling the
location of private schools, Rand Journal of
Economics, 27, 365–90.
Friedman, M. (1995) The role of government in education,
by Milton Friedman, in FromEconomicsandthePublic
Interest (Ed.) R. A. Solo, Rutger’s University Press,
New Brunswick.
Greene, K. V. and Kang, B.-G. (2004) The effect of public
and private competition on high school outputs in
New York State, EconomicsofEducationReview, 23,
497–506.
Grogger, J. (1996b) School expenditures and post-schooling
earnings: evidence from high school and beyond, The
ReviewofEconomicsandStatistics, 78, 628–37.
Hamilton, B. W. and Macauley, M. K. (1991) Determi
nants to consequences of public-private school choice,
JournalofUrbanEconomics, 3, 282–94.
Hanushek, E. A. (1986) The economics of schooling,
JournalofEconomicLiterature, 24, 1141–77.
Hanushek, E. A., Rivkin, S. G. and Taylor, L. L. (1996)
Aggregation and the estimated effects of school
resources, TheReviewofEconomicsandStatistics, 78,
611–27.
Hedges, L., Laine and Greenwald, R. (1994) Does money
matter: A meta analysis of studies of the effects of
differential school inputs on school outcomes,
EducationResearcher, 22, 5–14.
Hoxby, C. (2002) School choice and school productivity
(or, could school choice be a tide that lifts all boats?),
National Bureau of Economic Research Working
Paper No. 8873, April 2002.
Hoxby, C. M. (2003) How School Choice Affects the
Achievement of Public School Students, in Choicewith
Equity (Ed.) P. T. Hill, Hoover Institution Press,
Stanford, CA, pp. 141–178.
Jepsen, C. (2002) . The role of aggregation in estimating the
effects of private school competition on student
achievement, Journal of Urban Economics, 42,
477–500.
Kenny, L. W. (2005) The public choice of educational
choice, PublicChoice, 124, 205�22.
Lankford, H. and Wyckoff, J. (1992) Primary and
secondary school choice among public and religious
alternatives, Economics of Education Review, 11,
317–37.
Marlow, M. L. (1997) Public education supply and student
performance, AppliedEconomics, 29, 617–26.
Marlow, M. L. (2000) The effects of spending and school
structure on public education quality, Economics of
EducationReview, 19, 89–106.
Martinez-Vazquez, J. S. B. A. (1985) Private schooling and
the tiebout hypothesis, PublicFinance Quarterly, 13,
293–318.
National Center for Education Statistics, (2002) Digest of
Education Statistics, U.S. Department of Education,
Washington, DC.
18
A weak market share for private schools may result in competitive pressures that do not reach critical thresholds necessary for influencing behaviour of public schools. Hoxby (2003) discusses this possibility. Vouchers and tax-preferences that lower costs of private enrollments would lower price differentials between private and public schooling and likely lead to a greater
competitive presence from private schools. Marlow (1997, 2000), Dee (1998), Hoxby (2002) and Greene and Kang (2004)
report evidence in support of the hypothesis that various forms of competition improve public school performance. Although
opposing evidence is reported in Sander (1999) and Jepsen (2002), Belfield and Levin’s (2001) summary of the literature
Peng, S. S. and Hill, S. T. (1995) Understandingracial-ethnic
differencesinsecondaryschoolscienceandmathematics
achievement, Diane Books Publishing Company,
Darby, PA.
Sander, W. (1999) Private schools and public school
achievement, Journal of Human Resources, 34,
697–709.
U. S. Department of Commerce, (2003) Statistical Abstract
of the United States, Washington.
Tiebout, C. M. (1956) A pure theory of local expenditures,
JournalofPoliticalEconomy, 64, 416–24.
U.S. Department of Education, (2002) National center for
education statistics, PrivateSchools: ABriefPortrait,
(Eds) M. N. Alt and K. Peter, NCES 2002–013,
Washington, DC.
U.S. Department of Education. (2003) National
center for education statistics, Trends in the
Use of School Choice: 1993 to 1999, (Eds) S.
Bielick and C. Chapman, NCES 2003-031,
Washington, DC.
West, E. G. (1990) Public education via exclusive terri
tories, PublicFinanceQuarterly, 18, 371–94.
Zanzig, B. R. (1997) Measuring the impact of competition
in local government education markets on the cogni
tive achievement of students, Economics ofEducation