Working Paper No. 05/2009 (15)
Teaching quality and decentralization
Maciej Jakubowski
Faculty of Economic SciencesUniversity of Warsaw [email protected]
[e-mail]
Abstract
This paper attempts to assess outcomes of school system decentralization in Poland. National examination results are analyzed using the value-added model of teaching quality. Variation in decentralized spending is related to estimates of achievement growth. Exploring exam results for three consecutive student cohorts, we are able to control for hidden characteristics of local governments when estimating their impact on student progress. Preceding the main analysis, the paper provides detailed description of trends in local government school spending and service provision over the last 15 years. The main conclusion is that while there is some evidence that decentralization changed patterns of school expenditure, there is no evidence that expenditures have any systematic impact on teaching quality. There is also no evidence that higher spending translates to more equally distributed outcomes. It seems that the only non-negligible impact local governments could have on student achievement is through provision of preschool facilities. However, evidence presented in the paper suggests that many local governments decided to limit preschool services, especially in poor rural areas. That could importantly increase educational inequalities.
Keywords:
education, inequality, student achievement, decentralization, value-added model, Poland, transition
JEL:
I21, I22, I28, H7Acknowledgements:
Datasets used in this project were prepared by the Regional and Central Examination Boards in Poland. The paper builds on previous research conducted with Irena Topińska in cooperation with
UNDP and CASE – Center for Social and Economic Studies. The author would like to thank all people and institutions involved for financial and research support.
All remaining errors are solely those of the author. Working Papers contain preliminary research results.
Please consider this when citing the paper.
Please contact the authors to give comments or to obtain revised version. Any mistakes and the views expressed herein are solely those of the authors.
I.
Introduction
Fiscal decentralization and decentralization of responsibility for provision and management of public services were proposed in many countries as the solution to increase efficiency and responsiveness of local governments. Policy proposals were supported by numerous theoretical and empirical papers (see Ahmad, Brosio, 2006, for a collection of papers and references). However, empirical research was mostly based on fiscal data. Unresolved problems with quality measurement of public services made any attempts to assess the effectiveness of public expenditures difficult. In the case of education, typical research used data on service accessibility, the only measure usually available in developing countries, or on student test scores. However, education production functions estimated using linear regression with student achievement as a dependent variable could be very misleading when treated as a tool to evaluate policy effects on teaching quality. Test scores depend more heavily on family characteristics and unobserved choices rather than on a school or local government efforts (see Todd, Wolpin, 2003). Typical problems of self selection and endogeneity bias arise in most of the educational research. Additionally, student test scores could be unreliable if not nationally conducted by independent examination centers, especially when between-regions variation is of importance. Thus, even when conducted with test scores as a proxy of teaching quality, any empirical analysis of decentralization is potentially biased by test score correlation with hidden family and local government characteristics.
This paper makes an attempt to limit problems mentioned above by incorporating value-added models and nation-wide standardized examination results. Value-added models explain achievement growth, not the achievement level, because they control for student intake score. Thus, they are able to estimate effect of variables of interest on teaching quality during a particular period of education. They do not solve the endogeneity problem completely because earlier inputs and other hidden characteristics are probably not fully reflected in intake scores, but without a doubt they propose much more reliable way to assess the effects of decentralization. Here they were employed to assess the effects of local government educational spending on lower secondary school teaching quality after several years of decentralization in Poland.
The research explores fiscal and national examination data for all students from three consecutive cohorts. Our method limits impact of any regional or local effects on final results. Reliability of test scores is assured by independent examination bodies which use standardized methods and tests across the country. In a first part of the paper, fiscal and school system data are also used to describe decentralization process making a background for final teaching quality analysis. Providing this data is also an important goal of the paper, because similar information is hardly available for Poland (see companion report by Jakubowski and Topińska, 2007, for more background analysis of decentralization in Poland).
The main empirical question is whether decentralized educational expenditures affect teaching quality measured by student achievement growth. Several hypotheses about the effects of preschool participation (thus, indirectly about preschool expenditures) and spending per student in primary schools are also tested. However, the main focus is on the effects of lower secondary school expenditures. Using value-added models we test whether higher expenditures per student increased teaching quality measured by achievement growth during the period of lower secondary education. We also test whether expenditure similarly affects students despite their intake score level. In
addition, we provide some evidence about class size and peer effects but these were not main topics of the study.
Economics of education literature is quite rich in empirical papers analyzing a link between inputs and school outputs. There is no consensus about the effectiveness of inputs in education and methodological issues are still controversial (see discussion of Hanushek, 2003, and Krueger, 2003). This paper adds to the literature by providing new evidence from value-added models. It is distinct because concentrates on decentralization and impact of differences in local government spending and school management, rather than on expenditures per se. Thus, its focus is not on general relation between expenditure and achievement but on the impact of decentralized expenditure on teaching quality.
The paper is organized as follows. Section II overviews decentralization in Poland, while section III discusses crucial reforms conducted in 1999 and 2000. Section IV presents data on accessibility and expenditure on preschool, primary and lower secondary education after decentralization. Section V presents methodology and describes datasets used in the main analysis of the effectiveness of decentralized spending. Section VI presents results of this analysis and section VII concludes.
II.
Overview of decentralization in Poland
Decentralization started in 1991 at the very beginning of transformation in Poland. From the very beginning was strongly supported by a newly elected first democratic government. It was believed that decentralization will boost development of civil society and will increase efficiency of locally provided services. Usual arguments were made, e.g. that local representatives know better local conditions and needs, are more able to supervise service provision, and could be held accountable to citizens. However, it could be argued that decentralization was implemented so quickly because democratic powers saw it as a way to dismantle the communist state and its local bureaucracy. Local governments were expected to become a political base for new democratic powers.1
The law needed to conduct local government elections was passed in a great hurry as early as in 1990. A few weeks before the election of 1990, the law defining the division of responsibilities between gminas, the lowest level of the sub-national government, and the central government authorities was adopted. About 2500 gminas were established in 1990. This number slightly changed during the period of transformation. In 2006, there were 2478 gminas from which 307 were urban, 1591 rural and 580 mixed (rural/urban). The smallest gmina has less than 1500 inhabitants, the biggest one has more than 1.5 million (capital city, Warsaw). Most gminas have from 5 to 10 thousand inhabitants.
In 1999, a major administrative reform introduced the middle level (“powiat”), and scaled down the number of voivodships constituting the highest sub-national level of government. In 2005, there were 314 powiats and 16 voivodships. Most powiats have from 80 to 100 thousand inhabitants and voivodships have from 1 to 5 million inhabitants. Additionally, there are 65 city-powiats which are
1 This discussion is partly based on interesting works of Regulski (2003) and Levitas (1999). Recent discussions
the biggest cities comprising the tasks of gmina and powiat. In this paper, city-powiats are analyzed together with other municipal gminas.
The Local Government Act of March 8, 1990 states that the scope of gmina activity extends to all public matters not reserved in legislation for other entities. This act defines gmina own responsibilities including spatial order, local infrastructure and public transport, water supply, sewage and waste removal, health care, education, municipal housing, social welfare, culture, public order, fire departments and others. This list of responsibilities is quite general and in some cases without practical significance. At the end of 1990, the Law on Gmina Revenue and Subsidization and at the beginning of 1991 the Law on Local Taxes and Fees were passed. Gminas were guaranteed independent budgets and revenues from own taxes, shares of income taxes (PIT and CIT), subsidies and grants. Thus, at the very beginning of transformation sub-national governments were established as politically and fiscally autonomous authorities (see Levitas, 1999, for more detailed discussion).
The focus of this paper is on gmina, which is the lowest level of local government in Poland. Gminas differ from other sub-national governments not only in the list of responsibilities and their role in social services provision but also in the way they are financed. Thus, findings that follow do not necessarily apply to powiats and voivodships. Gminas’ expenditures are much bigger than expenditures of other sub-national governments. In recent years, gminas have spent as much as 8% of GDP while powiats less than 2% and voivodships less than 1% of GDP. In gmina budgets education is the biggest single category (between 35-40% of total expenditures and around 50% in rural areas, depending on the year). Gmina also spend substantial amount of money on social welfare (10-15%). On the other hand, health makes only a few percent of gmina budgets (almost nothing after 1999) and other expenditures are related mainly to infrastructure and administration.
In 1991, newly established gminas were given a right to collect local taxes and fees. However, these rights were quite limited and have not been significantly extended. Still local taxes and fees are centrally regulated and more than a half of gmina budgets come from the central budget in the form of shares of income taxes (PIT and CIT) and subventions. The shares of PIT and CIT assigned to gminas changed during the transformation and its relative importance in the sub-national budgets was also varying. PIT and CIT are central taxes and gminas has no right to modify them. Gminas could alter the tax base for local taxes or increase local fees but they rarely use this otherwise limited opportunity. The most important point is that gminas have some flexibility in allocating money from their own revenues, shares of PIT and CIT, and funds transferred through the general subvention. In theory gminas are free to allocate these money but some payments have to be made with a leading example of centrally set teacher salaries that are one of the most important categories in gmina budgets. Shortly, gminas can freely allocate funds from these three sources if they fulfilled their obligatory payments. It is worth noting that more than 90% of the general subvention received by gminas is so called “educational subvention”. The way the subvention is calculated is discussed in the next section.
Usually it is assumed that due to decentralization local authorities will exercise their rights to determine revenues and expenditures trying to satisfy local preferences. In general, Poland looks as a highly decentralized country given relatively high share of local expenditures and a long list of sub-national responsibilities. But these figures could be misleading. Some very important tasks are still regulated centrally (e.g. payment of teacher salaries) and most sources of gmina revenues are also
centrally set, even if they are classified in the budgetary category ‘own’ resources. The essential fact is that such limitations could weaken expected effects of decentralization.
Nevertheless, the decentralized system has its own distinct dynamic. An important question is whether local revenues and expenditures, as well as accessibility and quality of services, changed because of decentralized decision-making. The box plots on the Figure 1 below show differentiation of gmina total revenues per capita for 1996-2004, separately for rural and urban gmina.2 It is easily seen that differentiation among urban gminas is much bigger. Obviously urban gminas differ from rural ones in expenditure assignment. However, while variation of rural gmina revenues was quite the same during these years (with a noticeable change between 1998 and 1999 when some responsibilities were transferred to newly introduced middle-tier local governments called powiats), the variation among urban gminas significantly increased. If we expect that expenditures affect service quality then these quite dramatic changes should have visible impact on services provided. Especially, one could expect that increasing variation in revenues should affect variation in spending, accessibility and quality of services.
Figure 1. Rural and urban gmina revenues per capita 1996-2004
2
The graph box summarizes data distribution by showing the distance between adjacent values (the vertical line segment) and the 25th and 75th percentile (the box). Horizontal line within the box shows respective median. The longer the vertical line and the box the more spread is the distribution. Notice that rural/urban mixed gminas have been excluded in order to make graph clearer.
5 0 0 7 5 0 1 ,0 0 0 1 ,2 5 0 1 ,5 0 0 1 ,7 5 0 1996 1997 1998 1999 2000 2001 2002 2003 2004 1996 1997 1998 1999 2000 2001 2002 2003 2004 rural urban g m in a t o ta l re v e n u e s p e r c a p it a
Source: BDR, Central Statistical Office
III.
Decentralization of education and reforms of 1999/2000
The Act on Local Government of 1990 stated that preschool and primary education is the gmina own responsibility. In 1991 non-obligatory preschool education was nearly fully financed from gmina revenues. Gminas were allowed to set the network of kindergartens in their area and to collect fees from parents. The process of decentralizing primary schools was more gradual. During the 1991-1996 some gmina took over the responsibility for primary education and some city-powiats became responsible for secondary schools. In 1996 ownership rights of almost all public schools were finally transferred to gminas. In 2005 98% of primary school students were at schools run by gminas and only 0.2% of them were at schools owned by the central government. Rest of the students were served by privately run schools: 1% in schools run by NGOs, 0.3% in schools with religious affiliation and 0.5% in schools run by other entities, mostly teachers or private business.3
Thus, it could be said that by the end of 90s local governments took over the responsibility for preschool and primary education. In line with the transfer of ownership rights, reforms on financial side were introduced. In 1993, the new Law on Gmina Finance was passed making the Ministry of Education responsible for developing a special algorithm that would allocate education subsidy to cover gminas’ school running costs. There were various political and technical difficulties in developing the algorithm.4 Before 1999 the algorithm allocated funds to gminas according to the number of pupils, teachers and historical costs. Notably, despite the algorithm, there were ‘hold harmless’ clauses which stated that the total subvention for any gmina should not be less than 100% or more than 110% of the previous year subvention (inflation adjusted). Therefore, many gminas received subvention based in fact on historical costs. Per student cost differences between jurisdictions remained dramatic and unjustified. Such allocation could not be seen as ‘just’ and at the same it did not guarantee the full coverage of teacher wages. The need for some objective criteria in calculating subvention was quite apparent. Importantly, because historical costs were the basis for financing, incentives to modify local school systems were highly limited.
The education reform of 1999 (which began in the school year 1999/2000) implemented major changes. It modified organization of the school system and introduced new ideas regarding curriculum, school assessment and teacher development. However, its strongest impact on gmina policies was due to the new method of calculating educational subsidy from the central government. New financing scheme, fully introduced in 2000, had tremendous impact on many gmina because it was no longer based on historical costs. Thus, the year 2000 can be seen as a major shock which really boosted decentralization. Many gmina started to seriously think about organization of schools in their area, because of dramatic change in financial support from the central government.
In 2000, a new algorithm was introduced which was truly based on a per-pupil formula. The most important change was that now the ‘hold harmless’ clause said that subvention per student (not the total amount of subvention, as before) should be kept within a given range. This made an important difference. Secondly, more funds were allocated to powiats which had very limited ‘own’ revenues and were made responsible for upper secondary education. The algorithm which in modified version is still in use today comprises several coefficients (weights) adjusting the amount finally allocated. The most important weight regards students in rural schools and it reflects higher average costs of
3 Data from the Central Statistical Office (see GUS, 2006, “Oświata i wychowanie 2005/2006”). 4
service provision in rural gmina. However, this weight coefficient is changed almost every year depending on political power of representatives of urban and rural gmina.5
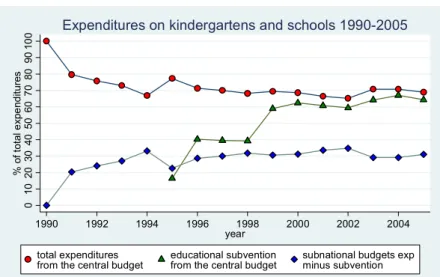
The process of decentralization of education finance during the whole period of transformation is presented on the figure below. In 1990 all funds were transferred from the central budget directly to schools. A few percent of total expenditures was allocated this way in recent years. At present, about two third of total expenditures is transferred to sub-national budgets through the general subvention and about 30% is the additional amount spend directly from the sub-national government own revenues. Notice that while in 1996 almost all schools were already owned by gminas, some funds were still transferred without using the subvention. After 1999, almost all funds for public education are transferred to gminas through the general subvention.
Figure 2. Expenditures on preschool and school education, 1990-2005.
The algorithm introduced in 1999 was supposed to be based on measures of objective costs. This should be supported by legislation defining standard costs and quality of basic educational services in relation to such measures. None of those were defined and at the same time teacher professional attainment system was introduced. This system fixes teacher salaries levels and limits the way local governments could affect them. Moreover, teacher salaries were not reflected in the algorithm. Thus, many local governments saw the new system as an unfunded mandate. Some of them were faced with the problem of rising wage costs not mirrored by increase in the subvention. Others quickly learnt how to cut costs and even save funds from the educational subvention for other expenditure. The wave of school closure and reorganization of school system started in 2000.
Reorganization was also required because of introduction of lower secondary schools called “gimnazjum”. In 1999 first student cohort went to the first grade of gimnazjum instead of the seventh grade of primary school. Since 2001, all students financed by gmina were in 6-year primary
5
At the same time the category of ‘rural’ gminas is very mixed. Some rural gminas are quite rich (e.g. gminas in Warsaw agglomeration or gminas were huge mining companies are placed). There is also a large group of rural gminas with very limited sources of own revenues. Thus, it is claimed that the educational subvention
algorithm is not really based on objective categories and this put some gminas into financial troubles (see Swianiewicz et al., 2005; Jakubowski, Topińska, 2007).
0 1 0 2 0 3 0 4 0 5 0 6 0 7 0 8 0 9 0 1 0 0 % o f to ta l e x p e n d it u re s 1990 1992 1994 1996 1998 2000 2002 2004 year total expenditures
from the central budget educational subventionfrom the central budget subnational budgets expminus subvention Source: Central Statistical Office. Subnational govs: before 1998 only gminas; after 1999 gminas and powiats
school or 3-year gimnazjum, while students financed by powiat were in 3 or 4-year upper secondary schools. The expectation was that lower secondary schools will guarantee better quality of education because gimnazjum were bigger and better equipped than primary schools. The common believe was that especially in rural areas small primary schools were of poor quality and that gimnazjum opens an opportunity to collect students from wider area in one well-funded school. The reformers claimed that this way efficiency will be improved by lowering overall costs and enabling investments into quality of teaching. Importantly, introduction of gimnazjum forced all local governments to rethink their education policy because new capital investments and strategic choices were needed. Thus, impact of the 1999/2000 reforms on local governments policies cannot be underestimated.
While by the end of 90s ownership rights to preschool, primary and lower secondary schools were finally transferred to gmina, the central government still regulated teacher professional requirements and salaries, supervises schools, defines curriculum and accepts textbooks. Local governments (also powiats in the case of secondary education) own schools and, in principle, they are responsible for the way the educational services are provided. In practice, their rights are importantly limited by Law, decisions of Ministry of Education and high autonomy of school principals. Thus, while we will focus on decentralization effects assuming that any variation in expenditures is caused by decentralization it is not fully true because local governments have to conduct according to central rules. However, they are still responsible for school expenditures and organization on the margin. Within local government changes in expenditure, when controlling for overall trends, could be attributed mainly to their policy choices. This paper explores these changes in relation to student achievement growth.
IV.
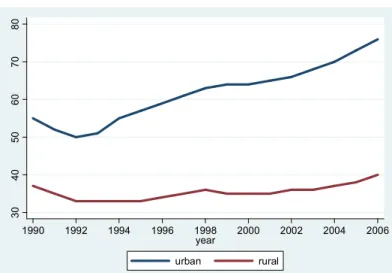
Accessibility and expenditures on preschool, primary and lower secondary education This part presents aggregate data on accessibility and expenditures on preschool and school facilities of local governments during the transition. Using the data from the Central Statistical Office we can calculate separate indicators for rural and urban areas, which is of importance because these two types differ in many characteristics, mainly in objective costs of provision of educational services. On the first figure the participation of 3-6-year-olds in preschool education is depicted. In the beginning of transformation, when preschool education was immediately decentralized, the participation rates decreased dramatically. That shows how local governments responded to new responsibilities for which no central funds were provided. After few years those rates started to increase in municipal gminas, however, in rural gminas they remained very low till recent years despite the 3-6-year-old population decline.Figure 3. Participation of 3-6-year-olds in preschool education
The recently observed increase in participation rates was due to increase in participation of 6-year-olds in so-called “zero-classes”. These school preparatory classes were made obligatory by the central government in 2004. Thus, it has nothing to do with local governments’ policy. Participation level among 3-5-year-olds is dramatically low, much lower in rural gminas than in urban areas (18% comparing to 38%). Thus, most gmina did not seize the opportunity created by population decline to keep existing network of preschool facilities and to improve participation level. Data show that in many gmina just the opposite happened. Percentage of gmina with at least one kindergarten decreased in rural areas from 73% to 66%. In effect, between-gmina variation in preschool accessibility slightly increased with some dramatic regional differences.6
The common view among experts is that preschool education is one the most effective tools to increase equity in education systems or, in other words, to enhance educational opportunities for children from disadvantaged or poor families (see OECD, 2006; and Zahorska, 2003, for discussion in a Polish context). Data analyzed here show that preschool participation level remained almost the same regardless population decline. More importantly, many gminas closed their kindergartens with some of them completely resigning from providing such services in their area. To sum up this point we should emphasize that decentralization had no positive impact in this regard and while situation is not getting worse, the level of participation in preschool education in Poland is one of the lowest among OECD countries.7 Increasing financial burden on gmina and making kindergarten expenditures non-obligatory, produced an incentive for local governments to withdraw from providing education services for 3-5-year-olds. Many gmina decided to close kindergartens or at least not to increase preschool participation rates despite the potentially negative longtime impacts on human capital level in their area.
As discussed already, primary schools were finally transferred to local governments in 1996 and in 1999 lower secondary schools were established. Until 1999 the central government was financing schools according to historical costs, but from 1999 funds are transferred using the per pupil formula and non-marked grants. The Law allows local governments to spend their own money on schools or
6
In Opolskie region 51% of 3-5-year-olds go to kindergartens while in Podlaskie region this is less than 26% with many gmina not providing preschool education at all.
7
See annual OECD reports “Education at the Glance”.
3 0 4 0 5 0 6 0 7 0 8 0 1990 1992 1994 1996 1998 2000 2002 2004 2006 year urban rural
to save some funds for other expenditures, if they were able to lower costs. Thus, there was the room for diversification of expenditures despite the central control over school organization.
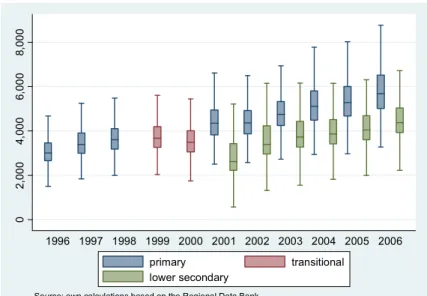
There is no point to discuss accessibility of obligatory school education because participation rate in Poland approaches 100%. Thus, in the case of schools we focus on expenditures and quality of education. Figure 4 below describes the change in average expenditure per student and its variation among gmina in 1996-2006.8 All expenditures were deflated using the HICP Eurostat index with 2005 as a reference year. On the figure we have expenditures per primary school student and separately per lower secondary school student. For transitional years 1999 and 2000 we calculated expenditures as a sum of primary and lower secondary school expenditures, because it seems not possible to reliably separate them.
Figure 4. Variation of gmina expenditure on primary and lower secondary schools (expenditure per student in 2005 prices)
It is clear from the boxplots above that average gmina expenditure (in constant prices) was much higher in 2006 than in 19969. Note, however, that as a percentage of GDP these expenditures were almost the same in 2006 as in 1996. Thus, increase in costs was in line with overall development of the Polish economy. What is more interesting is the substantial variation in gmina expenditures. Another thing worth mentioning is the lower average cost of lower secondary schools. That can be explained in two ways. First of all, these schools are bigger and could benefit from economies of scale which are easier to achieve in the case of secondary education. Second, and more importantly, these schools were organized from the beginning by local governments which were not bounded by historical solutions. Thus, expenditures on lower secondary schools depend more heavily on local governments choices, therefore, are the best source to analyze the impact of decentralized decision-making. Our goal in this paper is to see whether observed variation affects teaching quality.
8
At the time of writing this paper fiscal and school data were available only for this period. The data are published at the gmina level by the Central Statistical Office in the Regional Data Bank.
9
The boxes represent the 25th (lower hinge), median (line in the middle), and the 75% percentile of expenditures per student in a particular year, while lines range from the lowest and the highest adjacent values. Outliers are not presented.
0 2, 0 0 0 4 ,0 0 0 6 ,00 0 8 ,0 0 0 1996 1997 1998 1999 2000 2001 2002 2003 2004 2005 2006
Source: own calculations based on the Regional Data Bank
primary transitional
V.
Impact of decentralization on teaching quality: data and methodology
Decentralization is a multidimensional process which is hard to assessed using one criterion. In economics it is typically evaluated from the fiscal perspective, while political or societal goals are rarely discussed. When it comes to social services quite often only poor proxies of service quality are employed in an analysis because of lack of proper data or difficulties in describing outcomes quantitatively. Education is not an exception. Teaching outcomes are difficult to assess and test results are mistakenly treated as measures of school quality. Simply taking test scores as proxies for quality is invalid, even in the presence of standardized examination, unless proper identification strategy is employed.
This paper starts with simple cross-sectional analysis of pooled three-year examination data for primary schools. Multilevel random effects model helps to estimate school and gmina effects, however, it is not able to control for hidden student characteristics. We use this model to test hypothesis about preschool’s education impact on primary school outcomes. Our main analysis focuses on lower secondary schools were value-added models could be employed. We propose the value-added models to assess the impact of decentralized expenditures on teaching quality. These models incorporate student intake scores to assess achievement growth during the period of lower secondary education. It is widely believe that they are more reliable than typical education production function approach with student test scores as an outcome and set of background characteristics among control variables. The point is that intake scores measure hidden ability of a student and also partially reflect earlier educational inputs. Thus, while value-added models are still far from experiments where causal impact could be directly estimated, they provide reliable estimates under the assumption that intake scores fully incorporate characteristics affecting the level of achievement and explanatory variables in the model fully control for characteristics affecting achievement growth. Surely, these are strong assumptions but they are much less stringent than those underlying typical cross-sectional research with no intake score among regressors (see McCaffrey et al., 2005, for in deep discussions of value-added modeling in education)
This paper uses two sources of data. First, it explores Regional Data Bank from the Central Statistical Office where fiscal, demographic and school system data are collected at the local government level. Based on this data we construct indicators of per capita spending on education and participation rate in preschool education for every gmina in Poland10. Several constructed indicators were used in the econometric model:
a) Average spending per student per year during the time of education in primary school b) Average spending per student per year during the time of lower secondary education c) Preschool participation rate among 3-6-year-olds
d) Gmina overall expenditure per capita
These variables were linked to students under assumption that they didn’t move between gmina during the education in the lower secondary school (in the case of lower secondary school expenditures) or they didn’t move to other gmina during the period of preschool and primary school
10
For small number of gmina it was not possible to link data from different years, because of change in regional codes. However, the number of not linked observations was negligible and we were able to calculate per student expenditures and preschool participation rates for 99% of gmina.
education (in the case of preschool participation rates and primary school expenditure). Please note that most of the lower secondary school movers were not present in the dataset because their scored were not linked (see below) and at the same time moving during preschool and primary education is relatively rare in Poland. Thus, for the majority of cases those assumptions hold.
In the models presented below we use as additional control variables: the natural logarithm of a number of students in gmina, a number of students in a school, and a set of dummies for gender, being dyslectic, regional examination boards, types of gmina (rural, urban, mixed), and year. We also calculated a school’s average intake score as a proxy for social background, peer effects, or so-called compositional effects. Similarly, we used interquartile range as a proxy for intake knowledge variation. Except student test scores and dummies for gender and being dyslectic, other Indicators were calculated at a gmina or school level. They were linked to individual student scores, so every student from the same gmina or school has the same value of these indicators. However, if the lower secondary school student was previously studying in primary school in another gmina, then indicators from this gmina were linked to his test scores.
Datasets with exam results were produced for the purposes of value added analysis of teaching quality of lower secondary schools. The process of linking primary and lower secondary school test scores was described elsewhere (Jakubowski, 2008). However, few important things are worth to mention here. Firstly, less than 10% of student scores were not linked, because student moved to a region of another Regional Examination Board or there was no information in the database to identify scores on both primary and lower secondary school exams (there is no common student ID and scores were merged based on student name, gender, and date of birth). It is reasonable to assume that most of the missing student observations were missing at random. They were not included because of mistakes in student files. It could be seen as more problematic that there are missing data for students who moved to another region. However, it is hard to imagine why including such students could seriously affect final results, especially if intake scores of other students are taken into account in multilevel model.
Secondly, the test scores were not standardized to have similar interpretation every year. However, they were equated to have similar distribution and basic statistics which makes them comparable under assumption that the underlying latent distribution of achievement didn’t change between years11. In other words, scores were transferred to the same scale under the assumption that student cohorts are similar each year. This assumption is roughly valid because we have data for whole population and one could legitimately expect that in a three-year period hidden characteristics of student population did not change significantly. Finally, test scores were collected for official reasons and are not accompanied by background variables, e.g. parental education, because it is not legally possible to collect those characteristics during national examination in Poland. Thus, the set of individual characteristics is limited to gender and dyslexia. However, we expect student intake scores to reflect their family background and hidden abilities better than any other control variables.
We start with a basic three-level random effects model defined by the equation given below: isg sg g g g isg
w
p
u
v
y
=
π
0+
X
isgβ
k+
π
1+
π
2+
+
+
ε
[1]11 The method of equipercentile equating was employed using the RAGE-RGEQUATE software (see
where yisg, is the score of i-th student on the exam at the end of primary or lower secondary school s in gmina g, Xisg is a vector of individual, school and gmina characteristics, wg is an expenditure per lower secondary school student in gmina g, pg is a preschool participation rate in gmina g one year before a beginning of student’s primary education, εisg is an individual error term, ug is a gmina random effect and vsg is a school random effect. As usual it is assumed that ~ (0, )
2 ε
σ
ε
isg N , ) , 0 ( ~ u2 g N uσ
, and vsg ~N(0,σ
v2).This simple three-level model with random effects explains the level of achievement at the end of primary or lower secondary school controlling for some individual characteristics, but mainly for school and gmina level covariates. This model is not able to control for student ability or intake knowledge and thus cannot be used to judge school effectiveness. It should be interpreted with great caution when it comes to assessing the impact of gmina policy on teaching quality. However, we estimated this model with three years data controlling for gmina and school random effects as well as for region, type of gmina, and year fixed effects. We also used some background variables like the number of students in school and in gmina, gmina’s income per capita, and set of dummies for the type of area and region. Several equations were estimated, adding additional variables to see how they interplay with other covariates in a model. Sets of covariates used in each regression should be clear from the results tables presented in the next section. This basic model is the only model we could estimate for primary schools, because intake scores are not available in this case.
After estimating the basic model we turn to the value-added model given by the equation below: isg sg g isg isg g isg w spr spr u v y =
π
0 +Xisgβk +π
1 +π
2 +π
3 2 + + +ε
[2]where
spr
isg is the intake score of i-th student, namely the score obtained at the end of primary school. The model controls for intake scores, so the remaining variation in final scores could be attributed to the time of lower secondary education. Thus, this model importantly differs from that in equation [1] because it attempts to explain achievement growth, not the achievement level. This crucial distinction should be kept in mind when comparing results from these two models.A quadratic term of intake scores was added to fit the non-linear relationship between intake and final scores caused by discrepancies in measurement and score distribution (por. Jakubowski, 2008). However, it should be noted that by doing this we assumed that school quality is not correlated with individual student intake scores or that we want to compare schools fully conditioning on intake scores of their students. If better students temp to collectively attend better schools the model is not able to separate effects of a non-linear relation caused by non-standardized score distribution from a non-linear relation caused by greater effectiveness of schools with high achievers. Thus, uncertainty about interpretation remains. Please note, however, that usually perfectly linear relation between intake and final scores is caused by assuming test scores to be normally distributed. Thus, similar assumptions to those made by us above are usually hidden and not discussed explicitly. Nevertheless, we also control for lower secondary school’s average intake score to explicitly model school compositional effects.
Among individual characteristics we included all variables present in the Central Examination Board databases. These were dummies for gender, being dyslectic (separate dummies for primary and secondary school), and for students who automatically obtained maximum score, because they
succeeded in national school competition in science or language12. Inclusion of those variables helped to explain small amount of test score variation but have no impact on crucial estimates at the gmina and school level.
A parameter of interest is the coefficient for the wg variable. In the case of primary education it measures the effect of expenditures on student achievement level. In the case of the value-added model for lower secondary schools it measures the effect of expenditure on student achievement growth. A positive estimate of this parameter means that higher expenditure positively affects teaching quality. We are also interested in effects of earlier educational inputs, namely primary school expenditure and preschool participation. Note, however, that we cannot directly assess the effects of preschool and primary school inputs in the value-added model because they are partly affecting intake scores already included in the model. Thus, they serve as additional controls and estimates of their effects should be interpreted cautiously.
Finally, we used interaction terms to test two separate hypotheses. In the case of primary education we asked whether higher participation rate affects the effect of gmina expenditure. In other words, we tested if early educational inputs are multiplicative. In the case of lower secondary education we were interested not only in the average effect of expenditure on achievement but also in how expenditure affect students with different intake scores (different achievement levels). Thus, we estimated interaction term of expenditure and intake score in the model where intake score was allowed to randomly vary between gmina. Thus, we tried to explain random variation in intake score slope by gmina expenditure. Positive sign of the estimated coefficient of the interaction term would support a conclusion that higher expenditure makes intake score slope steeper which means that expenditure benefit high achievers mainly. With negative coefficient an opposite claim could be made, namely, that expenditure help to equalize educational opportunities by increasing a chance of low achievers to obtain good final score. Note that equalizing effect could be accompanied by overall higher achievement growth or just the opposite. To allow for any possibility we didn’t restrict the correlation between intercept and slope and estimated it from the data. In the random slope model we allowed only gmina intercepts to vary. Including school effects in the regression didn’t affect the results importantly in this case.
The lower secondary random slope value-added model is defined by the equation given below: isg g isg isg g g g isg w w spr spr u y =
π
0 + +π
1 +π
2 +π
3 +ς
+π
4 2 + +ε
~ ) ( k isgβ X [3]where
s
~
p
r
isg is the intake score centered differently in two distinct models. In the first case, it is centered on the „grand mean” (population mean). In the second case, it is centered on the 10th percentile of gmina intake score distribution. Centering of intake scores is necessary if one wants to obtain interpretable results. Centering on the average for whole population (“grand-mean”) gives similar model to the one without centering, but makes results directly interpretable: effects of interest are calculated for the average student in the population. Centering on the group’s 10th percentile creates distinct model which estimates impact on low achieving students (see Raudenbush, Bryk, 2002; de Leeuw, 2005).π
2 is the average intake score slope,π
3 is the interaction term of interest which reflects the effect of expenditure on the intake score slope, andς
g is the12
Dyslectic students who wrote slightly different version of the exams as well as students who won the national competition were not equally distributed across regions for reasons independent from schools and gminas, which could bias the results.
random slope effect. Negative sign of the
π
3is expected if the expenditure has “equalizing” effect on learning outcomes. As usual it was assumed that random slopes are normally distributed. Additionally we allow random slopes and intercepts to correlate,cov(
u
g,
ς
g)
≠
0
, which was discussed already.All regressions were estimated using the restricted maximum likelihood method, which is a default option in the xtmixed procedure in the Stata statistical package (see Rabe-Hesketh, Skrondal, 2005). A direct advantage of random effects model is that standard errors were calculated correctly taking into consideration clustering of students at the gmina and school level. While three-years period is too short to run fixed effects panel data model, the random effects model benefits from the within and between variation to estimate the effects of interest. However, to obtain unbiased estimates researcher has to include all important covariates correlated with a variable of interest and an outcome. The value-added model controls for individual and school mean intake scores. This way we were able to explain more than 50% of student lower-secondary test score variation (see Jakubowski, 2008, for details). Thus, intake scores are extremely good predictors of future achievement and by including them we importantly limited a potential omitted variable bias. Additionally, differences in gmina funding and objective costs of education were taken into account. We included ‘type of gmina’ dummies which play crucial role in the educational subvention algorithm. This way we almost fully controlled for discrepancies in the level of central funding. Additionally, we included the number of students in a school or gmina which strongly correlates with objective costs of providing educational services (see Swianiewicz et al., 2005). However, school and class size are usually strongly endogenous variables and their effects should not be interpreted as causal effects of these characteristics, but rather as additional controls for gmina and school resources (see Jakubowski, Sakowski, 2006).
VI.
Discussion of results
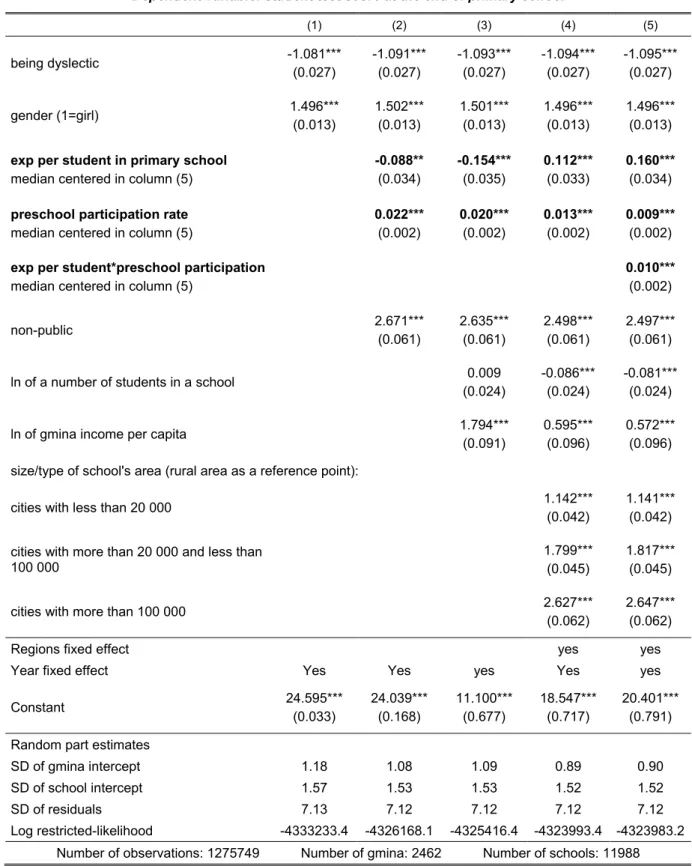
We first discuss results for the model explaining primary school test scores, as defined by the equation [1]. Table 1 gives estimates obtained from several regressions with different covariate sets, based on the pooled three-year data (2002, 2003, and 2004). Two coefficients are of primary interest here. The effect of expenditures and the effect of preschool participation. While the sign of the latter is positive as expected, the sign of the former depends on the set of regressors included. Columns (4) and (5) should be treated as final specifications, with all possible controls included. They differ by interaction term of preschool participation and primary school expenditure presented in the column (5). Results in columns (2) and (3) suggest that expenditure has negative effect but this could be attributed to insufficient control for differences in a level of central funding for rural/urban gmina. If we control for school location and region fixed effects, in column (4) and (5), expenditure positively affect student test scores with statistically significant estimate. Note, however, that comparing to the basic model in column (1), adding covariates only slightly lowers unexplained variation at the gmina and school level. The predictive power of the model seems to be quite low.
The last column presents results of the regression with interaction term of primary school expenditures and preschool participation. Note, that in this case interacted variables were centered to obtain meaningful results. Namely, expenditure per capita and preschool participation rate were centered on their three-year median in each gmina. This way the estimates could be interpreted as reflecting the effect for a median expenditures and participation levels. We used median, not the mean, as the more robust measure of central tendency. Distribution of expenditure and preschool rate were slightly skewed with many extreme values. However, the choice of location for centering has negligible impact on final estimates. The estimates of the effect of expenditure and preschool participation are similar to those obtained previously, but positive estimate of interaction term suggests that these effects are multiplicative. Thus, it seems to be that the higher is the participation rate the more effective are future expenditures.
One could also find other estimates as interesting. Note, that school size effect became negative when additional controls for regions and types of area were included. This is in line with quasi-experimental evidence on class size effect in primary schools in Poland which shows that positive effect observed in regression analysis could be heavily biased, if insufficient controls are employed (see Jakubowski, Sakowski, 2006). In this case controlling for school location and region fixed effects seems sufficient to retain negative effects of school size, which in Poland is strongly correlated with class size. The positive sign of overall gmina income per capita (a total yearly income divided by a total number of citizens) is probably reflecting an impact of citizens’ wealth on test scores. This is because gmina income contains large shares of PIT, CIT, and other household taxes. It also proves to be a good proxy for some wealth related characteristics of local communities. Dummy effects for school location are in line with previous research confirming lower scores of rural students and notably better performance of students in the largest cities. Note that despite the correction for student clustering standard errors are very low, because of the large number of observations at each level of analysis. The dataset provides an opportunity to assess expenditure effects with very high precision.
Table 1. Primary school regression results.
Dependent variable: student test score at the end of primary school
(1) (2) (3) (4) (5) being dyslectic -1.081*** (0.027) -1.091*** (0.027) -1.093*** (0.027) -1.094*** (0.027) -1.095*** (0.027) gender (1=girl) 1.496*** (0.013) 1.502*** (0.013) 1.501*** (0.013) 1.496*** (0.013) 1.496*** (0.013) exp per student in primary school
median centered in column (5)
-0.088** (0.034) -0.154*** (0.035) 0.112*** (0.033) 0.160*** (0.034) preschool participation rate
median centered in column (5)
0.022*** (0.002) 0.020*** (0.002) 0.013*** (0.002) 0.009*** (0.002) exp per student*preschool participation
median centered in column (5)
0.010*** (0.002) non-public 2.671*** (0.061) 2.635*** (0.061) 2.498*** (0.061) 2.497*** (0.061)
ln of a number of students in a school 0.009
(0.024)
-0.086*** (0.024)
-0.081*** (0.024)
ln of gmina income per capita 1.794***
(0.091)
0.595*** (0.096)
0.572*** (0.096) size/type of school's area (rural area as a reference point):
cities with less than 20 000 1.142***
(0.042)
1.141*** (0.042) cities with more than 20 000 and less than
100 000
1.799*** (0.045)
1.817*** (0.045)
cities with more than 100 000 2.627***
(0.062)
2.647*** (0.062)
Regions fixed effect yes yes
Year fixed effect Yes Yes yes Yes yes
Constant 24.595*** (0.033) 24.039*** (0.168) 11.100*** (0.677) 18.547*** (0.717) 20.401*** (0.791) Random part estimates
SD of gmina intercept 1.18 1.08 1.09 0.89 0.90
SD of school intercept 1.57 1.53 1.53 1.52 1.52
SD of residuals 7.13 7.12 7.12 7.12 7.12
Log restricted-likelihood -4333233.4 -4326168.1 -4325416.4 -4323993.4 -4323983.2
Number of observations: 1275749 Number of gmina: 2462 Number of schools: 11988
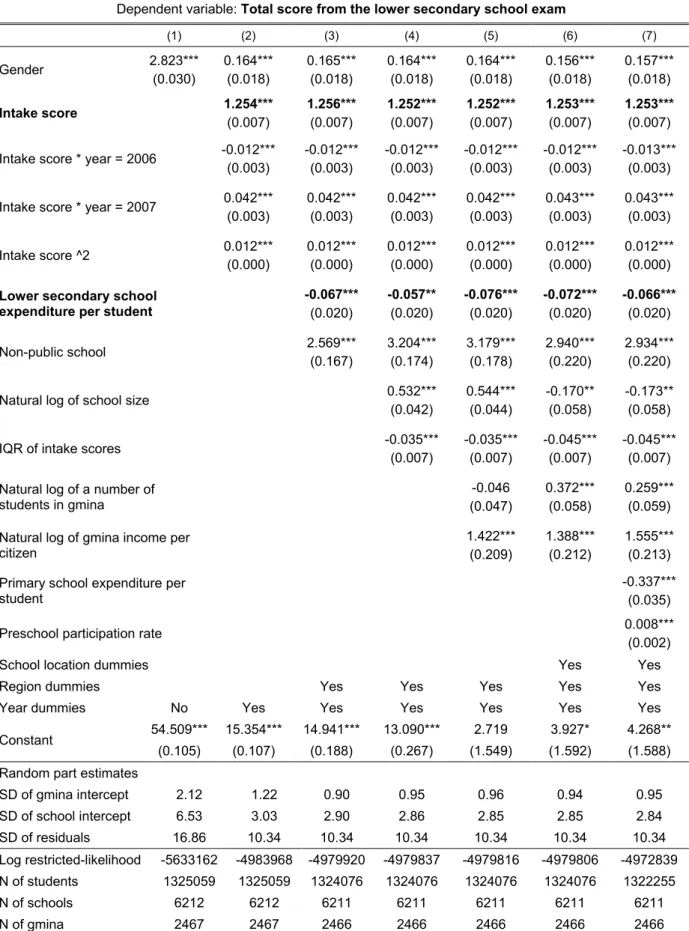
We focus now on gmina expenditure on lower secondary schools and value-added model. As was already said, the value-added model incorporates intake scores and could be used to estimate impact of any factor of interest on achievement growth, not the level. To see the difference consider column (1) and (2) in the table 2 below. In the first column a simple model without intake scores, with few individual variables, and random effects for gmina and schools is presented13. Estimates for dyslectics or “science Olympics” winners were not presented, but they had expected signs. The second column contains estimates for a simple value-added model. The only difference is the inclusion of intake scores (with quadratic term and interacted with year dummies to limit the impact of year-to-year changes in score distribution). Note that unexplained variance is much lower in the second model at all levels: gmina, school and individual. Inclusion of intake scores visibly improves fit of the model. Compare now columns (3) – (7) were expenditure per student in lower secondary school were included with different additional controls in each column. Note, that estimate of the effect of expenditure is negative and almost of the same magnitude in all regressions. Thus, one can conclude that increasing school expenditures decrease teaching quality. However, from practical point of view this effect is simply negligible or non-distinguishable from zero. Estimate suggests that each additional 1000 PLN decreases student scores by around 0.07. Note that 1000 PLN (around 400 USD) is above ¼ of the country average spending per student. With a standard deviation of individual test scores around 18 and a standard deviation of gmina’s average test scores around 10, the effect of 0.07 points should be considered negligible in this case. In fact, it shows that differences in decentralized expenditures have no visible impact on teaching quality. The statistical significance of estimated coefficients comes from the huge number of observations in the dataset, but in this case should not be confounded with a policy significance of the effect.
Other variables were included as additional controls rather than factors which are expected to directly affect achievement growth. Note, however, that non-public schools show significantly higher quality despite the control for intake scores. This seems interesting and should be analyzed more carefully in future research. Is it the effect of additional private resources, different organization, or parental involvement? These are open questions for future studies.
Negative impact of interquartile range of intake scores was expected. It suggests that schools with high variation of student achievement have lower achievement growth. Intuitively, schools have probably lower effectiveness of teaching with groups which are very heterogeneous. School and gmina’s student population size were included to represent covariates correlated with the size of population. Thus, as was previously pointed out, they are not directly interpretable. Logarithm of gmina income serves again as a proxy for citizens’ wealth and other characteristics correlated with it (e.g. parental education or professions). Finally, primary school inputs and preschool participation were also included in the regression. While preschool participation effect was found to be positive as it was expected, the negative sign of primary school expenditure contradicts earlier findings. However, primary school expenditure is correlated with lower secondary school expenditure, intake scores, and other characteristics already included in the regression. Thus, its effect could be hard to estimate within this framework.
13 For brevity estimates for being dyslectic or winning the “science Olympics” were not presented. However,
Table 2. Value-added lower secondary school regression results.
Dependent variable: Total score from the lower secondary school exam
(1) (2) (3) (4) (5) (6) (7) Gender 2.823*** (0.030) 0.164*** (0.018) 0.165*** (0.018) 0.164*** (0.018) 0.164*** (0.018) 0.156*** (0.018) 0.157*** (0.018) Intake score 1.254*** (0.007) 1.256*** (0.007) 1.252*** (0.007) 1.252*** (0.007) 1.253*** (0.007) 1.253*** (0.007)
Intake score * year = 2006 -0.012***
(0.003) -0.012*** (0.003) -0.012*** (0.003) -0.012*** (0.003) -0.012*** (0.003) -0.013*** (0.003)
Intake score * year = 2007 0.042***
(0.003) 0.042*** (0.003) 0.042*** (0.003) 0.042*** (0.003) 0.043*** (0.003) 0.043*** (0.003) Intake score ^2 0.012*** (0.000) 0.012*** (0.000) 0.012*** (0.000) 0.012*** (0.000) 0.012*** (0.000) 0.012*** (0.000) Lower secondary school
expenditure per student
-0.067*** (0.020) -0.057** (0.020) -0.076*** (0.020) -0.072*** (0.020) -0.066*** (0.020) Non-public school 2.569*** (0.167) 3.204*** (0.174) 3.179*** (0.178) 2.940*** (0.220) 2.934*** (0.220)
Natural log of school size 0.532***
(0.042) 0.544*** (0.044) -0.170** (0.058) -0.173** (0.058)
IQR of intake scores -0.035***
(0.007) -0.035*** (0.007) -0.045*** (0.007) -0.045*** (0.007) Natural log of a number of
students in gmina -0.046 (0.047) 0.372*** (0.058) 0.259*** (0.059) Natural log of gmina income per
citizen 1.422*** (0.209) 1.388*** (0.212) 1.555*** (0.213) Primary school expenditure per
student
-0.337*** (0.035)
Preschool participation rate 0.008***
(0.002)
School location dummies Yes Yes
Region dummies Yes Yes Yes Yes Yes
Year dummies No Yes Yes Yes Yes Yes Yes
Constant 54.509*** 15.354*** 14.941*** 13.090*** 2.719 3.927* 4.268**
(0.105) (0.107) (0.188) (0.267) (1.549) (1.592) (1.588)
Random part estimates
SD of gmina intercept 2.12 1.22 0.90 0.95 0.96 0.94 0.95 SD of school intercept 6.53 3.03 2.90 2.86 2.85 2.85 2.84 SD of residuals 16.86 10.34 10.34 10.34 10.34 10.34 10.34 Log restricted-likelihood -5633162 -4983968 -4979920 -4979837 -4979816 -4979806 -4972839 N of students 1325059 1325059 1324076 1324076 1324076 1324076 1322255 N of schools 6212 6212 6211 6211 6211 6211 6211 N of gmina 2467 2467 2466 2466 2466 2466 2466
Note: Some regressors were omitted from the table. *, **, *** indicate significant coefficients at the 0.1, 0.05, and 0.01 level, respectively.
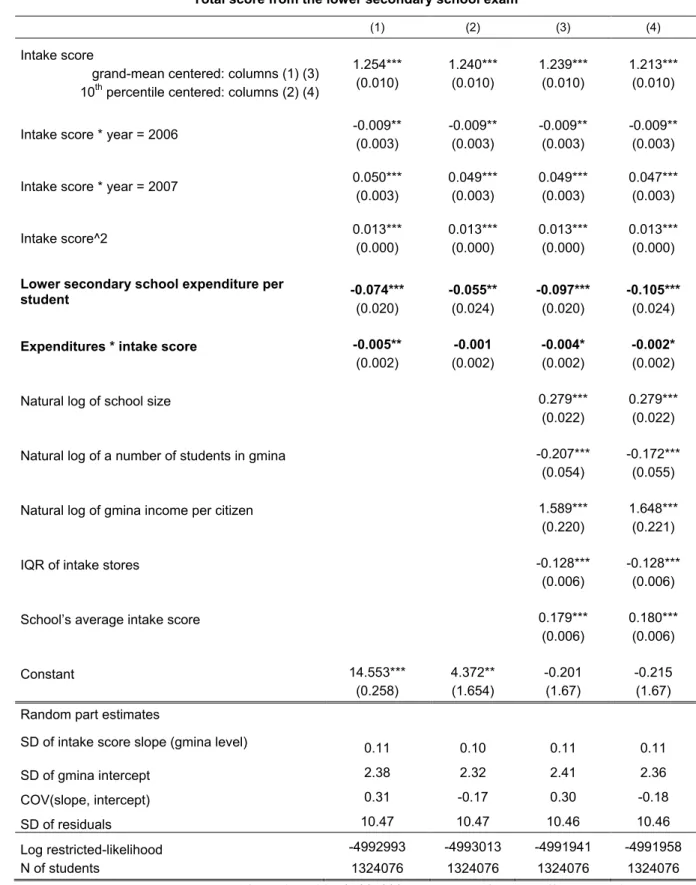
Finally, we estimated several random slope multilevel regressions where impact of chosen factors on the intake score slope was of main interest. Note, that in this case intake scores were centered to obtain meaningful results. Centering on the “grand-mean” (population mean) produces the same model but with estimates directly interpretable as effects for the average student. However, centering on some other location gives different model (de Leeuw, 2005). In our case we centered intake scores around grand-mean but also on the 10th percentile of intake scores calculated separately for each gmina. Thus, in the latter case we estimated the impact of expenditure on low achieving students defined relatively to the population of students in each gmina. Additionally, we added interaction term between expenditure and intake score explaining random variation of intake score slopes at the gmina level.
The results are presented in the table 3 below. Columns (1) and (3) contain two models with intake scores centered on grand-mean. Columns (2) and (4) contain similar models but with intake scores centered on the 10th percentile. For brevity, we omitted from the table several control variables used in estimation, namely, all individual characteristics present in earlier value-added models except intake scores, dummy for non-public schools, and indicators for regions. In addition to earlier models we added school’s average intake score to regressors to better fit the nonlinear relation between intake and lower secondary score and to take into account so called compositional effects (Goldstein et al., 2000). The coefficients for not presented variables were qualitatively the same as in the previous regressions.
First, note that estimated impact of expenditures on random school intercepts is negative despite the way intake scores were centered. This means that expenditures similarly affect average students and low-achievers. As we discussed already, these effects are non-distinguishable from zero from the practical point of view. Additionally, we were also interested in the estimate of the interaction term between expenditure and centered intake score. Our estimates of this interaction term were consistently negative which means that increasing expenditure lowers intake score slope. This can be interpreted as equalizational effect of expenditure, namely, that in lower secondary schools on which local governments spend more low achievers have higher progress. However, these effects are very weak and from the practical point of view are negligible. Thus, the findings could be summarized as showing no effect of gmina expenditure on the teaching quality. This seems to be true despite the level of students. Huge sample and proper statistical models produced very accurate estimates which makes these findings precise and robust.
Table 3. Value-added random slope lower secondary school regression results.
Dependent variable:
Total score from the lower secondary school exam
(1) (2) (3) (4)
Intake score
grand-mean centered: columns (1) (3) 10th percentile centered: columns (2) (4)
1.254*** (0.010) 1.240*** (0.010) 1.239*** (0.010) 1.213*** (0.010)
Intake score * year = 2006 -0.009**
(0.003) -0.009** (0.003) -0.009** (0.003) -0.009** (0.003)
Intake score * year = 2007 0.050***
(0.003) 0.049*** (0.003) 0.049*** (0.003) 0.047*** (0.003) Intake score^2 0.013*** (0.000) 0.013*** (0.000) 0.013*** (0.000) 0.013*** (0.000) Lower secondary school expenditure per
student -0.074*** (0.020) -0.055** (0.024) -0.097*** (0.020) -0.105*** (0.024)
Expenditures * intake score -0.005**
(0.002) -0.001 (0.002) -0.004* (0.002) -0.002* (0.002)
Natural log of school size 0.279***
(0.022)
0.279*** (0.022)
Natural log of a number of students in gmina -0.207***
(0.054)
-0.172*** (0.055)
Natural log of gmina income per citizen 1.589***
(0.220)
1.648*** (0.221)
IQR of intake stores -0.128***
(0.006)
-0.128*** (0.006)
School’s average intake score 0.179***
(0.006) 0.180*** (0.006) Constant 14.553*** (0.258) 4.372** (1.654) -0.201 (1.67) -0.215 (1.67) Random part estimates
SD of intake score slope (gmina level) 0.11 0.10 0.11 0.11
SD of gmina intercept 2.38 2.32 2.41 2.36
COV(slope, intercept) 0.31 -0.17 0.30 -0.18
SD of residuals 10.47 10.47 10.46 10.46
Log restricted-likelihood -4992993 -4993013 -4991941 -4991958
N of students 1324076 1324076 1324076 1324076
Note: Some regressors were omitted from the table. *, **, *** indicate significant coefficients at the 0.1, 0.05, and 0.01 level, respectively.
VII.
Conclusions
This paper has two parts. In the first part the process of decentralization in Poland was described. A special emphasis was given to the preschool, primary and lower secondary education, for which the lowest level of local government in Poland, called gmina, is responsible. Own calculations based on the fiscal and school system data were presented. It was shown how financing, ownership, expenditure and accessibility changed during the transition period. In the case of preschool education, where local governments are almost solely responsible for service provision, we observed increasing gap in service accessibility between rural and urban areas. Many rural local governments were not able to increase or even sustain preschool participation rates, despite the population decline and importance of preschool education for disadvantaged students. Only richer urban gmina managed to increase shares of children in kindergartens. That could have a direct impact on educational inequalities in the nearest future. Analysis of student test scores in primary schools suggests that preschool participation is positively related to student achievement.
In case of primary and lower secondary education we observed huge variation in educational expenditure despite strong central government financial support through the per pupil funding formula. The second part of the paper addresses the question whether this variation affects distribution of teaching quality in lower secondary schools. We explored datasets with national examination scores for whole student population and three cohorts to answer this question. Controlling for intake scores in the value-added random effects model it was found that expenditure have no impact on student achievement growth in lower secondary schools. Obtained estimates were very precise showing that per capita spending on schools did not affect teaching quality in an important way. Using random slope models it was found that this is equally true for average performers as well as for low-achievers. Thus, variation in gmina expenditure cannot be related to student progress despite their achievement level.
The paper provides new evidence on the impact of decentralization on teaching quality in Poland. The value-added model proposed for lower secondary schools provides the opportunity to assess decentralization not from the fiscal perspective, but from the quality side. Findings are quite pessimistic. It is clear that local governments were not able to extend the coverage of preschool education. Not surprisingly, the poorest communities have the biggest gaps in this regard. Having in mind that supporting preschool education is more important for future achievement of the poor than of the rich, it is quite clear that decentralization didn’t help in this case. The finding that expenditures are not affecting student progress has less obvious interpretation. It is clear that local governments are not able to increase teaching quality by spending more money. However, it could be that some local governments were able to lower school costs while sustaining teaching quality. Our results are in line with such interpretation. Nevertheless, it is not clear whether overall efficiency of the system is high. It could be argued that centralized financing system could be even more effective, forcing schools to keep low costs while supervising teaching quality. Whether such system is possible in practice and could work better than the decentralized one is another issue. However, it seems that the current decentralized system is far from being efficient and some room for improvement clearly exists.
References
Ahmad E., Brosio G. (eds.), (2006). “Handbook of Fiscal Federalism”. Edward Elgar Publishing
Goldstein H., (1999). „Multilevel Statistical Models”, second edition available at www.ats.ucla.edu/stat/examples/msm_goldstein/goldstein.pdf
Goldstein H., Huiqi P., Rath T., Hill N., (2000). “The use of value added information in judging school performance”, Perspectives on Education Policy. London, Institute of Education.
Golinowska, S., Boni M. (2006). “Nowe dylematy polityki społecznej”, CASE – Center for Social and Economic Research, CASE Report 65/2006.
GUS, (2006), „Oświata i wychowanie w roku szkolnym 2005/2006”. Warsaw, Central Statistical Office.
Hanushek E., (2003), “The Failure of Input-based Schooling Policies,” Economic Journal, vol. 113(485), pp. F64-F98
Jakubowski M., (2008), „ “Implementing value-added models of school assessment”, European University Institute RSCAS 2008/06 working paper
Jakubowski M., Kozińska-Bałdyga A., (2005), „Małe szkoły - polska odpowiedź na wybrane problemy wiejskiej oświaty”. Wieś i Rolnictwo 3/2005, Instytut Rozwoju Wsi i Rolnictwa PAN
Jakubowski M., Sakowski P., (2006), „Quasi-experimental estimates of class size effect in primary schools in Poland”, International Journal of Educational Research, Vol. 45, Issue 3, pp. 202-215.
Jakubowski M., Topińska I., (2007), “Impact of Decentralization on Public Service Delivery and Equity. Education and Health Sectors in Poland 1998 – 2003”. UNDP report, CASE – Center for Social and Economic Research
Krueger A., (2003), “Economic Considerations and Class Size”, Economic Journal, vol. 113(485), pp. F34-F63 de Leeuw J., (2005), “Centering in Multilevel Models”. In: Brian Everitt, David Howell (eds.), “Encyclo