Concordia University - Portland Concordia University - Portland
CU Commons
CU Commons
Ed.D. Dissertations Graduate Theses & Dissertations
Spring 3-30-2019
Student Connectedness and Academic Achievement: A
Student Connectedness and Academic Achievement: A
Quantitative Study of Career and Technical Education Students
Quantitative Study of Career and Technical Education Students
Kern McGinleyConcordia University - Portland
Follow this and additional works at: https://commons.cu-portland.edu/edudissertations
Part of the Educational Administration and Supervision Commons, Educational Assessment, Evaluation, and Research Commons, Educational Leadership Commons, Educational Psychology Commons, Secondary Education Commons, Secondary Education and Teaching Commons, and the Vocational Education Commons
CU Commons Citation CU Commons Citation
McGinley, Kern, "Student Connectedness and Academic Achievement: A Quantitative Study of Career and Technical Education Students" (2019). Ed.D. Dissertations. 392.
https://commons.cu-portland.edu/edudissertations/392
Concordia University–Portland College of Education Doctorate of Education Program
WE, THE UNDERSIGNED MEMBERS OF THE DISSERTATION COMMITTEE CERTIFY THAT WE HAVE READ AND APPROVE THE DISSERTATION OF
Kern Patrick McGinley
CANDIDATE FOR THE DEGREE OF DOCTOR OF EDUCATION
James A. Therrell, Ph.D., Faculty Chair Dissertation Committee Greg Aldred, Ed.D., Content Specialist
Student Connectedness and Academic Achievement: A Quantitative Study of Career and Technical Education Students
Kern Patrick McGinley Concordia University–Portland
College of Education
Dissertation submitted to the Faculty of the College of Education in partial fulfillment of the requirements for the degree of
Doctor of Education in Educational Administration
James Therrell, Ph.D., Faculty Chair Dissertation Committee Greg Aldred, Ed.D., Content Specialist
Sisay Teketele, D.M., Content Reader
Concordia University–Portland
Abstract
The focus of this correlational study in an Alaskan career and technical (CTE) school
environment was to explore the research question that guided this study: In a large urban school district of Alaska, with a diverse student population, what is the relationship between level of CTE student connectedness and level of academic achievement? Participants included 132 high school students, Grades 10 through 12. Additional research questions were developed to examine the strength of the relationship between student connectedness and academic achievement by gender and ethnicity. Data were collected using an online survey with a combination of demographic questions and Goodenow’s (1993b) Psychological Sense of School Membership Scale (PSSM). Students self-reported their GPA. The findings of the Pearson correlations indicated a significant linear correlation between student connectedness and GPA for the overall sample, for males, and for females. The findings of the Pearson correlation between student connectedness and GPA were statistically significant for the Caucasian, African American, and multiracial samples. The findings of the Pearson correlation were not statistically significant for the Mexican/Hispanic, Asian, Pacific Islander, and Native Alaskan samples, suggesting that a correlation did not exist between student connectedness and GPA among these ethnicities. Implications for practice include increasing students’ opportunities to actively engage in setting goals, making decisions, and participating in the governance of the school’s disciplinary
structure. Implications for policy include developing policies for connecting disconnected students to school by facilitating professional development and better access to CTE schools and programs.
Keywords: student connectedness, academic achievement, career and technical education (CTE), gender, race, ethnicity.
Dedication
This dissertation is dedicated to the following connectedness agents who inspired me to reach my potential:
My wife Anne. Your love of learning allowed for me to embark on this wonderful educational journey and your support helped me through the challenges this process presented. You are an amazing wife and mother, I can’t imagine spending my life with anyone else. My two sons, Drake and Cade, you are my superstars. You were patient with me when I needed time and space to conduct research and spend weekends writing. I know it was challenging for you to process my commitment to this project. And, now here we are on the other side with the mission complete. You are proud of me and I am honored to be your father. Fun times ahead boys!
My parents, Bill and Diane. You instilled in me the will to moved forward, the courage to face difficult challenges, the values, ethics, and morality that have shaped me into the family man and leader that I am. Thank you for the many sacrifices that you made. You are wonderful parents and grandparents. I am fortunate to have you in my life to celebrate your dream of me earning a doctorate. My brothers Ryan and Kyle and sister Jaime. You made growing up together fun and you continue to amaze me with your families and talents. My grandparents. How fortunate I was to have you in my life as a child and into adulthood. You made growing up fun and memorable. The lessons learned from you are not found in books.
My in-laws, Gary, Mary Alice, and Liz for all the support and encouragement you provided to our family. We are blessed to have you in our lives.
My friends, teachers, mentors, coaches, and colleagues. Your spirit reached me in ways that made a difference in my life; thank you for seeing me through and taking part in my
Acknowledgements
Dr. James Therrell, thank you for your guidance and support. Your experience and expertise gave me the direction, ambition, and courage to pull through and complete the dissertation process.
Dr. Greg Aldred, thank you for making quantitative research accessible and easier to understand. I am glad you moved me out of my comfort zone and into the statistical universe.
Dr. Sisay Teketele, thank you for your detailed analysis and your willingness to push me to get the best out of my study.
To my colleagues, thank you for your collaborative spirit and the excitement you had for me throughout the duration of this project. You helped me believe in the value of my research and the benefits it will provide to educational leaders, teachers, and students.
Table of Contents Abstract………ii Dedication………...iii Acknowledgements……….iv List of Tables………..ix List of Figures……….xi Chapter 1: Introduction………1
Introduction to the Problem……….1
Background: Researcher as Instrument………...4
Context of the Study………5
Historical Perspective………..9
Conceptual Framework for the Problem………11
Statement of the Problem………...12
Purpose of the Study………..14
Research Questions………15
Rationale, Relevance, and Significance of Study………..19
Definition of Terms………21
Assumptions………...22
Limitations……….22
Delimitations………..23
Summary………23
Chapter 2: Literature Review……….25
Conceptual Framework………..28
Review of Research Literature and Methodological Literature……….33
Historical Perspective………33
Multiple Definitions of Connectedness……….38
Problems with Survey Instruments………40
Domains of Connectedness………44
Family Impact………49
Interventions………..53
Race, Ethnic Identity, Gender, and the Impact of Discrimination………56
Health Benefits and Interventions……….58
Positive Psychology and Connectivity………...62
Review of Methodological Literature………66
Examining Student Connectedness………67
The Choice of Methods for Studying Connectedness………71
Limitations of the Studies………..72
Synthesis of Research Findings……….73
Critique of Previous Research………...78
Student Connectedness Survey Instrument Development……….78
The Multidimensional Domains of the Connectedness Concept………...79
Student Connectedness and Family Influences………..80
Student Connectedness Interventions………81
Student Connectedness Health Benefits………81
Summary………83
Chapter 3: Methodology………85
Introduction………85
Purpose of the Study………..86
Design of the Study………86
Research Questions and Hypotheses……….88
Setting………93
Target Population, Sampling Method and Power Analysis, and Related Procedures.…..95
Instrumentation………..96
Data Collection and Procedures……….98
Operationalization of Variables………...101
Data Analysis Procedures………101
Limitations and Delimitations of the Research Design………...102
Internal and External Validity………..104
Expected Findings………106
Ethical Issues………...106
Summary………..108
Chapter 4: Results and Analysis………..110
Introduction………..110
Description of the Sample………111
Detailed Analysis……….115
Summary………..135
Introduction………..137
Summary of Results……….138
Discussion of Results………...139
Discussion of the Results in Relation to the Literature………141
Limitations………...147
Implications of the results for Practice, Policy, and Theory………148
Recommendations for Further Research………..159
Conclusion………...162
References………164
Appendix A: Demographic Questionnaire………...184
Appendix B: Survey Instrument………..189
Appendix C: Data Collection………...201
Appendix D: Letter of Assent………..205
Appendix E: IRB Approval Letter………...206
Appendix F: Web Page Announcement Informing Parents……….207
List of Tables
Table 1. Demographic Breakdown of CTHS………...………...………..94
Table 2. Frequency Table for Demographic Variables...………...111
Table 3. Frequency Table for Nominal Level Variables ………...………...…………112
Table 4. Summary Statistics Table for Interval and Ratio Variables……...…….……….115
Table 5. Cronbach’s Alpha Reliability Statistics for School Connectedness……...…………..115
Table 6. Pearson Product Moment Correlation Analysis for Student Connectedness and Academic Achievement (Overall Sample)………....117
Table 7. Pearson Product Moment Correlation Analysis for Student Connectedness and Academic Achievement (Male Sample)………..……..118
Table 8. Pearson Product Moment Correlation Analysis for Student Connectedness and Academic Achievement (Female Sample)………...……….120
Table 9. Pearson Product Moment Correlation Analysis for Student Connectedness and Academic Achievement (White Sample)………...………122
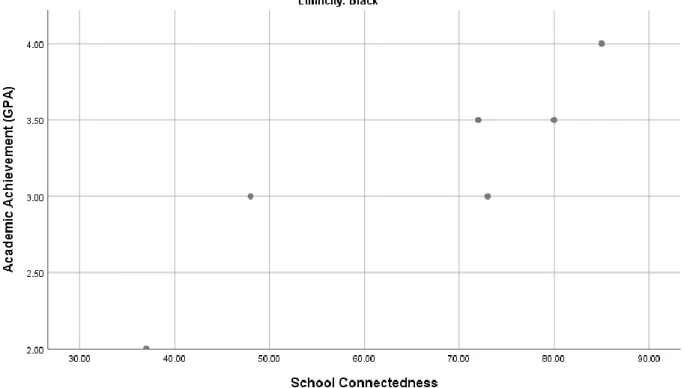
Table 10. Pearson Product Moment Correlation Analysis for Student Connectedness and Academic Achievement (Black/African American Sample)……….124
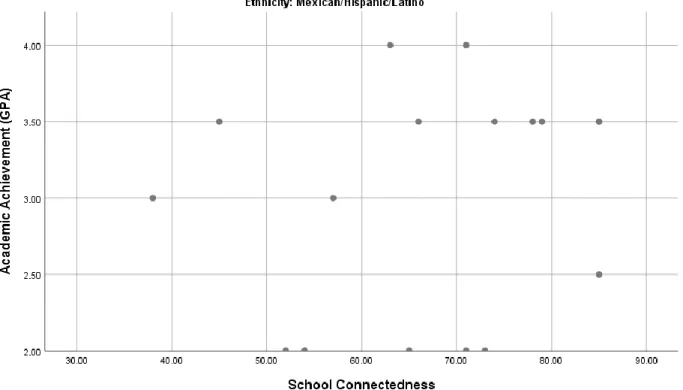
Table 11. Pearson Product Moment Correlation Analysis for Student Connectedness and Academic Achievement (Mexican/Hispanic/Latino Sample)………..………….126
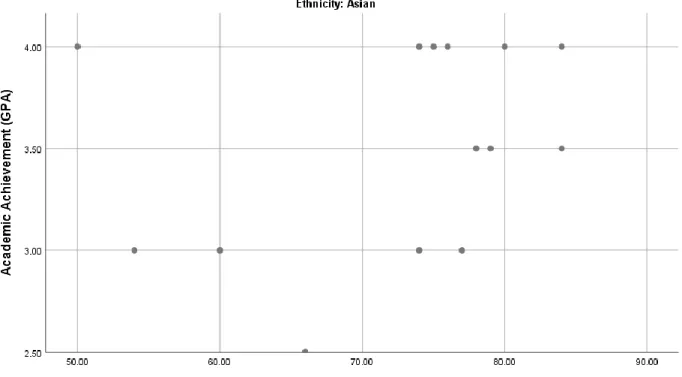
Table 12. Pearson Product Moment Correlation Analysis for Student Connectedness and Academic Achievement (Asian Sample)………..128
Table 13. Pearson Product Moment Correlation Analysis for Student Connectedness and Academic Achievement (Pacific Islander Sample)………..………130 Table 14. Pearson Product Moment Correlation Analysis for Student Connectedness and
Academic Achievement (Multiracial Sample)……….132 Table 15. Pearson Product Moment Correlation Analysis for Student Connectedness and
Academic Achievement (Alaskan Native/American Indian Sample)………….………..134
List of Figures
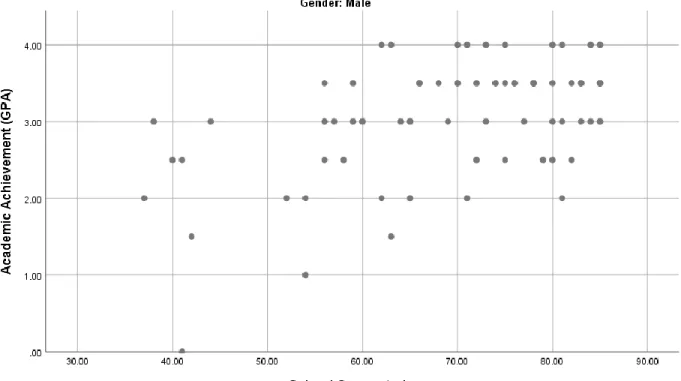
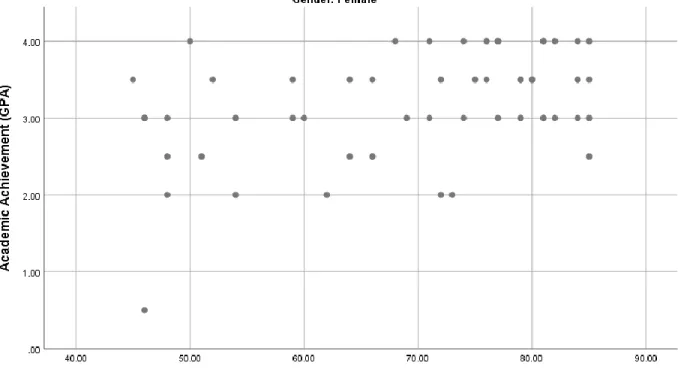
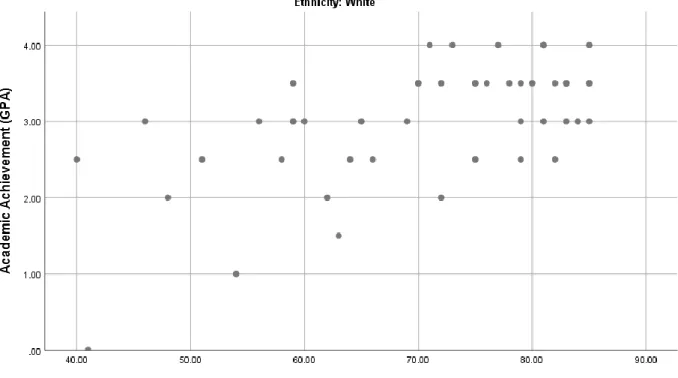
Figure 1. Conceptual framework Finn’s (1989) participation-identification model………32 Figure 2. Conceptual framework Finn’s (1989) withdraw cycle………..32 Figure 3. Scatterplot between level of student connectedness and level of academic achievement (overall sample)………...………117 Figure 4. Scatterplot between level of student connectedness and level of academic achievement
(males)………..…………119 Figure 5. Scatterplot between level of student connectedness and level of academic achievement (females)……….……….121 Figure 6. Scatterplot between level of student connectedness and level of academic achievement
(White)……….………123 Figure 7. Scatterplot between level of student connectedness and level of academic achievement (Black)………...………...125 Figure 8. Scatterplot between level of student connectedness and level of academic achievement (Mexican/Hispanic/Latino sample)………..……127 Figure 9. Scatterplot between level of student connectedness and level of academic achievement (Asian sample)………..……...129 Figure 10. Scatterplot between level of student connectedness and level of academic
achievement (Pacific Islander sample)………131 Figure 11. Scatterplot between level of student connectedness and level of academic
achievement (multiracial sample)………133 Figure 12. Scatterplot between level of student connectedness and level of academic
Figure 13. Finn’s participation-identification model: race and ethnicity implications…...…..152 Figure 14. Comprehensive intervention strategies ………...…….155
Chapter 1: Introduction Introduction to the Problem
Because schools are the nexus of adolescent development and healthy futures, it is vital that students are connected to this nexus. According to the Desilver (2014), middle school students spend 943 hours in the classroom a year or approximately 10,000 hours in school by the time an adolescent enters the ninth grade. However, every 26 seconds a student disconnects and drops out of school (DoSomething.org). This is an alarming rate of disconnect, which translates into a future of significant problems for the individual and society. The data shows that a
dropout will earn significantly less over a lifetime than a person with a high school diploma. The American Psychological Association (2012) posits a student’s dropout rate is associated with poor health. In the last decade, almost 80% of the U.S. prison population was comprised of high school dropouts (Stark & Noel, 2015). When students experience feelings of student
connectedness, they are more likely to experience positive academic outcomes, a sense of wellbeing, and a hope for a successful future with a diploma in hand (Lewis, Huebner, Malone, & Valois, 2011). Student connectedness refers to students’ feeling they are cared about and supported in educational environments (Chung-Do, Goebert, Chang, & Hamagani, 2015; Pate, Maras, Whitney, & Bradshaw, 2017; Wallace, Ye, & Chhuon, 2012).
One of the most important outcomes for students is academic achievement. A commonly held definition of a successful student is based on an above average grade point average (3.0 or better), a plan to graduate from high school, and a goal to pursue post-secondary education (Tekin, 2014). An important indicator of strong self-concept that carries over into the future as a student ages are consistency and increases in academic achievement (Angus & Hughes, 2017). Likewise, poor academic performance decreases self-concept and has been linked to dropping
out of school (Loera, Nakamoto, Oh, & Rueda, 2013). In addition, students that have their basic needs met, parental encouragement, safe surroundings, and who prioritize learning have higher academic success rates than peers who survive in an environment of scarce resources (Angus & Hughes, 2017). Thus, the student who must focus on immediate needs is at a greater risk of not being adequately prepared for the demands of the 21st-century labor market.
Adolescence is characterized by significant psychosocial (psychological and social) developmental changes, contextual transitions, and the emergence of a self-concept (Pate et al., 2017). These factors challenge and compete with a student’s sense of connectedness. School-centric psychosocial variables, such as student connectedness, act as risk, protective, and
promotional factors for high school students (Centers for Disease Control and Prevention, 2009; Pate et al., 2017). A supple sense of connectedness develops during late adolescence. Social acceptance, emotional wellness, and student connectedness are all psychosocial variables predictive of academic achievement. Adolescent students’ that felt connected to their schools earned higher grades and completed more years of school then their less connected peers (Pate et al., 2017; Resnick et al., 1997).
One population particularly at-risk for poor academic achievement are career technical education (CTE) students (Jacob, 2017). Participation in CTE is not particularly associated with educational accomplishment and this common perception has cultivated a negative CTE image problem. Students typically self-select into CTE programs with an idea that is often based on actual or perceived choices regarding future educational attainment and career aspirations. Parents and counselors often encourage students to select a CTE program as a “last ditch” effort to help a noncademic student find a career pathway. Students participating in CTE are different in many ways than other youth who do not participate in CTE, in terms of personal abilities and
interests, family background, etc. and CTE is often describe by some as a “dumping ground” for lower-achieving or unmotivated students (Jacob, 2017).
Connectedness is a phenomenon that extends into the fields of psychology, sociology, criminology, healthcare, business, and education. Student connectedness provides protections against unhealthy and risky behavior, and promotes academic achievement for non-CTE students (Angus & Hughes, 2017; Pate et al., 2017). The term connectedness is used to describe the way in which we link to and experience a network. Connectedness is universally accepted across these fields as a phenomenon that provides a developmental experience rooted in our
relationships with others and to things, we deem important.
Student connectedness refers to students’ beliefs that they are cared about and supported in educational environments (Pate et al., 2017; Wallace et al., 2012). Student connectedness is a multidimensional construct and involves three components: social relationships, relationship with the school, and attitudes toward the importance of school (Chung-Do et al., 2015; Pate et al., 2017). Socially, student connectedness involves positive relationships at school, including interaction and support from teachers, administration, and staff. Relationship with the school involves a sense of belonging or being part of the school community, including feeling safe and happy at school. Student connectedness also involves students holding positive attitudes toward the importance school, including students caring about school and wanting to do their best (Chung-Do et al., 2015; Pate et al., 2017). Students who struggle to form social connections are more prone to physical and psychological health issues (Seppala, 2012; Wallace et al., 2012).
The purpose of this quantitative correlational study was to explore the relationship
between level of CTE student connectedness and degree of academic achievement in high school students in Alaska. Student connectedness and academic achievement is of critical importance
for students, parents, and educators. Due to the number of factors that go into school success, increasing academic achievement is a perplexing challenge for educators. From preventing students from dropping out of school to increasing alternative program opportunities for struggling learners, school systems are determined to identify contextual elements, such as student connectedness, race, ethnicity and gender and the correlation these elements have on academic achievement. Thus, to give students who are unmotivated and academically disengaged a fighting chance to develop a positive relationship with school, learning, and increasing academic achievement, an educational context that integrates student connectedness intervention strategies strongly addresses underperformance issues (Angus & Hughes, 2017; Loera et al., 2013).
Background, Context, History, and Conceptual Framework for the Problem
Background: researcher as instrument. The background for this study is rooted in my heart and love of education. I spent my early years of elementary school struggling with health issues stemming from asthma, learning difficulties associated to health, and a difficulty fitting in with my peers. These experiences fostered a dislike for school that led to a sense of isolation and a loss of confidence. These feelings persisted and intensified through junior high. My self-confidence found growth in high school with participation on a rowing team. The discipline, rigor, commitment, and comradery that goes along with this sport restored my self-concept, improved my health, and strengthened my belief in school as a place where dreams are made. Connecting to high school was critical to my success in college and my belief in the
transformative power of education.
I was most connected to school when teachers expressed empathy, the content was
The times I felt most disconnected was associated with peer bullying, teacher apathy, personal skillset challenges, and the feeling of alienation when participating in sports or group activities due to lack of support from peers and coaches. The feeling of disconnectedness was painful; however, parents, teachers, and coaches invested in my learning helped me transcend the difficult times.
As an educational leader, my experience of educational alienation and disconnectedness informs the way I forge my relationships with students and teachers. I want students to thrive because an educational environment with a positive atmosphere more easily affords for student connectedness and the benefits that go along with it translates into academic achievement and health. All students deserve an educational setting where the forces of alienation are controlled giving all students the space to learn without the negative forces that have a propensity of creating an educational disconnect. Therefore, having the ability to measure the educational atmosphere for connectedness in the same way a meteorologist predicts weather patterns is important for the welfare of all students. An educational leader with student connectedness concerns will explore disconnection issues like a NASA engineer explores dimensions of the universe, by deploying survey instruments (satellite) with a specific purpose (data collection) and mission (exploring possibilities). The data collected is used to understand the nature of the elements and forces at work within a particular domain.
Contextof the Study. The context is unique because it represents a full demographic spectrum of economics, races, and ethnic cultures. School district administrators’ struggle to understand student connectedness in relation to academic achievement in CTE schools. The current body of research available on student connectedness and the impact on academic achievement does not adequately address CTE school cultures comprised of students who
equally represent the following seven demographic categories recognized by the government: Alaska Native/American Indian, Native Hawaiian/Pacific Islander, Hispanic/Latino, White, Black, mixed race, Asian (Tunseth, 2015).
Demographic Data. In an Urbanized area of Alaska, the most recent data collected in the 2014–2015 school year indicated that this Alaskan student population was 48,154, with a 10-year shift in ethnic membership of Caucasian going from 54.9% to 43.4%, and an increase in
membership reported by students identifying as two or more races from 6.7% to 14.7%
(Anonymous, 2016). The ethnic group with the greatest ten-year decline in membership was the Alaska Native and American Indian population that went from 13.2% to 8.8% (Tunseth, 2015).
The Alaskan District’s English Language Learner (ELL) program serves approximately 6,000 students, with as of 2015, 4,000 that no longer qualify for services, which combined is over 20% of the District’s student population that comes from a household where English is not a primary language (Tunseth, 2015). The District reported that students speak 99 different
languages. Spanish is the most popular first language with 23% reporting, followed by Hmong at 18%, Samoan at 17%, Filipino at 13%, and Yup’ik at 5%. The groups that represent 4% or less are Lao, Inupiaq, Nuer, Korean, and Russian. The typical English skills growth rate of a “newcomer” is two-years with a minimum of five years for a basic “academic understanding” proficiency (Tunseth, 2015).
Achievement Gap. As of 2018, Alaska does not have reliable assessment data in schools for academic achievement. This is due in part to the failure of the state of Alaska’s
implementation of a statewide assessment. In 2012, the state of Alaska removed the Student Based Assessment when the Graduation Qualifying Exam was deemed impractical. In 2013, the state of Alaska adopted and implemented the Alaska Measures of Progress (AMP) assessment.
In 2014, the AMP assessment failed when a fiber optic cable was cut at the test administration center at the University of Oklahoma. Despite the lack of reliable assessment data, the urbanized area in Alaska’s 2016 data on academic achievement identified the largest achievement gap in math is between Native Hawaiian/other Pacific Islanders and Caucasian students at 32.5%; and in English language arts the gap was 40.2% between Native Hawaiian/Other Pacific Islanders. Another significant gap in the English language arts was with the Limited English Proficient (LEP) population that scored a level 1 (lowest achievement) at 64.9% compared to the district average of 24%. The smallest achievement gap in English language arts (22.4%) and Math (12.5%) is between Asian and Caucasian students (Anonymous, 2018).
Graduation. The 4-year District’s (Anonymous, 2016) graduation rate trend was the highest in five years at 80.2%. The greatest gains were reported for the Native Hawaiian/Other Pacific Islanders, Students with Disabilities, and Limited English Proficient. For the 2016–2017 school year, the dropout rate reflected the improvement in the graduation rate with the lowest in a five-year trend, reported at 3.1. The Economically Disadvantaged Students, Students with Disabilities, and two or more races showed a decrease by an average of 1.0%. The African American, Hispanic and Migrant students showed increases of 0.4% and was considered a positive five-year trend because the increase was considered small. The dropout rate for Alaska Native/American Indian students showed a decrease; however, with the District reported a renewed focus on this population because they are 2.6 times more likely to drop out than non-Alaska Native/American Indian students.
Attendance. The District’s 2016 report showed a 4-year data trend across the district with a student attendance increase of 6.2%. Although there is an increase of students, there was a 1.9% decrease in attendance from 2013 to 2015. A district-wide decline in attendance was
experienced with grade 12 having the most significant decrease in attendance of 5.3%. It is interesting to note, that with the decline in 12th grade attendance the district reported a five-year increase in the student graduation rate of 80.2% (Anonymous, 2016).
Satisfaction. The District’s 2016 report showed that parents and students continue to believe in their schools by a large percent, with 88.0% of parents and 76.9% of students in Grades 3–4 and 73.0% of students in Grades 5–12 recommending their schools (Anonymous, 2016). The district reported that 71.7% of students and 86.1% of staff feel safe in their school environment. This Alaskan urban center is thriving in the area of racial and ethnic integration. The 2010 U.S. Census reported that a community within the city as the most diverse
neighborhood in the nation. The factors that make this Alaskan urban center’s diversity unique are large a military population and an immigrant population that is 11% of the total population. The U.S. Census data in 2010 places this urban center as fifth in the medium-sized city category. The U.S. Census Bureau report in 2010 revealed that 67% of the city is White, with the other 33% representing various races and ethnic groups (Tunseth, 2015).
The schools in this urban center are integrated with large numbers of Caucasian students mixed in without the common problems associated with racial barriers. Schools in the District have greater diversity and less segregation based on race than middle-high schools in the nation (Farrell, 2015). Although the schools are benefitting from integration, the economic trend is a different story. Farrell (2015) reported that the economic segregation trend continues to grow upward, while the ethnic segregation trend is declining. Thus, the District is a unique
environment for exploring the relationship between student connectedness and academic achievement in an ethnically diverse CTE school setting.
Historical Perspective. The CTE’s linage originates in 17th century Europe with a defined purpose to prepare lower class people for manual labor. The industrial revolution in the United States of America brought the same educational need to the American education system along with a vocational philosophy of education (ACTE, 2017). Jane Adams (1860–1935) advocated for an education that was focused on vocational experience as a way of linking school and work (Gutek, 2001). John Dewey (1859–1952) believed that academic study alone was inadequate for preparing youth for real-world experiences (Gordon, 2014).
The term “vocational” was first put into place with a 1917 law known as the Smith-Hughes Act. The Act offered federal support for an education that is a grade below college (Stern, 2010). The subpar educational language was removed in favor of “Career and Technical” in 2006 with the reauthorization of the federal Carl D. Perkins IV Act, which aims to advance the quality of CTE with the goal of boosting the U.S. Economy with a skilled labor force.
Despite the name change, a CTE secondary school image problem of a nonacademic education that leads to a low paying labor intensive job persists. Educational policy experts claim that for decades’ educators have pushed high school students into thinking that a college degree would produce high paying jobs and status, which has been reinforced by political elites (ACTE.org, 2017; Krupnick, 2017). To distance itself from this negative perception, CTE has moved away from hobby type classes and transformed into standalone 2- and 4-year secondary schools offering programs with certifications and a diploma that gives graduates access to21st century jobs in skilled-technical trades (Weingarten, 2015).
Career and Technical Education nationally serves 94% of all high students in one form or another through classes offered in comprehensive secondary schools to stand alone 2- and 4-year schools. According to the National Center for Educational Statistics (2009), data collected in
2008 showed that CTE was serving the Non-Hispanic White population at 63.4%, students with an IEP at 18.5%, and students Limited English proficient at 4.5%. The last 20 years has shown that CTE is primarily serving White male students, students who have disabilities, and students from smaller, lower income or rural schools, and students with lower academic achievement (ACTE, 2017). This data shows that females and minority students are not accessing CTE programs like their White male counterparts. This indicates that there might possibly be a CTE access and equity issue for female and minority students.
The CTE model when done correctly, engages in research and community relations with business partnerships, industry advisories, parental involvement, legislator engagement, high quality professional development and articulation agreements with colleges for dual credits (Fraze, personal communication, February 23, 2018). Thus, students who have the opportunity to engage in a free and appropriate education (FAPE) that provides a diploma and industry certification, the benefits are far greater than that which is offered in traditional high schools. For example, on a recent trip in May of 2017 to explore blue ribbon CTE schools in New
England and the Midwest, I asked a cosmetology student the following question: “Do you enjoy working as a hair stylist? Is this something you want to do for the rest of your life?” She replied:
I don’t know, when my father left my mother years ago, she often reminded me that there would be no money for college. She encouraged me to purse cosmetology because she knew I liked working on my friends’ hair and makeup. She planted the seed and told me that I could take these skills to any college campus and pay my way through college. This student has a career pathway that allows for her to pursue dreams while earning a living without the risk or duress of accumulating higher education debt.
On the visit to these schools, educational leaders all expressed the problem with the CTE stigma and how they are changing it. The leadership articulated a trend in which parents of students with advanced academic skills encourage them to learn a trade as a means to developing a deeper understanding and appreciation for fixing and repairing items we encounter daily. For example, diesel power technology, is a popular choice as a way to diversify a skill set for college admissions in an engineering program. Students can demonstrate they have a conceptual
understanding of diesel power technology and the hands-on shop experience that goes along with it, thus increasing the popularity and benefits of accessing career and technical education.
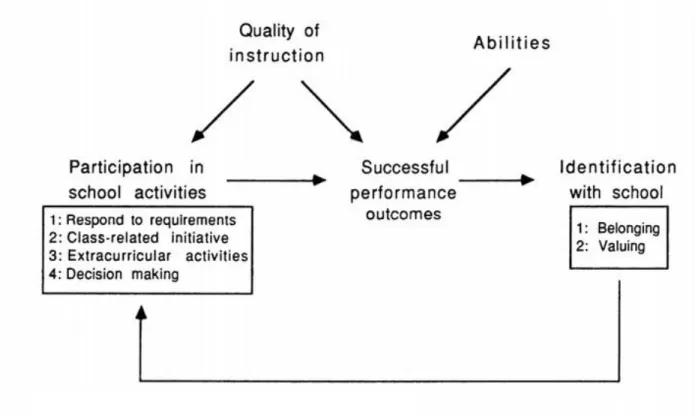
Conceptual framework for the problem. Finn’s (1989) participation-identification model of school engagement served as the conceptual framework for this study. The model was designed to understand students’ involvement in schooling through both emotional and
behavioral components leading to identification or connection with the school (Finn, 1989). Finn’s participation-identification model of school engagement has influenced student connectedness theories by emphasizing the importance of student engagement to school completion. This model includes four components: response to requirements, class-related initiatives, extracurricular activities, and decision making. Finn’s (1989)
participation-identification model holds that students who are involved in school by participating in classroom and extracurricular activities are more likely to develop a sense of school identification than those who do not. Increased identification can lead to enhanced academic outcomes. To fully conceptualize student connectedness in a CTE school, and because CTE courses are considered extracurricular, it was necessary to focus on relational and engagement factors of learning in Finn’s model associated with extracurricular activities.
Finn (1989) contends that classroom enthusiasm transforms interests into participation in subject-related activities, such as clubs, electives, and community events. Extracurricular refers to any activity that is not directly required to graduate from high school, such as involvement clubs, sports, and CTE courses. Therefore, Finn (1989) believed that struggling learners develop a sense of belonging because they can participate in something they enjoy doing and feel good about participating in that does not resemble a traditional academic classroom environment, like extracurricular participation in a CTE program or school. Thus, to fully conceptualize student connectedness in a CTE school, it was necessary to use a theory that is aligned with a relational and engagement model of learning associated with extracurricular activities (Finn, 1989; Griffin, 2002; Rumberger, 2004; Whiteside-Mansell, et al., 2015). The conceptual framework will be elaborated upon more fully in Chapter 2.
Statement of the Problem
Student academic performance has been a perennial problem in the United States. State assessment data collected from the last two years, in a large urban Alaskan school district, shows student learner groups accessing CTE programs are academically underperforming at a rate of 55% or greater below proficient among all groups in high school reading, writing, and math (Alaska Department of Education and Early Development, 2019). The state assessment data also shows that males and females are academically underperforming. The academic
underperformance levels across all groups rages from 73% to 53% below proficient, and similar for gender with 55% of females and 68% of males below proficient. As a result of academic underperformance, this population of learners is more likely to disconnect and dropout of school, and less likely than any other race/ethnicity to pursue postsecondary opportunities (Gottfried & Plasman, 2018; Plank, DeLuca, & Estacion, 2008). Prior researchers confirmed that
non-Caucasian students, including Native Alaskan, Black/African American, Hispanic/Latino, and Native Hawaiian/Pacific Islanders, and female students had higher attrition rates in CTE postsecondary fields of study than their male Caucasian peers (Hamilton, Malin, & Hackmann, 2015; Long, Conger, & Iatarola, 2012). This population of students may experience fewer advantages in life, including better health or access to healthcare, educational opportunities, employment status, and life satisfaction (Hyslop & Imperatore, 2013; Neild, Boccanfuso, & Byrnes, 2015; Tyler & Lofstrom, 2009).
Student connectedness has been shown to improve academic performance and encourage planning and preparation for career and post-secondary opportunities upon graduating high school (Hernandez-Gantes, Keighobadi, & Fletcher, 2018; Stone, 2017). However, the problem is that CTE research on gender, ethnicity, student connectedness, and academic achievement is noticeably absent (Rojewski & Xing, 2013). Gender and race/ethnicity characteristics are demographic factors that influence a students’ CTE course selection; it also impacts student perceptual awareness regarding connections with peers, teachers, and career pathway options (Rojewski & Xing, 2013). Therefore, it is important to study CTE students’ perceptions about their connectedness and the contribution that connectedness has on academic achievement. Without further research in this domain, underperforming diverse learners will continue to miss out on the benefits that come with obtaining a high school diploma, including higher income, post-secondary opportunities, and career advancement (Aliaga, Kotamraju, & Stone, 2014; McDermott, Donlan, & Zaff, 2019). Finally, no previous research could be found on the
Purpose of the Study
The purpose of this quantitative correlational study was to explore the relationship
between CTE students’ student connectedness (independent variable) and academic achievement (dependent variable), and whether gender and ethnicity affects that relationship. The study was conducted at the Career Tech High School (CTHS) with a sample of currently enrolled students in Grades 9 through 12. The students attending CTHS come from one of eight large
comprehensive high schools, representing a wide array of student diversity (Farrell, 2015). Large urban school districts face student connectedness challenges that impact academic
achievement in CTE schools with cultures comprised diverse student populations. Therefore, the purpose of the study explored the relationship between student connectedness and academic achievement, and whether race, ethnicity, and gender in CTE high schools in an Alaskan urban school district, impact that relationship.
Exploring student connectedness as it relates to academic achievement in the context of an ethnically diverse CTE school in Alaska is the purpose of this study. Due to the number of factors that go into school success, increasing academic achievement is a perplexing challenge for educators. From preventing students from dropping out of school to increasing alternative program opportunities for struggling learners, school systems are determined to identify
contextual elements that will increase academic achievement (Angus & Hughes, 2017; Loera et al., 2013). Survey tools that comprehensively analyze the factors that impact student
connectedness were explored and utilized for the purpose of exploring the relationship between connectedness, GPA, gender, and ethnicity.
Research Questions
The following question guided this study: In a large urban school district of Alaska, with a diverse student population, what is the relationship between level of CTE student
connectedness and level of academic achievement?
Research Question 1: Is there a relationship between level of student connectedness in an Alaskan CTE school environment as measured on the connectedness survey and level of academic achievement as measured by their GPA?
H01: There is no linear correlation between level of student connectedness in an Alaskan
CTE school environment as measured on the connectedness survey and level of academic achievement as measured by their GPA.
HA1: There is a linear correlation between level of student connectedness in an Alaskan
CTE school environment as measured on the connectedness survey and level of academic achievement as measured by their GPA.
Research Question 2: Among males, is there a relationship between level of student
connectedness in an Alaskan CTE school environment as measured on the connectedness survey and level of academic achievement as measured by their GPA?
H02: Among males, there is no linear correlation between level of student connectedness
in an Alaskan CTE school environment as measured on the connectedness survey and level of academic achievement as measured by their GPA.
HA2: Among males, there is a linear correlation between level of student connectedness
in an Alaskan CTE school environment as measured on the connectedness survey and level of academic achievement as measured by their GPA.
Research Question 3: Among females, is there a relationship between level of student
connectedness in an Alaskan CTE school environment as measured on the connectedness survey and level of academic achievement as measured by their GPA?
H03: Among females, there is no linear correlation between level of student
connectedness in an Alaskan CTE school environment as measured on the connectedness survey and level of academic achievement as measured by their GPA.
HA3: Among females, there is a linear correlation between level of student connectedness
in an Alaskan CTE school environment as measured on the connectedness survey and level of academic achievement as measured by their GPA.
Research Question 4: Among Caucasian students, is there a relationship between level of student connectedness in an Alaskan CTE school environment as measured on the connectedness survey and level of academic achievement as measured by their GPA?
H04: Among Caucasian students, there is no linear correlation between level of student
connectedness in an Alaskan CTE school environment as measured on the connectedness survey and level of academic achievement as measured by their GPA.
HA4: Among Caucasian students, there is a linear correlation between level of student
connectedness in an Alaskan CTE school environment as measured on the connectedness survey and level of academic achievement as measured by their GPA.
Research Question 5: Among Black/African American students, is there a relationship between level of student connectedness in an Alaskan CTE school environment as measured on the connectedness survey and level of academic achievement as measured by their GPA?
H05: Among Black/African American students, there is no linear correlation between
level of student connectedness in an Alaskan CTE school environment as measured on the connectedness survey and level of academic achievement as measured by their GPA. HA5: Among Black/African American students, there is a linear correlation between level
of student connectedness in an Alaskan CTE school environment as measured on the connectedness survey and level of academic achievement as measured by their GPA.
Research Question 6: Among Mexican/Hispanic/Latino students, is there a relationship between level of student connectedness in an Alaskan CTE school environment as measured on the connectedness survey and level of academic achievement as measured by their GPA?
H06: Among Mexican/Hispanic/Latino students, there is no linear correlation between
level of student connectedness in an Alaskan CTE school environment as measured on the connectedness survey and level of academic achievement as measured by their GPA. HA6: Among Mexican/Hispanic/Latino students, there is a linear correlation between
level of student connectedness in an Alaskan CTE school environment as measured on the connectedness survey and level of academic achievement as measured by their GPA.
Research Question 7: Among Asian students, is there a relationship between level of student connectedness in an Alaskan CTE school environment as measured on the connectedness survey and level of academic achievement as measured by their GPA?
H07: Among Asian students, there is no linear correlation between level of student
connectedness in an Alaskan CTE school environment as measured on the connectedness survey and level of academic achievement as measured by their GPA.
HA7: Among Asian students, there is a linear correlation between level of student
connectedness in an Alaskan CTE school environment as measured on the connectedness survey and level of academic achievement as measured by their GPA.
Research Question 8: Among Pacific Islander students, is there a relationship between level of student connectedness in an Alaskan CTE school environment as measured on the connectedness survey and level of academic achievement as measured by their GPA?
H08: Among Pacific Islander students, there is no linear correlation between level of
student connectedness in an Alaskan CTE school environment as measured on the connectedness survey and level of academic achievement as measured by their GPA. HA8: Among Pacific Islander students, there is a linear correlation between level of
student connectedness in an Alaskan CTE school environment as measured on the connectedness survey and level of academic achievement as measured by their GPA.
Research Question 9: Among Multiracial students, is there a relationship between level of student connectedness in an Alaskan CTE school environment as measured on the connectedness survey and level of academic achievement as measured by their GPA?
H09: Among Multiracial students, there is no linear correlation between level of student
connectedness in an Alaskan CTE school environment as measured on the connectedness survey and level of academic achievement as measured by their GPA.
HA9: Among Multiracial students, there is a linear correlation between level of student
connectedness in an Alaskan CTE school environment as measured on the connectedness survey and level of academic achievement as measured by their GPA.
Research Question 10: Among Alaska Native/American Indian students, is there a relationship between level of student connectedness in an Alaskan CTE school environment as measured on the connectedness survey and level of academic achievement as measured by their GPA?
H010: Among Alaska Native/American Indian students, there is no linear correlation
between level of student connectedness in an Alaskan CTE school environment as measured on the connectedness survey and level of academic achievement as measured by their GPA.
HA10: Among Alaska Native/American Indian students, there is a linear correlation
between level of student connectedness in an Alaskan CTE school environment as measured on the connectedness survey and level of academic achievement as measured by their GPA.
Rationale, Relevance, and Significance of Study
The call to move the school improvement needle from average school to exceptional school is a message that school leaders must face with informed readiness. Moving the school improvement needle requires more than a focus on one specific area of the organizational structure. Student connectedness is the binding agent that keeps youth safe and engaged in the learning process. School violence, on the other hand, is a factor that inhibits connectedness. Other factors are less obvious and often overlooked by educational leaders. For example, a school lunch program that serves low quality food and limited options might impact a student’s attitude toward school. Therefore, it is imperative that educational leaders understand the factors that may lead to student connectedness and how to use student connectedness data in order to develop exceptional schools and enhance academic achievement through CTE school-based connectedness interventions.
This study is significant because it builds on previous studies of student connectedness while moving in a new direction by exploring the context of CTE student connectedness, ethnic groups to include gender, and academic achievement. The literature on student connectedness has not examined CTE student connectedness and the relationship with ethnically diverse and underachieving student populations. This study addressed the research literature deficiency by empirically exploring these relationships using correlational survey research methods. This study sought to explain these relationships by analyzing the data and applying it to the
conceptual framework and research associated with the student connectedness phenomenon. Information from this study will benefit CTE educational leaders and teachers, district administrators, professional development specialists, students and parents, and contribute to the body of educational research on student connectedness. The findings of this study can enable CTE educational leaders to make policy changes to improve student connectedness in diverse school districts. Educational policies must focus on ways to improve student connectedness as a viable means for increasing academic achievement and reducing the dropout rate. Thus,
educational policy makers should consider the following: generating greater access and equity to CTE schools and programs, design and implement professional development based on
connectedness survey data, and policy focused on postsecondary and career planning through the introduction of CTE courses and the concept of workforce preparedness as early as middle school (Fluhr, Choi, Herd, Woo, & Alagaraja, 2017). This study will be of great value because the findings will help increase awareness of student connectedness and effective ways to enhance all students’ educational experiences and academic outcomes. Information from this study can assist school districts, CTE practitioners, educational leaders, and stakeholders to develop a course of action that will help diverse student learner groups connect with their schools,
potentially leading to enhanced academic achievement and increased post-secondary options for students.
Definition of Terms
Career and Technical Education (CTE): A program of study that provides students with academic, technical skills, real-world application, and training to succeed in a future career path (ACTE, 2017).
Student Connectedness: Student connectedness refers to students’ beliefs that they are cared about and supported in educational environments (Pate et al., 2017; Wallace et al., 2012). Student connectedness is a multidimensional construct and involves three components: social relationships, relationship with the school, and attitudes toward the importance of school (Chung-Do et al., 2015; Pate et al., 2017). Socially, student connectedness involves positive relationships at school, including interaction and support from teachers, administration, and staff. Relationship with the school involves a sense of belonging or being part of the school
community, including feeling safe and happy at school. Student connectedness also involves students holding positive attitudes toward the importance school, including students caring about school and wanting to do their best (Chung-Do et al., 2015; Pate et al., 2017). The terms
associated with student connectedness are bonding, attachment, membership.
Ethnically diverse student population: A population of students that is equally represented by all demographic ethnic groups as defined by the U.S. Government (Tunseth, 2015).
Academic Achievement: An above average GPA (3.0) and on track to graduate on time (Tekin, 2014).
Assumption, Limitations, and Delimitations
Assumptions. Assumptions were identified by the questions raised regarding
representativeness of the population, truthfulness of the respondents, and the accuracy of data (Leedy & Ormrod, 2012). One assumption is that the participants randomly selected to participate in the study are representative of the population. If many of the students who were randomly selected to participate in the study complete the survey, then the goal of a
representative population will have been met. Another assumption is that students would accurately answered the survey questions. If the students accurately answered the survey questions, then the belief that they have been honest about reporting their grade point average holds true. It is assumed that the data collected were accurately organized.
Limitations. This study has several limitations that were identified. First, the limitations of quantitative correlational research are the manipulation of the sample and control factors that do not allow for the establishment of cause and effect relationships. The selection of a
quantitative design limits the research in terms of analyzing the underlying perceptions of the participants. A quantitative approach was selected to analyze for strength of relationships between the variables of interest. A random sample has limitations that must be considered when using this method. The results run the risk being biased when the selection process does not represent the target population which creates the possibility of over and under
representation. The possibility of biased results creates the possibility of sampling error, which limits generalizing the results into conclusions that represent a population (Mills, Durepos, & Wiebe, 2010).
The limitation of self-reporting on questionnaires is a well-known weakness with issues involving the design of the instrument, honesty, response bias, and the mental ability to report
accurately. Another limitation is the use of closed-ended survey questions which limits the respondent’s ability to provide unique idiosyncratic information. Geographic location is a limitation because the study was restricted to Grades 9–12 students in a large urban Alaskan school district. The study was limited to the voluntary responses of students who opted to take the survey (Fan et al., 2006).
Delimitations. This study has several delimitations. First, data were only collected from a CTE high school in a large urban Alaskan school system that has not explored student
connectedness. Secondly, the study delimited the survey to Grades 9–12 students who elected to attend the CTE school on a part-time (half of a school day basis) and not CTE student
experiences in a comprehensive high school where CTE courses are offered. To maximize validity of the survey, a well-known student connectedness instrument was selected as the survey tool for this study. In addition, exceptional care was taken ensure the content of the surveys aligned with the research questions; and that safeguards were in place to properly protect and store data.
Summary
Student connectedness is associated with reducing the dropout rate, increasing academic achievement, and contributes to better health. Career and Technical Education participation is not associated with academic achievement and this common perception continues to perpetuate the notion that CTE is an education for low achieving students. Students who are disconnected from school and do not do well academically risk involvement in self-destructive behavior that will impact future success in life. There is a lack of knowledge concerning ethnically diverse populations, to include gender, regarding CTE student connectedness and academic
through measuring the relationship CTE student connectedness has with academic achievement among the various ethnic groups and genders that constitute the school. The purpose of this study is to explore student connectedness as it relates to academic achievement in the context of an ethnically diverse CTE school. To decrease the dropout rate and increase the unemployment rate with skilled workers, CTE school educational leaders need to know if there is a correlation between connectedness, grade point average, ethnicity, and gender.
Chapter 2: Literature Review Introduction to the Literature Review
Schools are designed with the goal of educating all students for a successful future. Secondary education has the responsibility of setting the course of student success by
emphasizing the importance of post-secondary education. The post-secondary future may entail entering the workforce with high school level skills, joining the armed forces, attending a technical college, or going to a university. The drop-out rate is alarming with 7,000 students a day in the U.S. dropping out of school (DoSomething.org). The public high school national graduation rate has steadily grown over the past five years (2010–2015) from 79% to 83%, with 65.9% of high school graduates in 2013 attending a 2- or 4-year college (National Center for Education Statistics, 2017). That means 17.1% are entering the workforce, or joining the armed forces, or have dropped out of school. The six-year graduation rate reported in 2009 was 59%, the number of 18–24 year olds in 2008 reported in the armed forces was 1.8%. By using the national graduation rate of 79% from 2010 and the armed forces rate of 1.8%, we can infer the number of individuals that have entered the world without career and technical skills is close to 30% of the population under 24 years of age (National Center for Statistics, 2017). School systems attempt to reduce this number by examining ways to connect students to school in the present to increase the possibilities for success in future. Career and Technical Education (CTE) is at the forefront of connecting students to a future by offering students 21st century academic and technical skills.
Student connectedness refers to students’ beliefs that they are cared about and supported in educational environments (Wallace et al., 2012). Student connectedness is a multidimensional construct and involves three components: social relationships, relationship with the school, and
attitudes toward the importance of school (Chung-Do et al., 2015). Socially, student
connectedness involves positive relationships at school, including interaction and support from teachers, administration, and staff. Relationship with the school involves a sense of belonging or being part of the school community, including feeling safe and happy at school. Student
connectedness also involves students holding positive attitudes toward the importance school, including students caring about school and wanting to do their best (Chung-Do et al., 2015).
People who struggle to form social connections are more prone to physical and psychological heath issues (Seppala, 2012). For a student to get the most out of learning, a school must ensure that physiological (access to food, warmth, rest) and safety factors are intact. In addition, a school must emphasize social unity to help students build social capital, which helps students develop psychologically and academically. The body of research suggests that there are significant cognitive, behavioral, and emotional differences between a student who is connected to school and one who is not. The disconnected student has greater risk of physical and psychological health issues. Therefore, it is important for schools to assess student connectedness levels to promote better access to learning.
Student connectedness offers a protective and preventative force that helps reduce the health-risk behaviors of substance abuse, violence, and sexual activity (McNeely, Nonnemaker, & Blum, 2002). The power of connectivity decreases health-risk behavior and increases
academic achievement, peer relations, and emotional well-being (Lohmeier & Lee, 2011). Likewise, disconnectedness is linked to boredom, sensation-seeking behavior, an antisocial disposition, decreased imagination, substance abuse, delinquency, and has been shown to decline when students transition in and out of middle school (Hunter & Csikszentmihalyi, 2003; Oelsner, Lippold, & Greenberg, 2011). The positive benefits for students connected to school are
increased attendance, a reduction and/or and absence of behavioral problems; and an increase in the following domains: learning outcomes, social capital, academic achievement, and healthy lifestyle choices. The positive benefits for teachers of students connected to school are a
reduction in behavioral problems, increased learning outcomes, constructive peer interaction, and increased job satisfaction.
When we feel connected and part of a community, we experience a moving sensation— something greater than ourselves—a perception that transcends the everyday world of mundane experiences—we come alive and excited with a sense of joy and wholeness that words struggle to describe (Hunter & Csikszentmihalyi, 2003; Seligman, Ernst, Gillham, Reivich, & Linkins, 2009; Shernoff, Csikszentmihalyi, Schneider, & Shernoff, 2003; Smith & Christakis, 2008). Connectedness is the bedrock of motivation, achievement, and the formation of meaningful human relationships. Therefore, it is imperative that school leaders construct an educational environment that focuses on connectedness in order to help students achieve academic goals that extend beyond the confines of the school and into the future with a strong sense of a career path.
Chapter 2 includes analysis and synthesis of literature on student connectedness. The chapter also includes the theoretical foundation that will guide this study by providing a
contextual understanding and a structure for explaining observations (Creswell, 2014). A review of the literature and methodological issues will be presented in a manner that summarizes the key issues found in the body of student connectedness research literature. Next, an analytical review of the methodological issues will be presented to help with understanding the methodological choices made by researchers in the field. Then, the synthesis of research findings will present what has been discovered through the review of literature and the launching point for this study. This section will be followed by the critique of previous literature where I will make my case
regarding the rationale for the direction of this study based on the discoveries made while conducting the review of literature. The chapter will conclude with a summary of Chapter 2.
Conceptual Framework
The following section defines the epistemological position selected to approach the student connectedness phenomenon. The review of the literature has influenced my choice of theories and concepts and when combined frame the way in which I view the student
connectedness phenomena. Theoretical conceptualizations regarding student engagement, learning, and academic achievement have illuminated social capital, school bonding, student participation, and investment in the process of learning. Finn’s (1989, 1993) participation-identification model of school engagement theory has influenced student connectedness theories by emphasizing the importance of student engagement and school completion. I used Finn’s conceptual framework to theoretically explain the factors and variables at work regarding the connectedness phenomena. In addition to the presentation of the theory and concepts, the section concludes with the graphic presentation of Finn’s (1989, 1993) participation-identification model of school engagement and the withdraw cycle graphic representation that supports the student connectedness construct of this study.
This study was conducted using a conceptual framework situated in the behavioral and psychological motivation model comprised of Finn’s (1989) participation-identification model of school engagement and the cycle of withdraw. This theory operates within the social and
emotional learning space of staff and students; and extends beyond the confines of the institution into the home of the student. To fully conceptualize student connectedness, it is necessary to examine a theory that is aligned with a relational and engagement model of learning.
The full meaning and to what extent connectedness can be measured, as research findings show, is debatable. For example, in the field of positive psychology, connectedness is discussed as social networks and social capital variables that influence a person’s happiness, whereas sociology operates from the perspective of Hirschi’s (1969) social bonding theory. In addition to clarifying the concepts and theories, a review of the connectedness literature would not be
complete without discussing environmental factors, the problems of measurement, gender, ethnicity, socioeconomic status, interventions, outlook on life, and the health and wellness perspective.
Although disconnected students might use the word “suck” to describe their experience in school, learning does not take place in a vacuum. Learning is embedded within a multiplicity of social contexts that are synchronous (Brofenbrenner, 1979). Finn’s (1989)
participation-identification model posits that students who engage in school by participating in classroom and extracurricular activity are more likely to develop a sense of school identification. Finn’s (1989) participation-identification model suggests that dropping out of school is a result of a
participatory disconnect that stems from the following components: Responsiveness to school requirements, participation in the classroom, participation in extracurricular activities, and involvement in the decision-making process at school.
Finn’s (1989) withdraw-cycle model describes dropping out as the final stage of a long series of cumulative events that foster school disengagement. In the withdraw cycle model, the process begins with a physical withdraw that creates an achievement problem at school which leads to frustration and emotional withdraw. The student rejects school through nonparticipation which could be exhibited through low attendance, passive learning, and disruptive behavior. Thus, the unsuccessful school outcomes produce emotional withdraw, a nonidentification stance
toward school, and impacts academic achievement. This is a negative cycle in which failure, frustration, and disruptive behavior impact successful performance outcomes, thus academic achievement indicators, such as grade point average is lower than peers who have a strong identification with school. Schools are social institutions that encourage participation through the process of socialization (Finn, 1989; Griffin, 2002; Rumberger, 2004; Whiteside-Mansell et al., 2015). As students socialize and increase participation in meaningful ways their
identification with the school increases as does the likelihood of academic success. Thus, the likelihood ofstudents dropping out is reduced and the overall climate of the school becomes a place where students to take an active role in their education.
The first component of Finn’s (1989) model of student engagement is responsiveness to school. According to the theory, students arrive at school predisposed with beliefs, behaviors, attitudes, and a skillset that contributes to being successful in an educational environment. Thus, the ability to respond well to school requirements fosters a positive attitude about school. The school requirements may include attendance, assignment completion, tests, classroom
participation, and behavior expectations. The second component is class-related initiative, which is evident in the way in which students engage in learning. Class-related initiative includes dialoguing with the teacher, asking questions, enthusiasm, spending more time than is required in the classroom, looking for additional opportunities to learn. Finn (1989) contends that classroom enthusiasm transforms interests into participation in subject-related activities, such as clubs, electives, and community events. The third component is involvement in extracurricular activities. Extracurricular is any activity that is not required to graduate from high school. Extracurricular is used to refer to electives, clubs, and sports. Finn (1989) asserts, “many
or at times in place of, extensive participation in academic work” (p. 128). Finn (1989) believes that struggling learners develop a sense of belonging because they have the opportunity to participate in something they enjoy doing and feel good about participating in that does not resemble a traditional academic classroom environment. The final component is decision making which is described by Finn (1989) as “participation in governance of the school” (p. 128). Student voice involves increasing opportunities for students to actively engage in setting goals, making decisions, and participating in the governance of the school’s disciplinary structure. Finn’s (1989) participation and identification model theory holds that when these components are maximized student identification and involvement increases and their sense of belonging to the school is fortified.
The variables within the Finn (1989) model that influence participation and successful outcomes are the quality of instruction and the abilities of the student. Student disconnect evolves into an erosion over time with mounting difficulties that go unresolved. Some students begin school without the expected behaviors and skills needed for successful participation and academic achievement. The student with a deficient skillset paired with a teacher who exhibits low quality instruction is set-up to enter the cycle of withdraw. Thus, the cycle of withdraw begins and participation and identification become a difficulty to achieve. Over time, this student is more likely to experience feelings of alienation and disconnect. This cycle of disconnection if not rectified may lead to deviant behavior and dropping out of school (Finn, 1989).
Figure 1. Participation-identification model (Finn, 1989).