E
xEcutivES
ummaryMost companies undertaking purchase-to-pay (P2P) transformation rely on effi-ciency-related metrics, such as headcount reductions and other direct cost benefits, since these are fairly easily quantified for the purposes of building a business case and measuring success. However, expanding the scope from direct process-cost savings for a typical $10 billion consumer packaged-goods company to address effectiveness improvements increases the savings potential from $4 million for the former to $44-66 million. Because optimizing the effectiveness of the end-to-end P2P process requires a cross-functional effort, transformation initiatives must be based on a holistic P2P Service Delivery Model.
t
hEc
aSE forW
idEning thEf
ocuS ofi
mprovEmEntE
ffortSMany forces, such as intensifying global competition, changing business operating models, globalization, and recessionary conditions, dictate that companies con-tinue extracting maximum value from all processes, including transactional ones. For procurement and finance executives, this means wringing more savings from the purchase-to-pay (P2P) process.
Process efficiency is relatively easy to quantify and therefore traditionally has been the main focus and basis of business cases for process improvement. But, rather than settle just for improving direct process costs (i.e., labor and outsourcing), leading-edge companies have broadened the scope of their initiatives to encom-pass processes from end to end. Doing so opens up a far wider set of effectiveness-related cost drivers.1
To their credit, many companies already measure effectiveness via key perfor-mance indicators (KPIs). However, the practice of quantifying the financial
impact of effectiveness has been limited to date because the potential value that can be derived from improving process effectiveness is not widely understood. In response, we have delved into individual P2P value drivers and created an effective-ness quantification model, which is shared at a high level in this research.
By Pierre Mitchell and Lynne Schneider
Purchase-to-Pay Process Perspective
Management Issue
1 The broader opportunity beyond traditional, efficiency-oriented metrics is discussed in “Defining and Expanding
the Value Proposition of P2P,” Purchase-to-Pay Process Perspective, November 2010.
Complimentar
y R
esear
ch
B
eyond
P
rocess
e
fficiency
:
H
ow
to
acHieve
12-14
times
HigHer
savings
New Hackett framework quantifies the cost gaps in effectiveness performance between top performers and the peer group.
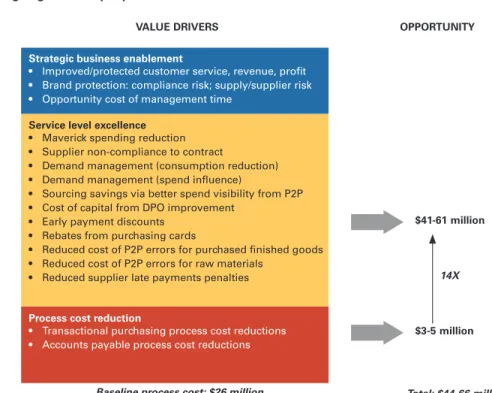
Page 2 Our analysis of the potential returns from P2P effectiveness improvement reveals a vastly higher potential payoff than that achievable from efficiency improvements alone (as measured in direct process cost). Improvements manifest themselves through improved service levels and operating excellence (Fig. 1). These, in turn, deliver benefits right to the organization’s bottom line.
In our analysis, we modeled the business-value opportunity of improving perfor-mance in both efficiency and effectiveness at a fictitious company in the consumer packaged goods sector, scaled to a revenue base of $10 billion. This analysis identi-fied a direct process-cost savings potential of $3-5 million. However, the improve-ment of operational excellence via service level improveimprove-ments are estimated at $41-61 million. If companies limit the scope of their efforts just to efficiency improvements in direct process costs, they are overlooking this much larger poten-tial opportunity.
c
loSingthEp
ErformancEg
apr
EquirESc
roSSingf
unctionalB
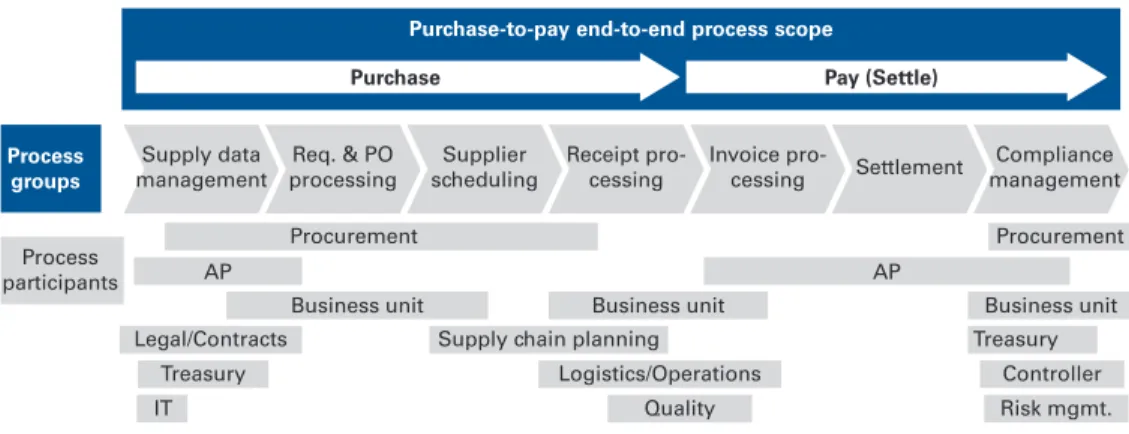
oundariESThe effectiveness of the end-to-end P2P process is influenced by multiple areas in a company. Therefore, in order to achieve effectiveness improvements, any transformation initiative must recognize the existence of cross-functional depen-dencies. The transformation effort should include stakeholders from finance and procurement, as well as others representing functions contributing to and/or receiving P2P services and outputs (Fig. 2).
FIG. 1 Value drivers and savings potential in P2P for typical $10 billion consumer packaged-goods company
Source: The Hackett Group
Strategic business enablement
• Improved/protected customer service, revenue, profit • Brand protection: compliance risk; supply/supplier risk • Opportunity cost of management time
Process cost reduction
• Transactional purchasing process cost reductions • Accounts payable process cost reductions
Baseline process cost: $26 million Service level excellence
• Maverick spending reduction • Supplier non-compliance to contract
• Demand management (consumption reduction) • Demand management (spend influence)
• Sourcing savings via better spend visibility from P2P • Cost of capital from DPO improvement
• Early payment discounts • Rebates from purchasing cards
• Reduced cost of P2P errors for purchased finished goods • Reduced cost of P2P errors for raw materials
• Reduced supplier late payments penalties
$41-61 million
Total: $44-66 million
VALUE DRIVERS OPPORTUNITY
$3-5 million 14X
Hackett’s research identified the improvements yielding the highest returns at every stage in the end-to-end process. The analysis framework (Fig. 3) incor-porated purchased cost reductions, process-cost (i.e., labor and outsourcing) reductions, and cost-of-capital reductions from working-capital improvements. Opportunities were classified into four summary-level components representing different dimensions of potential cost savings. These are further segmented into individual, quantifiable elements.
FIG. 2 P2P responsibilities are highly cross-functional in nature
Source: The Hackett Group
Supply data
management processingReq. & PO schedulingSupplier Receipt pro-cessing Invoice pro-cessing Settlement managementCompliance
Purchase-to-pay end-to-end process scope
Purchase Pay (Settle)
Process groups Process Groups Process participants Procurement Procurement AP AP Business unit
Legal/Contracts Supply chain planning Treasury
Treasury
IT Quality Risk mgmt.
Controller Logistics/Operations
Business unit Business unit
FIG. 3 The Hackett Group’s P2P framework and measurement taxonomy
Source: The Hackett Group
*All value drivers reflect the bottom-line value impact of improving performance from peer-group levels to world-class or best achievable.
Summary
level Element Definition
Purchased
cost Maverick spendingSupplier non- Eliminating lost savings from employees not utilizing preferred vendor agreements. compliance to
contract
Ensuring that suppliers comply with contracts (pricing, deliverables, etc.) and are submitting accurate and non-duplicated invoices via the approved P2P process design.
Consumption
reduction Using P2P demand management to facilitate consumption reduction via substitution, postponement, etc. (e.g., recommending lower price items such as supplies, airline flights). Spend influence Using the P2P process to better capture demand for spending not yet sourced (e.g.,
one-time buys, spend not yet strategically sourced) and then applying strategic sourcing best practices.
Sourcing
productivity Improving productivity of sourcing staff with enhanced access to meaningful spend data generated within the P2P process. Capital cost DPO improvement Lowering the cost of capital associated with days payable outstanding (DPO) using P2P best
practices for payment timing clocks, invoice/payment process failsafing, P2P-related aspect of terms conversion (e.g., via supplier on-boarding).
Early payment
discounts Improving capture of early payment discounts against existing payment terms, including the use of dynamic discounting (e.g., using e-invoicing to receive supplier invoices before the early payment date passes).
Purchasing cards Capturing rebates and process efficiencies through the use of p-cards. Transactional
quality cost Purchased goods transaction quality Reducing the costs associated with incorrect ordering of purchased finished goods, including return-to-vendor costs, quality costs, inventory related costs, and customer-facing costs.
Raw materials
transaction quality Reducing the costs associated with incorrect ordering of raw materials, including return-to-vendor costs, quality costs, inventory related costs, schedule disruption. Supplier penalties Eliminating penalties due to supplier payments made after the payment due date. Process costs Reduction of
Page 4
f
ourp
rimaryp2p p
ErformancE-i
mprovEmEnto
pportunityc
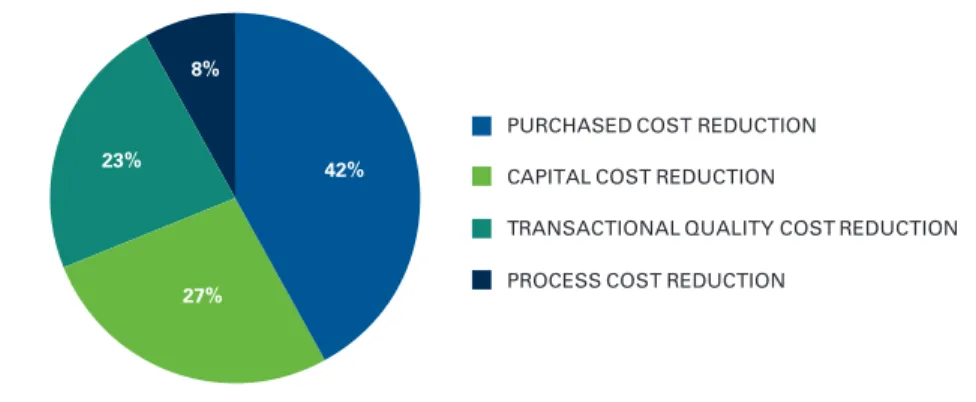
omponEntSEach summary-level component shown in Fig. 3 has associated savings. While not equally distributed, each of the effectiveness areas shows potential far greater than the traditional focus of process-related costs for our sample $10 billion company
(Fig. 4). Effectiveness is the key to better performance.
The distribution of potential improvements may be further segmented to show the expected value for each element within the summary level. Each of these seg-ments offers specific, quantifiable opportunities, as discussed below.
Efficiency: Process cost reduction
World-class organizations exhibit a far lower purchasing process cost and AP pro-cess cost than the peer group. By simplifying and standardizing propro-cesses, mak-ing use of enablmak-ing technology and leveragmak-ing a Global Business Services (GBS) model, the performance gap is approximately $4 million. These savings come from increasing efficiency in both the purchasing and accounts payable processes. These savings are far a good start, but they represent only 8% of the total prize.
Effectiveness: Purchased cost reduction
In this area, the greatest opportunity is in maverick spending (Fig. 5). Top perform-ers have more-mature capabilities to support this area, including better informa-tion about which departments and individuals are purchasing outside of the pre-ferred arrangements. The result is the ability to redirect this spending and save the organization money. For some companies, the potential in this single area is greater than that for all of the other purchase-cost related improvements combined. FIG. 4 Efficiency and effectiveness performance-gap allocation
(Opportunity value range of $44-66 million)
Source: The Hackett Group, 2011
CAPITAL COST REDUCTION
TRANSACTIONAL QUALITY COST REDUCTION PURCHASED COST REDUCTION
PROCESS COST REDUCTION
42%
27% 8%
Effectiveness: Capital cost reduction (from working capital improvements)
Improving effectiveness in the capital cost area means exploiting opportunities to free up cash by stretching out payments to the extent possible, and taking advan-tage of payment discounts and rebates. This permits companies to wring financial efficiency from the payment process. For the sample company, much of the oppor-tunity could be realized when lowering the cost of capital associated with days pay-able outstanding (DPO) through application of P2P best practices such as using payment timing clocks, payment term optimization and invoice/payment process failsafing (Fig. 6).
FIG. 5 Purchased cost performance-gap allocation (Opportunity value range: $19-28 million)
Source: The Hackett Group, 2011
55%
SUPPLIER NON-COMPLIANCE TO CONTRACT CONSUMPTION REDUCTION MAVERICK SPENDING 20% 5% 10% 10% SPEND INFLUENCE SOURCING PRODUCTIVITY
FIG. 6 Capital cost performance-gap allocation (Opportunity value range: $12-18 million)
Source: The Hackett Group, 2011
59%
EARLY PAYMENT DISCOUNTS PURCHASING CARD IMPROVEMENTS DPO IMPROVEMENT
34% 7%
Page 6
Effectiveness: Transactional quality cost
Improving the transactional quality, i.e., avoiding errors in purchasing transac-tions and payments, offers a higher return than achieving greater efficiency in the processing aspects of purchasing operations and accounts payable (Fig. 7). The largest opportunity for the typical company is reducing supplier payment penal-ties. Of course, the size of the potential opportunity will vary by company.
c
apturing thEf
ullv
aluE ofE
ffEctivEnESSi
mprovEmEntSr
EquirES ah
oliSticr
EdESign of thES
ErvicEd
ElivErym
odElCapturing the full value of transformations in P2P (i.e., consisting of both effi-ciency and effectiveness improvements) requires a holistic redesign of the func-tional SDM (see sidebar). An in-depth analysis of P2P transformation is beyond the scope of this report, but The Hackett Group has published extensive research on the subject (see the Related Hackett Research section). The most important prin-ciples are:
1. Design P2P as an end-to-end process, extending beyond finance’s tradi-tional functradi-tional boundaries.
2. Assign a single, global process owner.
3. Understand the connection between P2P and other related processes.
4. Leverage enabling technology at both a transactional and business-intelli-gence level.
5. Establish a systemic approach to performance management with appropriate feedback through measurement and reporting of KPIs.
6. Place services where maximum use can be made of leverage resources (such as in a GBS organization).
FIG. 7 Transactional quality cost performance-gap allocation (Opportunity value range: $10-16 million)
Source: The Hackett Group, 2011 11%
RAW MATERIALS SUPPLIER PENALTIES PURCHASED FINISHED GOODS
20%
69%
The Service Delivery Model defined
The Service Delivery Model, or SDM, is The Hackett Group’s generic framework for the design and transformation of business functions. It is a valuable structure for assessing the P2P end-to-end process. The seven components of the SDM are: 1. Information 2. Enabling Technology 3. Process Design 4. Service Placement 5. Process Sourcing
6. Skills & Talent
When transforming an organization where process owners are situated in func-tional silos, an end-to-end process champion can keep activities aligned with function-specific goals as well as with related areas, such as supply chain. Creating a feedback loop through process performance measurement is vitally important. This may not require the organization to expend a huge amount of effort on defining new metrics or collecting new data. It is likely that this data already exists, but currently resides within disparate systems and parts of the organization. It does, however, require a concerted effort to identify and integrate existing information sources.
When initially scoping improvement efforts, it is essential to have baseline data on current-state process performance. This is where objective, third-party resources can be especially helpful in performing triage and prioritizing action steps. Even after changes have been designed and implemented, a third-party resource can help the organization monitor its progress toward goals as well as locate opportu-nities where best practices may be applied to maximum advantage.
S
tratEgici
mplicationSThe opportunity in P2P is clearly not the reduction of transactional headcount, but rather the ability to reduce consumption, better utilize preferred vendor agreements, optimize working capital, and improve the end-user experience of the process to allow employees to focus on higher-value activities. This yields an important observation: The P2P process is an extension of the source-to-settle (S2S) process.Thus, P2P buy-pay channels should be designed in accordance with the spend-category specific requirements of the stakeholders who own those expenditures.
To make significant performance improvements in P2P process costs, companies must set their sights higher than merely fixing process inefficiencies. Failure to recognize, measure and manage P2P effectiveness performance leaves the largest component of potential business-value realization untapped. Comprehensive P2P transformation requires a thorough measurement of the efficiency and effectiveness of the process, calculation and comparison of metrics, and modeling of the size of the opportunity. Pragmatically speaking, all the P2P value levers must be consid-ered simultaneously and bundled wherever possible to maximize the ROI of the transformation effort (in relation to competing projects also vying for funding). To quantify the possible opportunity, companies need to assess their end-to-end P2P processes using a holistic framework along the lines presented in this research. The process should be analyzed from the perspective of “improving quality at the source” and adding value to the transactional services of P2P.
In summary, the quantified benefits of an effective process outstrip the benefits of a process in which only efficiency drivers are optimized. Hackett’s analysis empiri-cally proves that there is ample opportunity to substantially reduce direct process cost, opportunity cost from having high-value staff working on tactical P2P tasks, and operational inefficiencies throughout the P2P value chain.
The Hackett Performance Exchange™ offers action-ready insight
Moving to an end-to-end process view makes it more challenging to gain a true picture of per-formance, set credible targets, measure against key metrics, or identify the best opportunities for improvements to cost, cash or service.
Often, organizations must resort to costly initiatives or employ extensive manual processes to produce the business intelli-gence they need. To simplify this effort, we developed the Hackett Performance Exchange toolset, which automatically extracts and compares performance and produces timely insight across the enterprise, independent of organi-zation structure.
This new, subscription-based solution:
• Extracts data from SAP or Oracle enterprise resource planning systems each month.
• Quantifies current perfor-mance and compares it to median and world-class per-formance data.
• Identifies and calculates the size of performance-improvement opportunities using The Hackett Group’s research database.
• Facilitates performance-improvement initiatives through access to Hackett’s Best Practice Intelligence Center and quarterly, one-on-one discussions with a senior Hackett advisor. For more information, visit
www.thehackettgroup.com/perfor-manceexchange
Page 8
r
ElatEdh
ackEttr
ESEarch“Defining and Expanding the Value Proposition of P2P,” November 2010 “AP Recovery Audits: A Tool for Cash Recovery and Performance Improvement,” November, 2010
“Leveraging Hackett’s Service Delivery Model Reduces Structural Cost Disad-vantages in Accounts Payable,” September 2010
“Optimizing the Supplier Payment Strategy Can Generate Substantial Benefits for an Organization,” April 2009
a
BoutthEa
dviSorSPierre Mitchell Senior Research Director
Mr. Mitchell is responsible for leading the development of research and other intellectual property within Hackett’s Procurement Executive Advisory Program, where he also serves as an adjunct business advisor. He has over 20 years of industry and consulting experience in procure-ment, supply chain and information technology. Mr. Mitchell is quoted widely in the press and speaks at numerous industry events on supply management trends and technologies. Previously he was vice president of supply management research at AMR Research and a manager at Arthur D. Little, where he led numerous sup-ply chain and procurement transformations at Fortune 500 companies. Other industry positions include manufacturing project manager at The Timberland Company, materials manager at Krupp Companies and engineer at EG&G Torque Systems.
Lynne Schneider Senior Research Director
Ms. Schneider has worked in consulting and related research for over 20 years. Her previous positions included Director of Research and Finance Lead for Kennedy Consulting Research and Advisory, as well as a variety of internal and external consulting positions with international companies. As Director of Business Process Improvement at American Greetings, Ms. Schneider managed a portfolio of strategic and operations projects, including both staff and line functions. She was also a senior consultant in Towers Watson’s Organization Effectiveness practice and a consultant in the Change Management practice at Accenture.
About The
Hackett Group
The Hackett Group (NASDAQ: HCKT), a global strategic advisory firm, is a leader in best practice advisory, bench-marking, and transformation consulting services including strategy and opera-tions, working capital management, and globalization advice. Utilizing best practices and implementation insights from more than 4,000 benchmarking engagements, executives use The Hackett Group’s empirically based approach to quickly define and implement initia-tives to enable world-class performance. Through its REL group, The Hackett Group offers working capital solutions focused on delivering significant cash flow improvements. Through its Archstone Consulting group, The Hackett Group offers strategy and operations consulting services in the Consumer and Industrial Products, Pharmaceutical, Manufacturing and Financial Services industry sectors. Through its Hackett Technology Solutions group, The Hackett Group offers business application consulting services that help maximize returns on IT investments. The Hackett Group has worked with 2,700 major corporations and government agen-cies, including 97% of the Dow Jones Industrials, 80% of the Fortune 100, 80% of the DAX 30 and 49% of the FTSE 100. Founded in 1991, The Hackett Group was acquired by Answerthink, which was renamed The Hackett Group in 2008. The company has offices in the United States, Europe and India and is publicly traded on the NASDAQ as HCKT. Email: [email protected] Amsterdam + 31 36 535 00 82 Atlanta +1 770 225 3600 Frankfurt am Main +49 69 900 217 0 London +44 20 7398 9100 Paris +33 1 53 43 0400 Sydney +61 2 9299 8830 Zurich +41 43 813 3010 www.thehackettgroup.com