Bank Regulatory Capital
Adjustment
Evidence from Norwegian Savings and Commercial Banks
Per Marius Pettersen
Supervisor: Øivind Anti Nilsen
Master thesis, MSc in Economics and Business Administration,
Financial Economics
NORWEGIAN SCHOOL OF ECONOMICS
This thesis was written as a part of the Master of Science in Economics and Business Administration at NHH. Please note that neither the institution nor the examiners are responsible − through the approval of this thesis − for the theories and methods used, or results and conclusions drawn in this work.
Norwegian School of Economics
Bergen, spring 2014
1
Abstract
A growing body of theoretical literature suggests that banks have a target capital structure.1 This idea is supported by the empirical findings that it exists a large cross sectional variation in regulatory capital ratios and that these ratios often are well above the minimum requirements. Rationalized by a simple cost-benefit analysis, the literature suggests that profit-maximising banks choose a target capital ratio to which they actively adjust over some time period.
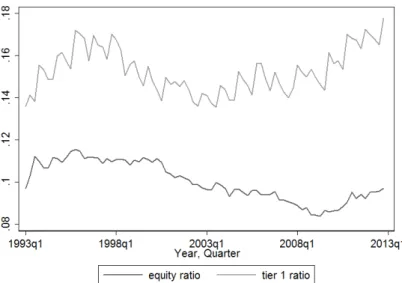
This master thesis examines the regulatory capital adjustments of Norwegian banks over the period 1993q1 to 2013q1. Firstly, we analyse the factors contributing to banks’ unobservable target capital ratios and the speed at which banks adjust their capital structure. Secondly, we investigate how these adjustments are performed.
We find evidence for capital optimization in terms of the Tier 1 capital ratio. A notable finding is that Norwegian banks face substantial costs of adjusting their capital ratios. On average, Norwegian banks close only 4.1 percent of the gap between their effective capital ratio and target each quarter. Cost of adjusting capital may therefore be an important explanation why they hold capital ratios above the regulatory minimum. Banks’ target capital ratio is shown to decrease with bank size. On the other hand, an increase in earnings capacity and managers’ perception of risk is shown to increase target capital ratios.
Adjustments towards target capital ratios have significant impact on both assets and capital. Our result indicates that Norwegian banks prefer to fine-tune their risk-weighted assets instead of making real changes to the size of their balance sheet when being away from their target capital ratio. Furthermore, we find that banks are more likely to increase their capital levels when they are below their target capital ratios, than they are to decrease it when they are above.
2
Contents
Abstract ... 1
1. Introduction and Motivation ... 4
2. Bank Capital Structure and Adjustment Decisions ... 6
2.1 Does Capital Structure Matter? ... 6
2.1.1 Effects of Debt Guarantee ... 7
2.1.2 Effects of Taxes and Asymmetric Information ... 8
2.1.3 Effects of Costs Associated With Bankruptcy and Financial Distress ... 8
2.2 Capital Adjustments ... 9
2.3 The Effects of Bank Capital Adjustments on the Real Economy ... 10
3. Bank Capital Regulation ... 12
3.1 The Rationale for Bank Regulation ... 12
3.1.1 Basis of Micro-Prudential Regulation ... 12
3.1.2 Basis of Macro-Prudential Regulation ... 13
3.2 Capital Adequacy Requirements and the Basel Accords ... 14
3.2.1 Basel I ... 14
3.2.2 Basel II ... 16
3.2.3 Basel III and CRD IV ... 18
4. Defining a Bank Capital Target ... 20
4.1 What Do We Know About Banks` Target Capital? ... 20
4.2 A Model of Capital Adjustment ... 21
5. Other Relevant Literature ... 23
6. Data ... 25
7. Empirical Strategy ... 27
7.1 Estimating the Bank Capital Targets ... 27
7.2 Deriving Bank Capital Targets and Capital Deviations ... 31
3
7.3.1 Identification Issues – Supply vs. Demand Shifts ... 33
8. Econometric Methodology ... 34
8.1 Removing the Fixed Effects ... 34
8.2 Instrument Variables Approach ... 36
8.3 System GMM ... 39
8.4 Applications of The Econometric Techniques ... 39
8.5 Model Diagnostics ... 41
9. Results ... 43
9.1 Descriptive Statistics ... 43
9.1.1 Tier 1 Capital Ratio ... 43
9.1.2 Other Variables ... 44
9.2 Banks’ Target Capital Ratio and Speed of Adjustment ... 46
9.3 Impact of Capital Ratio Deviations ... 50
9.3.1 Banks’ Response on Capital Deviations – Symmetric Reactions ... 51
9.3.2 Banks’ Response to Capital Deviations – Asymmetric Reactions ... 53
10. Summary and Concluding Remarks ... 55
Bibliography ... 57
A.1 The Modigliani and Miller Irrelevance Theorem ... 64
4
1. Introduction and Motivation
It is well known that the capital structure of banks differ from that of non-financial firms in a number of dimensions. Due to their important role as financial intermediaries, banks have the ability to finance themselves with customer deposits. These deposits are generally insured by deposit guarantee schemes. Some banks have also gained an implicit guarantee of their debt. This may induce them to hold low capital levels. Moreover, banks’ approach to managing their capital ratios can have important macroeconomic effects. As emphasised by Adrian and Shin (2010), a negative shock to banks’ capital ratios can lead to downward shifts in credit supply, resulting in procyclical effects of bank capital management. Banks are therefore subject to regulatory capital requirements.
But banks’ balance sheets displays capital ratios in excess of the regulatory minimum. This does not necessarily mean that they are not capital-constrained at all. Banks are very likely to hold a voluntary buffer over the regulatory minimum requirement in order to reduce the likelihood of supervisory intervention or the need to raise capital on short notice. Moreover, market participants may constrain banks to hold an institution-specific cushion over the regulatory capital level (Lindquist, 2003; Stolz & Wedow, 2005). A growing body of literature therefore suggests that banks chose a target capital ratio to balance the benefits and costs of increasing their capital level (Berlin, 2011; Memmel & Raupach, 2010). The process of capital adjustments towards this target can have important policy implications and should be closely monitored. Banks that have enough regulatory capital may nonetheless have large deviations from their optimal capital targets, which can potentially induce large fluctuations in credit supply.
The present master thesis seeks to analyse the following questions: First, what factors determine banks’ internal target capital ratios? Second, how do deviations from these target capital ratios influence banks’ actions in terms of adjustments in their capital and asset position?
In a first step, a partial adjustment model is developed in order to estimate the factors contributing to banks’ target capital ratios. This step is justified by theory and empirical evidence supporting the idea that banks face capital adjustment costs that preclude them from achieving their desired levels immediately (Berrospide & Edge, 2010; Francis & Osborne, 2009b). Banks try to converge towards an implicit target while maximising their profit. We focus on the Tier 1 capital ratio and estimate banks’ implicit targets as well as the speed of
5 adjustment at which they move towards these targets by using observables from bank balance sheets. The model is estimated on a panel of Norwegian banks over the period 1993q1 to 2013q1. The partial adjustment framework also allows us to compute the deviation between each banks effective and target capital ratio in each period.
In a second step, we investigate how these deviations influence banks capital decisions. Deviations from target capital ratios are likely to be reflected in adjustments to banks’ balance sheets. For instance, when banks experience a capital shortfall relative to their target, they can increase the numerator of the capital ratio by issuing new equity or retaining earnings. Alternatively, they can reduce the denominator by slowing down their overall lending growth or seek to reduce their risk-weighted assets by replacing riskier loans with safer ones. By estimating the impact of banks’ target capital ratio deviations on the growth in different capital and asset items, we are able to assess how banks perform their adjustments towards their targets.
The master thesis is organized as follows. In the next section we discuss banks choice of capital structure and the capital adjustment process from a theoretical point of view. In section 3 we discuss the basic considerations for bank regulations and present a review of the regulatory frameworks over the period of analysis. In section 4 we extend the discussion on bank capital structure and present a model on banks total adjustments costs. We review relevant literature in section 5 and describe the data in section 6. In section 7 we present and describe the partial adjustment model, and the models of growth in different capital and asset items on a banks balance sheet. In section 8 we discuss econometric methodology and its applications to our dataset. We display and discuss descriptive statistics and results in section 9. Section 10 summarizes and provides some concluding remarks.
6
2. Bank Capital Structure and Adjustment Decisions
The problem of how firms choose and adjust their capital structure has brought a great deal of attention from corporate financial economists and has been an intense source of debate. In a banking context, the outset of such debate is, among other issues, the question of the relevance of a bank’s equity ratio for its total funding costs. This section provides a theoretical background for this question and discusses factors that might affect the ongoing costs of holding equity on a bank’s balance sheet. It also discusses how market frictions are likely to affect the costs associated with raising new external equity, and how banks’ choices among various strategies for adjustments in equity ratios can have macroeconomic outcomes.
2.1 Does Capital Structure Matter?
Financial firms generally hold less capital than non-financial firms. Spokespersons for the banking industry often assert that a higher reliance on equity will increase banks’ funding costs, simply because equity holders require a higher return than debt holders, or equity is more expensive than debt. However, by itself this assertion has no sound basis in corporate finance (Vale, 2011).
One of the most important insights regarding capital structure is the Modigliani and Miller (1958) irrelevance theorem, henceforth MM. It states that the total value of a firm is independent of its capital structure, i.e. of the composition of its liability side. This implies also that the total funding costs of the firm are independent of its liability structure, or in our context that a bank’s total financing costs are independent of its equity ratio. The essence of MM`s result is that the required return on equity depends on the equity ratio. Higher equity ratio implies lower volatility of the equity. Since rational pricing implies that a less-risky financial claim commands a lower risk premium, it follows that the required return on equity will fall. In addition, more equity relative to debt means that the debt becomes safer and also requires a lower return. Even if equity always is riskier than debt, MM´s result implies that the effect of the lower risk premiums is just enough to offset the increased weight on the more expensive equity, so that the weighted average funding costs remains constant2.
However, MM critically depends on a set of ideal and stringent conditions – they include, for instance, no distortionary taxes, symmetric information and no transaction costs. Deviations from these conditions are likely to affect banks as well as non-financial firms.
7
2.1.1 Effects of Debt Guarantee
A special feature of banks is an explicit and implicit guarantee of banks’ debt. The existence of such a guarantee implies that bank owners do not have to compensate creditors fully for the risk of the debt. Consequently, the bank may have access to relatively cheap debt funding and can reduce its total funding costs by substituting equity with debt.
The explicit part of the guarantee is a deposit insurance, implemented in order to protect depositors in full, or in part, from losses caused by a bank’s inability to pay its debt when due. The Norwegian Banks Guarantee Fund cover deposits in all banks with a head office in Norway up to a total amount of two million Norwegian kroner (Bankenes Sikringsfond, 2013). The implicit part stems from governments’ inclinations to save a bank in distress rather than letting the bank fail. Crises in large and interconnected banks usually occur when the economy is in or heading into a recession. Closures of such banks will enhance the economic downturn and is thus something governments will try to avoid. Several banking crises have therefore been resolved by giving banks considered “too big to fail” direct government support. During Norway’s banking crisis in the beginning of the 1990s, government capital was injected into failed banks and the existing share capital was written down. In cases where the losses exceeded the existing share capital, the entire capital was written down to zero so that no creditors suffered losses. As creditors might expect the same type of policy response from the government in the future, large banks have gained an implicit guarantee for all its debt (Moe & Vale, 2012).
With the debt guarantee in place, creditors do not have full incentives to monitor the bank and may not require an adequate risk-adjusted return. The banks have thus access to relatively cheap debt funding as long as the guarantor does not require the bank to pay an actuarially fair premium for the guarantee. If the bank either pays a zero premium for the guarantee or a flat premium independent of risk, the guarantee can be considered a subsidy to the banks’ owners. Merton (1977) shows that the value of this subsidy can be considered a put option. The value of this put option increases with the level of guaranteed debt and the volatility in total assets. Hence, if a bank either pays a zero or a flat premium, higher debt will increase the value of the subsidy. The existence of such a subsidy might therefore be one reason why bank owners usually prefer low equity ratios in banks (Vale, 2011).
8
2.1.2 Effects of Taxes and Asymmetric Information
Having established that the existence of debt guarantees might cause bank owners to have a preference for low equity ratios rather than high equity ratios, one cannot rule out that other factors might also affect banks’ preferences for a special capital structure. The tax treatment of debt and asymmetric information has implications for the validity of MM.
As for all firms, interest paid by banks on debt is tax-deductible, while dividend payments on equity are not. This feature of the taxation system reduces the cost of debt relative to equity. Other things being equal, a bank can therefore reduce its funding costs by issuing more debt. However, there are different opinions on the tax benefit of debt. In order to determine the actual value of the tax benefit a bank must take into account the taxes at the investor level. Differences in the tax rate on interest income and capital gains from equity have the potential to offset some of the tax advantage from debt. In particular, if the interest income is taxed more heavily than capital gains from equity, the value of the actual tax benefit is reduced (Berk & DeMarzo, 2011). This does not, however, apply for the Norwegian taxation system. The dividend taxation, introduced in 2006, implies that capital is taxed more heavily than debt. The Norwegian taxation system does consequently favour debt (Bøhren, 2013).
In addition to the tax treatment of debt, asymmetric information may cause bank owners to have preferences for high debt ratios rather than high equity ratios. Asymmetric information occurs when one party has more and better information than the other party. Informational asymmetries may be especially severe in banks and cause agency problems. The management’s information on strategy and operational activities is likely to be superior of that of the owners. Regulations make it difficult to own more than ten percent of a bank, which means that the distance between ownership and daily control may be large in banks (NOU 2012:2). Moreover, banks’ assets are highly liquid and therefore readily marketable. This means that bank owners are better served with high debt ratios. The reason for this is that creditors might be more effective in imposing discipline on bank owners. Small and uncoordinated owners are ineffective in putting pressure on managers to generate cash flows (Bøhren, 2013).
2.1.3 Effects of Costs Associated With Bankruptcy and Financial Distress
The existence of a debt guarantee, distortionary taxes and asymmetric information may be reasons why bank owners usually prefer low equity ratios. However, not everything about banks points towards debt. Costs associated with bankruptcy and financial distress occur
9 when a bank is expected to have difficulty in meeting its debt obligations and increase as the equity ratio declines. Theories like the “trade-off” theory therefore suggest that a bank must balance the benefits and costs of increasing debt level (Berk & DeMarzo, 2011).
Expected costs of financial distress and bankruptcy are likely to be especially high in the banking industry since it is a highly leveraged industry. The sale of bank loans are, for example, expected to happen at a lower price than the fundamental value because the buyers are less-informed about the quality of the loans. Also, the administrative costs related to bankruptcy are substantial for a bank. However, due to the effects of the debt guarantee, bank owners bear a smaller share of the expected financial distress and bankruptcy costs compared to other industries (Finanstilsynet, 2011).
2.2 Capital Adjustments
In the preceding subsections we have considered factors that make equity capital more expensive to banks than debt finance on an ongoing basis, no matter how the equity comes to be on the balance sheet. Information asymmetries may affect the way banks choose to raise equity or make adjustments to its equity ratios. As pointed out by Kashyap, Stein and Hanson (2010), a bank may be reluctant to raise equity in the market.
A bank that seeks to increase its equity ratio has a number of options available. One set of strategies relates to the numerator of the equity ratio. A bank can increase the numerator by issuing new equity in the market or accumulate equity over time via retained earnings. Issuing equity in the market is likely to be the less-attractive option because the bank can often become subject to frictions in that market. New share issues tend to reduce the market value of the existing bank owners’ shares. Myers and Majluf (1984) provide a theoretical explanation for this phenomenon. The management’s information about the true value of a firm is likely to be superior of that of outside investors. If the management acts on behalf of the existing shareholders, then a choice to issue new shares will often be interpreted as a negative signal by outside investors. This is because the management will be more inclined to issue new shares in the market when the firm is currently overvalued as opposed to undervalued. There is a typical “lemons problem” in the equity market.3 Outside investors
3 Akerlof (1970) uses the market for used cars as an example of quality uncertainty. Lemon is a slang term for a
10 consider the firm is overvalued and are willing to pay less. Hence, the firm`s shares have to be sold at a discount in the issuance.4
This reasoning implies that the existing bank owners often will have a preference for increasing equity through retained earnings rather than through issuing new equity. In order to accumulate equity via retained earnings, the bank can seek to decrease the share of profits it pays out in dividend or alternatively boost the profits itself. A way to do so is to increase the spread between the interest rate it charges on loans and the interest rate it pays on its funding. Competitive pressures can make it difficult for one single bank to widen these spreads, but the lending spreads could rise across the system if all banks followed a similar strategy. Reducing overall expenses would also increase the bank’s net income (Cohen, 2013).
Hence, the costs specifically associated with issuing new equity in the market can be avoided by an appropriate time period that allows banks to gradually accumulate equity through retained earnings. However, a bank that finds itself in an under- or overleveraged situation may also prefer a second set of strategies that involves changes to the asset side of the bank’s balance sheet, i.e. the denominator of the capital ratio. The bank can run down on its loan portfolio, or sell other assets, in order to raise its equity ratio. Furthermore, the bank can seek to reduce its risk-weighted assets, i.e. the denominator of the bank’s regulatory equity ratio. Banks are allowed to hold different levels of equity for various assets, based on those particular assets’ risk characteristics. Hence, by replacing riskier loans with safer ones, the bank can reduce its risk-weighted assets and consequently increase its regulatory equity ratio.
2.3 The Effects of Bank Capital Adjustments on the Real Economy
One important implication of what we have discussed in the preceding sections is that banks’ capital decisions are likely to weigh negatively on the demand and supply of credit when they seek to increase their equity ratios, and positively when they seek to decrease their equity ratios. Firstly, banks will often attempt to pass on higher costs to borrowers through higher loan rates. Hence, to the extent that it is more expensive to finance lending with equity than debt, an increase in banks’ capital ratio may dampen the credit demand. Secondly, banks’ choices from among the various strategies of capital adjustments will have implications for bank credit supply. For instance, if banks seek to reduce the quantity of their assets in order to increase their equity ratios, they may cut down on lending. Furthermore, instead of reducing
4 Related to our discussion of capital structure, this reasoning implies that firms may not be averse to hold high
11 the quantity, banks can also reshuffle their risk-weighted assets by substituting risker loans for safer. This may reduce the supply of credit to certain sectors, such as to firms (Norges Bank, 2013). To the extent firms and households are dependent on banks for credit, these capital decisions will have real economic effects.
Theories of financial intermediation investigate whether there are substitutes for bank loans in the financial marketplace, and at what price, and for which sectors these substitute products are available. These theories place a special emphasis on the effects arising from the information problems facing financial markets.5 Borrowers know more about their use of a loan and their ability to repay than potential lenders. This asymmetric information causes borrowers with better information to use this advantage at the expense of the less-informed lenders. If not controlled, the problems can cause financial markets to function inefficiently and borrowers may find it difficult to obtain financing.
To reduce the problems of asymmetric information, the lender must be able to adequately monitor the borrower, or the borrower must be able to differentiate itself from other possible lower-rated borrowers. The information problems will therefore be less severe for large listed firms that are regularly assessed by international credit-rating agencies and where there is a lot of public information available. Large firms may consequently be able to access open market credit or borrow from non-bank financial intermediaries or other sources (NOU 2000:9, 2000).
Households, and small and medium-size businesses, which are more affected by asymmetric information, rely on banks for credit. Banks are able to reduce the problems of information asymmetry because they have an information advantage in judging borrowers’ quality and creditworthiness. This advantage is in part due to the stable long-term relationships that often occur between banks and their clients, which provide banks with the ability to collect intensive information on their borrowers. It is also argued that the important role banks play in the payments system give them more insight into the creditworthiness of potential and existing clients than other financial intermediaries (NOU 2000:9, 2000). Since households and small and medium-size businesses have no access to alternative finance at all, or only at prohibitive costs, the supply of loans by banks is not perfectly substitutable for other funding.
5
The theories of financial intermediation do also place emphasis on the existence of transaction costs. These costs arise due to different preferences of borrowers and lenders with respect to liquidity, denomination, maturity and other parameters of loans. Financial intermediaries reduce these costs.
12
3. Bank Capital Regulation
The banking system is among the most regulated sectors in the economy. In this section we describe the primary consideration for bank regulation and review the different regulatory frameworks imposed on the banking industry during our sample period.
3.1 The Rationale for Bank Regulation
Banking regulation, in the broadest sense, is justified on the basis of preserving stability in the financial system (Norges Bank, 2004). A well-function financial market is crucial for all other economic activities in a market-based economy. One of the primary functions to the financial system is capital intermediation. That is to transfer resources from savers to investors. Capital intermediation often takes the form of providing credit, which is the key to economic growth. New businesses cannot start without credit, and existing businesses cannot expand without it. Because banks are the primary provider of credit, crisis in the financial system impacts the supply of credit to the broader economy and in turn economic growth. Instability in the financial system will also impede banks ability to perform its other socially useful activities, which the distribution of risk and the provision of a system for payments (Allen, 2013).
3.1.1 Basis of Micro-‐Prudential Regulation
Banks’ clients place deposits and buy products based on the notion that banks manage their funds in a responsible manner. However, individual depositors lack the tools to monitor banks adequately and the hence information to judge the safety and soundness of banks. Not only do the depositors lack the information and tools to assess bank risk, they also lack the incentives to do so as their deposits have become implicitly, or explicitly, insured and guaranteed. The depositors will only focus on expected return and put their deposits into banks providing them with the highest deposit interest rate. The insurance premium banks pay for the deposit guarantee does not reflect their relative riskiness. The result is therefore under-pricing of risk, which may potentially lead bank owners and managers to take on more risk than they otherwise would have done. One important purpose of micro-prudential bank regulation is therefore to protect the interests of small and uninformed investors (Norges Bank, 2004).
Micro-prudential regulation seeks to enhance the safety and soundness of individual banks. However, while banks may appear to be solid individually, the banking system as a whole may be vulnerable. Banking regulation must therefore include a macro-prudential perspective that focuses on the sources of systemic risk.
13
3.1.2 Basis of Macro-‐Prudential Regulation
Systemic risk involves the risk that the financial system is no longer capable of performing its tasks in a satisfactory manner.This type of risk can be derived from financial imbalances that build up over time or transmission effects between institutions. In other words, systemic risk has both a time and cross-sectional dimension.
The time dimension relates to the interactions between the financial system and the real economy. The dynamics of the financial system and real economy may reinforce each other over the economic cycle. When asset prices are increasing, credit risk may be perceived as low. Credit growth may then rise and contribute to even higher asset prices. Mutually reinforcing increases in credit and asset prices cumulate in a bubble that reaches its bursting point. The systemic risk increases with the debt-ratios, both within and outside the financial system. As the economic cycle turns, previously unseen risks may materialise and the willingness to take risk may decline, increasing the amplitude of the boom (Caruana, 2010).
The cross-sectional dimension of systemic risk focuses on the distribution of risk in the financial system at a given point in time. It relates to how a may shock increase widely and become systemic through direct and indirect linkages across institutions. Banks are directly exposed to one another, for instance, through settlement and interbank linkages. A shock hitting one bank can therefore easily spread and inflict losses on other institutions that are connected to it (Caruana, 2010). Banks may also share common exposures outside the banking system. Shocks to the financial system or adverse macroeconomic developments may therefore cause banks to suffer substantial losses indirectly. Systemic risk that arises through indirect linkages often becomes evident during a financial crisis. Banks may be forced to sell off assets. The value of these assets will then fall and weaken the balance sheets of other banks holding the same type assets (Olsen, 2013).
Unless each institution internalizes the costs of systemic risk, these institutions will have incentives to take risks that are not just borne by the individual institution, but instead by the society as a whole. Macro-prudential regulation aims to dampen the buildup of systemic risk by introducing instruments that force banks to internalize the costs imposed in the system. (Acharya, 2011). The macro perspective of banking regulation is relatively new. Frameworks for macro-prudential regulation are now being established in a number of countries for the first time (Olsen, 2013).
14
3.2 Capital Adequacy Requirements and the Basel Accords
Norwegian commercial banks have been subject to capital adequacy regulations since the law on “aktiebanker” in 1924. Originally, banks were required to hold a minimum level of 10 percent capital of their total assets. However, from the beginning of the 1960s to the end of 1980s a liberalization of the capital adequacy regulations took place. Both the minimum requirements and the quality of banks’ capital were reduced. The liberalization contributed to a strong growth in credit and house prices, which ended in a banking crisis and a severe economic downturn in the early 1990s (Finanstilsynet, 2013a).
Lessons learned from the banking crisis have played an important role in the development of Norwegian capital adequacy regulations since the beginning of the 1990s. At the same time, the development has been towards greater international harmonization. In 1988 the Basel Committee on Banking Supervision proposed the first guidelines for a regulatory framework based on uniform guidelines. Within a few years, the new capital standards were incorporated into the national regulation of, among others, countries of the European Union (EU). In Norway, the framework is implemented through EU legislation. The EEA-agreement6 that entered into force in 1994 commits Norway to adopt European Union rules.
3.2.1 Basel I
The aim of the Basel I proposals from 1988 was to preserve stability in the international banking system through harmonized and more stringent rules on capital adequacy. The framework introduced two new concepts: risk-weighted assets and tiers of capital. These concepts account for the fact that not all assets are equally risky and not all types of capital are equally capable of absorbing losses.
3.2.1.1 Risk-‐Weighted Assets
In a regulatory capital context, requirements are set in relation to the riskiness of assets rather than just the assets themselves. The Basel I accord defined risk weights for different categories of assets and off-balance sheet exposures7. The risk weights aim to measure the credit risk associated with a particular category of assets. Credit risk is the risk of losses due to the failure of a bank borrower or counterparty to meets its obligations. More risky categories are assigned a higher weight. In order to get the risk-weighted assets, which is the
6 EEA = European Economic Area
15 denominator of a bank’s regulatory capital ratio, one multiplies these risk weights with the corresponding assets and adds these values together,
𝑅𝑖𝑠𝑘−𝑊𝑒𝑖𝑔ℎ𝑡𝑒𝑑 𝐴𝑠𝑠𝑒𝑡𝑠! = !𝑎𝑠𝑠𝑒𝑡!,!∙𝑟𝑖𝑠𝑘 𝑤𝑒𝑖𝑔ℎ𝑡!.
Thus, the more risky assets a bank holds, the more capital it is required to hold. Under Basel I the risk weight for residential mortgages was 50 percent, while the weight for commercial loans was set to 100 percent. In 1996, the Basel Committee refined the framework to also address market risk, i.e. the risk of losses due to changes in market prices, such as equity prices, interest or exchange rates (Federal Reserve , 2003).
3.2.1.2 Tiers of Capital
Just as all assets are not equally risky, all types of capital are not equally capable of absorbing unexpected losses. The Basel Committee therefore defined capital for regulatory purposes in two tiers. The key element of capital, or the capital of the highest quality, is common equity Tier 1.8 It consists of common equity after regulatory capital detections. Intangible assets, such as goodwill and deferred taxes are some of the most important capital detections. Supplementary Tier 2 capital consists of subordinated debt and other debt and equity instruments that can be used to cover unexpected losses. Together, the Tier 1 and Tier 2 capital constitutes banks’ total capital base. The minimum requirement to the total capital base was set to 8 percent of the value of its risk-weighted assets. The Basel Accord also required a bank’s capital base to consist of at least 50 percent common equity Tier 1 capital (BCBS, 1988).
3.2.1.3 Criticism of Basel I
Basel I was an important step forward for banking regulation, but proved to be too simple to address the activities for the most complex banking organizations. The main criticism was directed at the limited differentiations among degrees of risk. Basel I defined only four broad risk weightings, for example, 100 percent for commercial loans. However, assets assigned the same risk weight could vary greatly in credit quality. This means that the calculated capital ratios often were uninformative and gave misleading information on a bank’s capital adequacy relative to its risk (Federal Reserve , 2003). Furthermore, the limited differentiation among degrees of risk enabled banks with a high appetite for risk to shift their loan portfolio
8
Common equity Tier 1 was originally only referred to as Tier 1 capital. However, under Basel II the definition of Tier 1 was expanded to also include subordinated debt. Common equity Tier 1 is today referred to as CET1. We return to this in the section on Basel II.
16 towards high-risk borrowers, and boost their profits in the short run, without this resulting in more stringent requirements. By the end of the 1990s, Basel I was seen as having outlived its usefulness (Finanstilsynet, 2013a).
3.2.2 Basel II
In response to the criticism of Basel I, the Basel Committee decided in 1999 to propose a new, more comprehensive capital standard. Basel II entered into force in 2007 and is built on three mutually reinforcing elements, or “pillars”.
3.2.2.1 The Pillars
The first pillar addresses the minimum capital requirements. The minimum required Tier 1 and total capital ratio did not change from Basel I.9 However, Basel II made substantial changes to the methodologies for determining a bank’s risk-weighted assets in order to make the minimum capital requirements more sensitive to the bank’s risk profile. While Basel I offered a single approach for determining required capital to cover credit risk, Basel II offered banks a choice between the standardised approach and the internal ratings-based (IRB) approach. The standardised approach is similar to Basel I in that the capital requirement is determined by categorising and weighing a bank’s assets according to fixed risk weights set by the regulator. However, Basel II introduced more risk weights and the use of external credit rating to evaluate corporate risk exposures. The IRB approach encourages banks to create their own internal system to calculate the required capital to cover credit risk. Under the IRB approach each bank must evaluate its assets in terms of the most important elements of credit risk. These elements are probability of default during a given period, the likely size of the loss given default, the amount of exposure at default, and the effective maturity of the exposure. IRB banks use a formula stated by the regulator to calculate the risk weights. The formula is a function of the elements of credit risk. In addition to the modified treatment of credit risk, Basel II introduced capital requirements for operational risk to adequately guard against failure in internal processes, the decision-making of individuals, systems, and other external events (Federal Reserve , 2003).
The second pillar addresses supervisory oversight. It requires banks to make a comprehensive assessment for themselves of the whole spectrum of risk they might face, including those not captured in Pillar 1. It promotes the notion that banks should seek to perform for themselves a comprehensive assessment of whether they have sufficient capital to support their risk profile,
17 rather than simple compliance with minimum capital requirements. Furthermore, Pillar II gives supervisors discretion to create a buffer capital requirement over the minimum requirement as calculated in Pillar 1, if banks are seen to be avoiding the capital adequacy goals of the Basel Accord.
The third pillar is designed to increase market discipline by requiring banks to publicly disclose information on their risk management and risk distribution. This information includes statistics on the aggregate amounts of Tier 1 and Tier 2 capital, risk-weighted capital ratios, market and operational risk.
3.2.2.2 Criticism of Basel II
An important criticism of Basel II is its possible pro-cyclical effect on economic activity. Under the IRB approach, capital requirements are an increasing function of the banks estimates of the probabilities of default, and losses, given default of their loans and other assets. These inputs are likely to be higher in downturns and lower in upturns. Thus, during an economic downturn banks may fall under the required regulatory capital, which may induce them to contract the supply of credit, thereby amplifying the economic cycle. Conversely, during an economic upturn the decrease in capital requirements may induce banks to expand the supply of credit, which may fuel a credit-led boom (Andersen, 2009).
The determination of capital requirements under Basel II has been subject to further criticism. The IRB approach provided banks with incentives to improve their risk management because banks eligible for this approach could expect lower capital requirements than those who used the standardised approach. One important precondition was, however, that Basel II not should cause the aggregate level of regulatory capital in the banking system to decrease significantly. Supervisory oversight and a sounder basis for market discipline were intended to prevent this. Nevertheless, the transition from Basel I to Basel II led to a marked decline in capital requirements for large banks. Since the average risk weights under Basel II have declined, the difference between reported capital adequacy ratios and unweighted capital ratios have increased (Syvertsen, 2012).
The financial crisis that took hold of financial markets around the globe in 2007-2008 revealed weaknesses in the approach that had been developed under Basel II. Banks’ capital adequacy was not sufficient to cover the losses that occurred. Basel II did not adequately anticipate sources of risk, such as a collapse in market liquidity or deep losses in the market value of securities held by banks. The crisis also showed the need to address systemwide risk
18 that can build up across banks as well as the pro-cyclical amplifications of these risks over time. In the light of the experiences, the Basel Committee put forward new recommendations on stricter capital regulations in 2010 (BCBS, 2010).
3.2.3 Basel III and CRD IV
In Europe, the Basel III standard is reflected in the new Capital Requirements Directive IV (CRD IV). This will apply to Norway under the EEA agreement. The phase-in started summer of 2013 and will continue until summer of 2016. CRD IV contains new rules that increase the quality and quantity of a bank’s capital. The minimum required total capital ratio will still be 8 percent, but a larger proportion of this has to be of the highest-quality capital – CET1. This proportion must be at least 4.5 percent of the risk-weighted assets, while Tier 1 capital must be at least 6 percent. Tier 1 capital includes certain forms for hybrid-capital. The aim of increasing the requirements for capital of highest quality is to bring banks’ loss-absorbing capacity more in line with their actual risk(European Commission, 2013).
The new regulatory framework introduces additional capital buffers that banks are required to hold on top of the minimum capital requirements. The capital conservation buffer must consist of 2.5 percent CET1 capital and is, as the name indicates, intended to conserve capital. CRD IV also introduces a systemic risk buffer in order to prevent and mitigate long-term systemic or macroprudential risks. Currently, Norwegian banks must hold a systemic risk buffer of 2 percent CET1, but the buffer requirement will increase to 3 percent in July 2016. On top of that, systemically important banks must hold a buffer of 1 percent. This requirement will increase to 2 percent in July 2016. Failure to meet the capital buffer requirements will imply constraints on distributions on dividends and repurchase of its own shares. The conservation buffer and capital buffers for systemic risk and systemic importance will be permanent add-ons.
3.2.3.1 Countercyclical Capital Buffer
Another key element, proposed in Basel III and reflected in CRD IV, is the countercyclical capital buffer. The aim of the countercyclical capital buffer is to strengthen banks’ resilience to an economic downturn and to counter the pro-cyclical effects of banks’ credit supply that may reinforce the economic cycle. It is a time-varying requirement and will normally be between zero and 2.5 percent of a bank’s risk-weighted assets. In economic upturns, when credit growth is high, the requirement will increase. This may increase banks’ funding costs and consequently reduce their supply of credit. When the economic cycle turns, the
19 requirement may be released in order to allow banks to draw on the capital buffer in the event of large losses. This may induce banks to reduce their lending less than they otherwise would have done (European Commission, 2013).
Norges Bank will provide The Norwegian Ministry of Finance with advice on the level of the countercyclical buffer. The setting is going to be explained and announced four times a year. Based on the purpose of the countercyclical buffer, Norges Bank has formulated three criteria for setting the appropriate buffer rate:
1) “Banks should become more resilient during an upturn.”
2) “The size of the buffer must also be viewed in the light of other requirements applying to banks.”
3) “Stress in the financial system should be alleviated.”
Norges Bank`s advice on the buffer rate will primarily be based on four key indicators, found useful in theoretical and empirical literature in signaling the buildup of financial imbalances. The indicators are as follows:
a) The ratio of total credit10 to mainland GDP.
b) The ratio of house prices to household disposable income. c) Commercial property prices.
d) The wholesale funding ratio of Norwegian credit institutions.
As the basis of its advice, Norges Bank will perform comprehensive assessments of the development in these indicators and compare historical trends and averages to the current situation (Norges Bank, 2013).
20
4. Defining a Bank Capital Target
Debt guarantees, distortionary taxes and asymmetric information cause bank owners to have a preference for low equity ratios. Indeed, based on traditional moral hazard theory, several theoretical models on bank capital structure therefore predict that banks want to hold less capital than what is required by the regulatory authorities (Keeley, 1990; Marshall & Prescott, 2000). These predictions imply that a bank will set its capital ratio at the lowest level permitted by capital regulations. Moreover, they suggests that there should be little variation in capital levels across banks and over time, since the Basel regulatory regime prescribes a uniform capital ratio. However, banks’ balance sheets displays a large variation in capital ratios, well in excess of the minimum required. In the following we extend our discussion in section 2 and provide some possible explanations to the observed capital levels among banks. Furthermore, we propose a simple derivation of a model that shows us that a profit-maximising bank’s choice of capital level can be understood as an adjustment cost story with costs/benefits to deviate from an optimal level.
4.1 What Do We Know About Banks` Target Capital?
Academic studies argue that banks hold capital in excess of the regulatory minimum in order to reduce the likelihood of a regulatory intervention or the need to raise capital or reduce assets at short notice (Lindquist, 2003; Stolz & Wedow, 2005; Berger, DeYoung, Flannery, Lee, & Öztekin, 2008). When a bank experiences an unexpected decrease in its capital ratio, close to or below the required minimum, the bank become subject to supervisory intervention, which in turn implies costs that decrease the value of the bank. Furthermore, adjustments to the capital ratio bear both direct and indirect costs, i.e. issuing new shares may be interpreted as a signal that the shares are overvalued. Hence, excess capital may act as an insurance that lower failure costs due to a decrease in the probability of failure. As Lindquist (2003) points out, the price and the value of this insurance are likely to affect the level of capital held by banks. The price will affect capital negatively. The value of the insurance depends on the risk embedded in the bank’s assets, i.e. the probability of experiencing unexpected losses, and should vary positively with capital.
A high capital ratio may also be interpreted as a signal of the bank’s low probability of failure and work as an instrument, which the bank is willing to pay for in the competition for uninsured deposits and money market funding (Lindquist, 2003). Uninsured depositors compensate for bank risk by demanding a higher return. A bank may therefore have
21 incentives to reduce its risk and hence the costs of funding by holding relatively high capital ratios. The relevance of this argument depends on the extent of the governmental debt guarantee, the bank’s share of uninsured liabilities and how well the creditors are the able to observe the bank’s risk behaviour. Thus, the first factor reduces the banks incentives to hold excess capital, but the other factors encourage it to limit the risk of insolvency by increasing the capital ratio (Tabak, Noronha, & Cajueiro, 2011). Furthermore, a well-capitalized bank may be in a better position to obtain funds quickly. As argued by Jokipii and Milne (2008), this may improve a bank’s ability to exploit unexpected investment opportunities. In the case of a sudden increase in loan demand, a poorly capitalized bank with difficulties in raising capital and additional funds on a very short notice may lose market share to its well-capitalized competitors.
Alfton et al. (2005) argue that larger banks may be less liquidity-constrained and have smaller costs in adjusting their capital ratios. Hence, there may be a negative relationship between bank size and capital as large banks can issue more capital and debt on demand rather than holding substantial amounts of excess capital. This negative relationship may also have alternative explanations. Unexpected losses may be due to information asymmetries in the lender-borrower relationship. As argued by Lindquist (2003), the risk-management techniques of large banks may be more developed than those of smaller banks. Economies of scale in screening and monitoring borrowers provide large banks with advantages in measuring risk involved in each project they lend money to. Thus, they require less capital as insurance against failure. Moreover, if portfolio diversification increases with bank size, larger banks are likely to face a lower probability of experiencing a large drop in the capital ratio. Another argument for the negative size effect is related to the “too-big-to-fail” hypothesis. There is a higher probability that larger banks will be bailed out by the government in the case of financial distress, due to potential systemic effects. Hence, if this kind of support is not expected to the same extent by small banks, large banks are likely to target a relatively lower capital ratio.
4.2 A Model of Capital Adjustment
A profit-maximizing bank may want to reach a target capital ratio. If the bank is over-capitalized, i.e. holds a higher capital ratio than its target, the bank faces an opportunity cost. It can reduce its total funding costs by reducing its capital level because equity is more expensive than debt. If the bank is under-capitalized, i.e. has a capital deficit with respect to its target, it may face both supervisory and market constraints. This translates into higher
22 uncertainty and higher interest on debt. The bank may thus have incentives to raise its equity levels.
However, as explained earlier, the bank also faces costs in adjusting its capital ratio. Profit-maximising banks will consequently try to minimize the sum of these two types of costs. A simple model of banks’ total costs related to capital adjustment can be considered in order to understand the key mechanism at stake. If we assume that the costs of deviations from target capital ratio and the costs of capita adjustments are both quadratic and additive, the banks’ total adjustments costs can be expressed as:
𝐶!,! =𝛼(𝑘!∗,!−𝑘!,!!!) !+𝛾(𝑘!,!−𝑘!,!!!)!, (2)
where 𝐶!,! is the total cost capital adjustments. The first term in equation 2 reflect costs
associated with deviations between the target capital ratio 𝑘!∗,! and the actual capital ratio 𝑘!,!!!. The weight on the costs of this deviation is captured by 𝛼. The second term reflects the costs of capital ratio adjustments, with the corresponding weight 𝛾. In order to minimize 𝐶! with respect to 𝑘!,!, we derive the first order condition:
𝜕𝑐!,!
𝜕𝑘!,! = 𝛼2(𝑘!∗,!−𝑘!,!!!) +𝛾2(𝑘!,!−𝑘!,!!!)= 0,
or
𝑘!,!−𝑘!,!!! = !!!! 𝑘!∗,!−𝑘!,!!! . (2)
Equation 2 is a partial adjustment equation in the case of a profit-maximising bank. In each period t, a bank i tries to close a proportion 𝛼 𝛼+𝛾 of the deviation between its target capital ratio at time t and its actual capital ratio in time t-1 (Dang, Garrett, & Nguyen, 2012). This proportion is often referred to as the adjustment speed, which increases with 𝛼 and decreases with 𝛾. That is to say, the higher weight on the costs associated with deviations from the target capital ratio, the faster the convergence towards the target capital ratio, and the higher weight on costs associated with capital adjustments, the slower convergence towards the target capital ratio.
23
5. Other Relevant Literature
This master thesis relates to the empirical literature on the determinants of optimal capital structure and how fast firms (banks) can adjust towards this optimal level. Using a partial adjustment model, a large stand of this literature indicates that firms do have entity-specific targets for their capital structures and speed of adjustments towards these. For instance, Flannery and Rangan (2006) find in their well-known study that a typical firm closes over 30 percent of the gap between its target and its actual debt ratio each year. Berger et al. (2008) focus on the capital structure of US banks and finds that they on average close between 28 percent and 41 percent of the gap between its actual and its desired capital ratio in one year. Further, that poorly capitalized banks tend to adjust their capital ratio more quickly than their better-capitalized competitors. Banks that record high volatility in their return on assets tend to have higher capital ratios. The authors also find that optimal capital structure depend on bank size. Smaller banks tend to have higher optimal capital ratios than larger institutions. In their study of German banks, Memmel and Rupach (2010) show that corporate banks as well as banks with a high share of liquid assets adjust to their capital level more quickly. The authors also find that the target capital ratio increases with asset volatility and decreases with the speed of adjustment. Brewer et al. (2008) studies capital ratios across countries by modeling capital structure as a function of important country-level public policy and bank regulatory characteristics, as well as of bank-specific variables and macroeconomic conditions. The results indicate that the bank-desired level of capital increases with risk. Banks maintain higher capital ratios in countries where the banking industry is relatively small and in countries with effective regulatory frameworks that prompt corrective actions and good corporate governance.
The papers mentioned above study the determinants and speed of adjustments towards optimal capital structures. Of similar importance is how banks adjust towards these. Maurin and Toivanen (2012) investigate how banks in the Euro area react to a deviation from their target capital ratio in terms of adjustments in their asset composition. Their results suggest that the adjustment towards the target has significant effect on banks’ assets. Moreover, the impact on the composition of security holdings is greater than the impact on the composition of loans. Kok and Schepens (2013) accounts for the fact that banks’ reaction may be asymmetric, depending on whether they are above or below their target. They find that European banks prefer to increase equity levels or reshuffle risk-weighted assets without making any real changes to the total assets when they are above their target Tier 1 capital
24 ratio. On the other hand, when below the target, banks prefer to reshuffle assets or increase their assets holding in order to adjust towards the target again.
Francis and Osborne (2009a) study how deviations from optimal capital levels affect the growth in different balance-sheet components, while especially focusing on the impact of bank-specific capital requirements. The authors find that banks with capital surplus tend to have higher growth in loans and other on- and off-balance sheet assets than those with capital shortfall. At the same time, they find that banks with capital surplus have lower growth in regulatory capital and Tier 1 capital. Based on these finding, they argue that tighter regulatory standards may have cost in terms of reduced loan supply.
Several other papers within this literature focus on how the target capital deviation affects lending. Hancock and Wilcox (1994) show that bank lending was restrained by capital shortfalls relative to internal targets during the 1990s. The authors indicate that some of the banks reduced lending to satisfy higher capital requirements implied by the introduction of Basel I. However, of similar importance, they find that the shortfall of bank capital below their own target level was a limiting factor on banks’ credit flow. Berrospide and Edge (2010) studied how the capital ratios of US banks impact the growth in their credit flow. They find that changes in bank capitalization have a very modest effect on bank lending. Their results suggest that factors like economic activity and perceived macroeconomic uncertainty play the most important role in determining total loan growth.
25
6. Data
We estimate our models by using quarterly panel data on Norwegian banks between 1993Q1 and 2013Q1. The data are provided by Norges Bank and has their origin in quarterly financial statements that all banks are obliged to report (ORBOF). We have access to data back to 1991Q1, but have chosen not to apply data before 1993Q1 due to the 1988-1992 banking crisis in Norway. During this period, banks’ capital was subject to large disturbances due to substantial loan losses and capital injections from the Government Bank Insurance Fund and other governmental programs (Vale, 2004). Including these years in our sample might distort our findings.
To adjust the data for mergers and acquisitions (M&A), we create a new bank after such events11. The motivation for creating a new bank is to capture the possible change in the unobserved heterogeneity of the acquiring bank. Bank-specific factors such as management, group of clients and the mix of markets in which the banks operate may be different in the post-merger period. Information provided by The Norwegian Saving Banks Association and Finance Norway (FNO) on the structural developments in the Norwegian banking industry was used to identify M&A activity.12 We further adjust for structural changes in banks that may not be captured by the identification of M&A activity by creating a new bank whenever both capital and assets fall or rise more than 50 percent.
We make adjustments to our dataset in order to reduce the influence of missing and extreme values. We exclude observations where total assets and risk-weighted assets are missing. This leads to a fall of 793 observations. The drop is mainly due to missing values of risk-weighted assets on Norwegian-registered foreign banks (NUFs), which are not obliged to report information of their capital adequacy. In addition we exclude observations where key variables to construct our explanatory variables are missing.
Extreme values will not add value to our analysis. Hence, variables that contain observations that with reasonable certainty can be deemed extreme, by investigating their distribution, are winsorized. Subtracting the 75% percentile value from the 25% percentile value, then adding this value to the median of the distribution provides us with the cutoff points. Observations outside this interval are excluded. Finally, we drop banks with less than 10 consecutive
11 Alternatively, we could include a dummy variable equal one for the acquirer in the quarter of the merger and
zero otherwise. However, by this approach we would assume that the unobserved idiosyncratic factors affecting banks optimal target to be the same in the post-merger period as in the pre-merger period.
12 Information on structural development and mergers, see The Norwegian Savings Banks Association (2013) for
26 observations for econometric purpose. This leaves us with an unbalanced panel with 8707 observations of 132 savings banks and 20 commercial banks. Data on macroeconomic indicators and central bank policy are provided by Statistics Norway (SSB). We do not make any adjustments to these data.
27
7. Empirical Strategy
In this section we present our empirical strategy. We describe the empirical approach we use to estimate banks’ implicit target capital ratios and to estimate and assess how they move towards these targets. Our approach draws on Francis and Osborne (2009a), and Kok and Schepens (2013). It involves three steps. In the first step we specify and estimate a partial adjustment model of bank capital. This step is justified by theory and empirical evidence that banks face rigidities and adjustment costs that may prevent them from making instantaneous capital adjustment. The model allows us to investigate banks-specific determinants of the implicit target capital ratios, and the speed with which they adjust towards them. In the second step we use the estimated parameters from this model to derive each bank’s long-run capital target and calculate the deviations from it in each period in time. Finally, we use the measure of these deviations to estimate models of capital and asset growth to assess how banks move towards their long-run target capital ratios.
7.1 Estimating the Bank Capital Targets
We begin our empirical analysis by estimating a model of the factors that govern banks capital choices. A bank’s capital ratio is likely to fluctuate around an unobserved target. At each time period t, the bank observes the deviation from its target at the end of period t-1 and takes action to close this gap during the next period t. Deviations from the target capital ratio impose some costs to the bank, for example, by increasing its funding costs. On the other hand, adjustments in the capital ratio may also be costly due to market frictions and asymmetric information. Banks more or less rapidly adjust towards their target depending on this cost-benefit analysis (Duprey & Lé, 2014). As we do not observe the capital ratio target, we have to approximate it. We estimate the target as a linear combination of some important factors affecting the capital ratio, bank-fixed effects and time-fixed effects. As suggested by the model (see equation 2) we estimate banks’ capital ratios in a partial adjustment framework.
𝑘!,!−𝑘!,!!! = 𝜆 𝑘!∗,!−𝑘
!,!!! (3)
Equation 3 is a partial adjustment model where 𝑘!,! denotes the capital ratio of bank i at time t and 𝑘!∗,! the corresponding target capital ratio. The model specifies that at each period t the
28 bank tries to close a proportion 𝜆13 of the deviation between the target capital ratio in period t and the actual capital ratio in t-1. In this symmetric partial adjustment model, the speed of adjustment is assumed to be identical across banks. In a frictionless world, a bank would always be able to maintain its target capital ratio at any point in time. In that case, 𝜆 would be equal to one. However, the positive cost of capital adjustment precludes immediate adjustments to a bank’s target capital ratio (Verbeek, 2012). A high 𝜆 would thus indicate substantial adjustments costs and a rather passive management of the capital ratio.
Assuming that the target capital ratio can be correctly approximated by some observable characteristics of banks, as well as by a bank-specific time invariant and unobserved component 𝜂! and a constant 𝛿!, we specify the target capital ratio as follows:
𝑘!∗,! =𝛿! + !!!!𝛽!𝑥!,!,!!!+𝜂!. (4) The target capital ratio depends on n observable and bank specific I factors x at time t-1. This makes sense because the change in the capital ratio occurring during the quarter t depends on the factors observed at the end of quarter t-1. By substituting equation (1) into equation (4), rearranging and adding a well-behaved error term 𝑢!,!, we obtain the partial adjustment model in its full form:
𝑘!,! =(1−𝜆)𝑘!,!!!+𝜆 𝛿!+ ! 𝛽!𝑥!,!,!!!
!!! +𝜂!)+𝑢!,!, (5)
Based on equation (5), our estimated specification of the partial adjustment model takes the following form:
𝑘!,!= 𝜋! + 𝜋!𝑘!,!!!+ !!!!𝜋!𝑥!,!,!!!+𝛼! +𝑢!,!, (6) where the 𝜋! is a constant term equal to 𝜆𝛿!, the parameter 𝜋! corresponds to (1−𝜆), and
𝜋! to 𝜋! represents the parameters of the vector 𝑥!,!,!!!, and is equal 𝜆𝛽! to 𝜆𝛽!. Finally, 𝛼! represent the bank-fixed effects and corresponds to 𝜆𝜂! in equation (5).
13
This proportion 𝜆 is equal to 𝛼 𝛼+𝛾 as defined in equation 2. Hence, 𝜆 increase with the weight on the costs associated with deviations from the target capital ratio (𝛼) and decrease with the weight on costs associated with capital adjustments.