Electroencephalography Brain Computer
Interface Using An Asynchronous Protocol
A dissertation submitted to the Faculty of Science, University of the Witwatersrand, in fulfillment of the
requirements for the degree of Master of Science. Phumlani R. Nhlanganiso Khoza
Supervised by: Benjamin Rosman, Hima Vadapalli, and Pravesh Ranchod. School of Computer Science and Applied Mathematics
The University of the Witwatersrand Johannesburg
Declaration
I declare that this project is my own, unaided work. It is being submitted as partial fulfilment of the Degree of Master of Science at the University of the Witwatersrand, Johannesburg. It has not been submitted before for any degree or examination in any other University.
Phumlani R. Nhlanganiso Khoza October 31, 2016
Abstract
Brain Computer Interface (BCI) technology is a promising new channel for communication between humans and computers, and consequently other humans. This technology has the potential to form the basis for a paradigm shift in communication for people with disabilities or neuro-degenerative ailments. The objective of this work is to create an asynchronous BCI that is based on a commercial-grade electroencephalography (EEG) sensor. The BCI is intended to allow a user of possibly low income means to issue control signals to a computer by using modulated cortical activation patterns as a control signal. The user achieves this modulation by performing a mental task such as imagining waving the left arm until the computer performs the action intended by the user. In our work, we make use of the Emotiv epoc headset to
perform the EEG measurements. We validate our models by assessing their performance when the experimental data is collected using clinical-grade EEG technology. We make use of a publicly available data-set in the validation phase.
We apply signal processing concepts to extract the power spectrum of each electrode from the EEG time-series data. In particular, we make use of the fast Fourier transform (FFT). Specific bands in the power spectra are used to construct a vector that represents an abstract state the brain is in at that particular moment. The selected bands are motivated by insights from neuroscience. The state vector is used in conjunction with a model that performs clas-sification. The exact purpose of the model is to associate the input data with an abstract classification result which can then used to select the appropriate set of instructions to be exe-cuted by the computer. In our work, we make use of probabilistic graphical models to perform this association.
The performance of two probabilistic graphical models is evaluated in this work. As a preliminary step, we perform classification on pre-segmented data and we assess the performance of the hidden conditional random fields (HCRF) model. The pre-segmented data has a trial structure such that each data file contains the power spectra measurements associated with only one mental task. The objective of the assessment is to determine how well the HCRF models the spatio-spectral and temporal relationships in the EEG data when mental tasks are performed in the aforementioned manner. In other words, the HCRF is to model the internal dynamics of the data corresponding to the mental task. The performance of the HCRF is assessed over three and four classes. We find that the HCRF can model the internal structure of the data corresponding to different mental tasks.
As the final step, we perform classification on continuous data that is not segmented and assess the performance of the latent dynamic conditional random fields (LDCRF). The LDCRF is used to perform sequence segmentation and labeling at each time-step so as to allow the program to determine which action should be taken at that moment. The sequence segmentation and labeling is the primary capability that we require in order to facilitate an asynchronous BCI protocol. The continuous data has a trial structure such that each data file contains the power spectra measurements associated with three different mental tasks. The mental tasks are randomly selected at 15 second intervals. The objective of the assessment is to determine how well the LDCRF models the spatio-spectral and temporal relationships in the EEG data, both within each mental task and in the transitions between mental tasks. The performance of the LDCRF is assessed over three classes for both the publicly available data and the data we obtained using the Emotiv epoc headset. We find that the LDCRF produces a true positive
publicly available data. On the data collected using the Emotivepoc, we find that the LDCRF
produces a true positive classification rate of 42.55% averaged over two subjects.
In the two assessments involving the LDCRF, the random classification strategy would produce a true positive classification rate of 33.34%. It is thus clear that our classification strategy provides above random performance on the two groups of data-sets. We conclude that our results indicate that creating low-cost EEG based BCI technology holds potential for future development. However, as discussed in the final chapter, further work on both the software and low-cost hardware aspects is required in order to improve the performance of the technology as it relates to the low-cost context.
Contents
1 Introduction 10
1 Problem Definition . . . 10
1.1 Importance of the Problem . . . 10
2 Proposed Solution . . . 11
2.1 Technical Prerequisites . . . 11
2.2 The Contribution of this Work . . . 12
3 Conclusion . . . 13
4 Organization of the Dissertation . . . 13
2 Theoretical Foundation 14 1 Introduction . . . 14
2 Neuroscience Theory . . . 14
2.1 Brain Anatomy and Physiology . . . 15
2.1.1 Anatomy of the Neuron . . . 17
2.1.2 Electrophysiology of the Neuron . . . 18
2.2 Computational Neuroscience . . . 19
2.2.1 Action Potential Modeling . . . 22
2.2.2 Pragmatic Considerations . . . 23
2.3 Electroencephalography . . . 24
2.3.1 Overview of EEG . . . 25
2.3.2 Manifestation of EEG . . . 26
2.3.3 EEG Measurement Standardization . . . 28
2.3.4 EEG Interpretation . . . 28
3 Signal Processing Theory . . . 30
3.1 Feature Vectors . . . 31
3.2 Frequency Decomposition . . . 32
3.2.1 Fourier Transform . . . 32
3.2.2 Fast Fourier Transform . . . 33
3.3 Signal Sampling . . . 33
3.3.1 Nyquist-Shannon Theorem . . . 34
3.3.2 Spectrogram Representation . . . 34
4 Machine Learning Theory . . . 36
4.1 Function Approximation and Classification Techniques . . . 36
4.1.1 Function Approximation Techniques . . . 37
4.1.2 Classification Techniques . . . 38
4.2 Motivation for Machine Learning Application . . . 40
4.3 Probabilistic Graphical Models . . . 40
4.3.2 Generative versus Discriminative Models . . . 42
4.3.3 Model Representation and Properties . . . 43
4.3.4 Model Parameter Estimation . . . 43
4.3.5 Model Querying and Inference . . . 44
5 Discussion and Conclusion . . . 45
3 Related Research 46 1 Introduction . . . 46
2 EEG Classification . . . 47
2.1 Synchronous EEG Classification Protocol . . . 47
2.2 Asynchronous EEG Classification Protocol . . . 50
3 Application Domains . . . 51
3.1 Text Input . . . 52
3.2 Rehabilitation and Robot Control . . . 54
4 Discussion and Conclusion . . . 56
4 Research Framework Overview 58 1 Introduction . . . 58
2 Research Motivation . . . 58
3 Research Hypothesis . . . 59
4 Research Methodology . . . 60
4.1 System Design and Development . . . 61
4.1.1 System Design Considerations . . . 61
4.1.2 System Components . . . 62
4.2 Data Collection . . . 68
4.3 System Performance Evaluation . . . 68
4.3.1 Command Inference . . . 69
4.3.2 Classification Performance Metric . . . 70
4.3.3 Control Performance Metric . . . 71
5 Experimental Equipment . . . 72
5.1 Experimental Equipment Limitations . . . 72
6 Discussion and Conclusion . . . 74
5 Investigation Procedure 75 1 Introduction . . . 75
2 Data Collection Methodologies . . . 75
2.1 Emotiv Headset Collected Data . . . 75
2.1.1 Phase 1: Training without control feedback . . . 76
2.1.2 Phase 2: Discontinuous task execution without control feedback 76 2.1.3 Phase 3: Continuous task execution without control feedback . . 77
2.2 BCI Competition Sourced Data . . . 78
2.2.1 Continuous task execution without control feedback . . . 78
3 Machine Learning Models . . . 79
3.1 Hidden Conditional Random Fields . . . 80
3.2 Latent Dynamic Conditional Random Fields . . . 82
4 Conclusion . . . 84
6 Results and Analysis 86 1 Introduction . . . 86
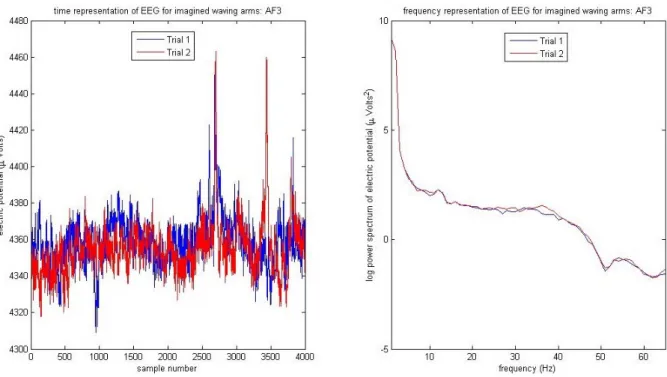
2.1 EEG Time Series . . . 86
2.2 Temporally Sequenced Spatio-Spectral Topographical Maps . . . 87
2.3 Temporal Classification Performance Plot . . . 87
2.4 Segmentation and Labeling Performance Plot . . . 88
2.5 Confusion Matrix . . . 88
3 Experiment Outcomes . . . 89
3.1 Data Irregularities . . . 89
3.2 Classification Results . . . 90
3.3 Sequence Segmentation and Labeling Results . . . 91
4 Analysis . . . 96
4.1 Neuroscience Correspondence . . . 96
4.1.1 Hardware Limitations . . . 97
4.1.2 Inter-day Variations . . . 98
4.1.3 Inter-subject Variations . . . 98
4.1.4 Control Feedback Effects . . . 100
4.2 Model Performance Analysis . . . 100
5 Discussion and Conclusion . . . 102
7 Research Conclusion 104 1 Research Findings Discussion . . . 105
1.1 Key Research Findings . . . 105
1.2 Unanticipated Outcomes . . . 106
1.3 Conclusion Concerning Performance . . . 106
2 Proposed Future Work . . . 107
2.1 Realtime Cortical Activation Visualization . . . 107
2.2 Automated Mental Task Selection . . . 107
2.3 Control Feedback Effect Assessment . . . 108
2.4 Minimal Montage and Channel Selection . . . 109
2.5 Unsupervised Feature Learning . . . 109
2.6 Intra-subject Hierarchical Command Inference . . . 110
2.7 Inter-session Intra-Subject Transfer Learning . . . 110
2.8 Inter-subject Transfer Learning . . . 111
3 Conclusion . . . 111
List of Figures
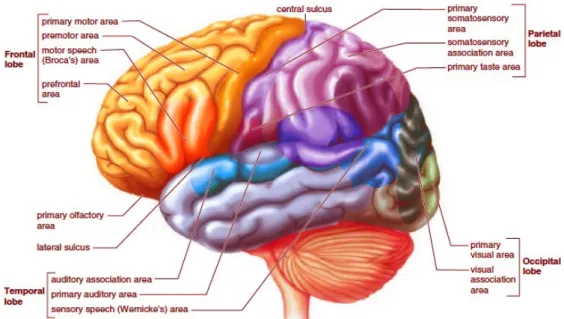
2.1 The cortical area function-demarcated model of the human brain. The labels indicate the function of the corresponding area. Varying amounts of neural tissue are dedicated to performing functions, as illustrated in the image. . . 15 2.2 Cortical homunculus model for neural-tissue-to-body-part mapping. Varying
amounts of neural tissue within a cortical region are dedicated to a particu-lar body part. The spatial distribution of the tissue has a direct influence on the measurement of EEG activity corresponding to a particular region. . . 17 2.3 Schematics of biological neurons. Cell bodies that contain the nucleus are
de-picted using black bulbous dots. The long projections emanating from the cell body represent the axon of the neuron that transmits the action potential of that neuron to other neurons it is connected to. The short projections represent the dendrites of the neuron that receive action potentials from other neurons connected to it. . . 18 2.4 Measurement of neuron potential difference. Depending on the stimulation
in-duced on a neuron that has synaptic coupling with another neuron, a measurable change in the potential difference is produced between two spatially separated locations in the receiving neuron. Charge is a conserved quantity, so the spa-tial distribution of the potenspa-tial difference has to reflect the conservation. In the image, the potential differences are measured with respect to ground at t-wo locations and differences in the plotted profiles illustrates the conservation of charge. . . 19 2.5 Neuro-transmiter mediated inter-neuron electric action potential transfer. The
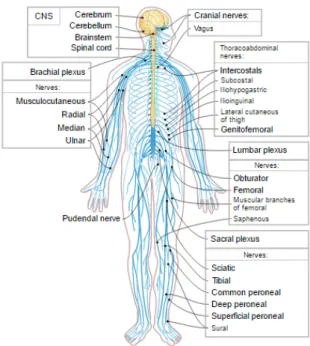
axon terminal is connected to the neuron that is the source of the action potential. The recipient of the action potential is neuron with the dendritic extension. . . . 20 2.6 Schematic depicting long-range information processing in the nervous system.
Not all nerves are directly connected to the brain with a single long-range con-nection. The spinal cord provides the relay mechanism that transmits action potentials to and from the brain. Concerning motor function, the connection that emanates from the brain terminates at a corresponding muscle. Concerning sensory function, the connections that emanate from sensory units such as tactile sensors on the skin terminate in the brain. . . 21 2.7 Schematic of the Hodgkin-Huxley model for action single neuron action potential.
The model is based on biophysical modeling with certain physical attributes of a neuron represented by an electrical circuit that performs an analogous role in an electrical circuit. . . 22
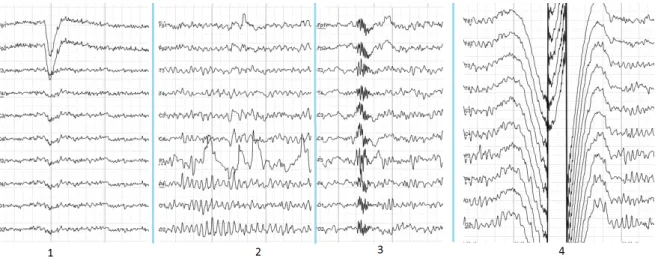
2.8 The samples of main types of artifacts in human EEG. 1 - Electrooculographic artifact caused by the excitation of eyeball’s muscles. 2 - Electrode’s artifact caused by bad contact between P3 electrode and skin. 3 - Swallowing artifact. 4 - Common reference electrode’s artifact caused by bad contact between reference
electrode and skin. . . 26
2.9 EEG signal decomposition into primary EEG bands. The frequency decomposi-tions of the EEG signal represent the current categorization scheme. All except the gamma waves have been attributed to specific brain activiy. . . 27
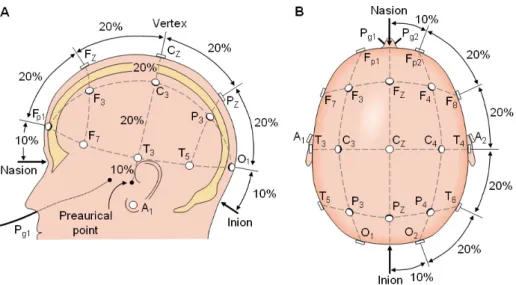
2.10 General montage template using the 10-20 electrode placement system. The topographical layout of the nodes is intended to provide full coverage on the scalp. 29 2.11 Illustration of the proportion marked 10-20 electrode placement system. The relative demarcation is designed such that differences in head sizes have a minimal influence on inter-subject comparative measurements. . . 30
2.12 Illustration of the effect of the time-to-frequency domain transformation of a signal. 31 2.13 Illustration of the decomposition of a signal into its constituent signals. Points of similarity or dissimilarity are easily identifiable in the frequency domain. . . . 32
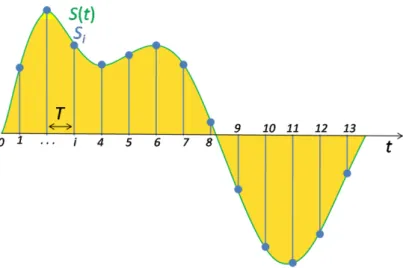
2.14 Discrete sampling of a continuous signal, the sampling rate is usually a fixed value during sampling. The sampling rate determines how many samples are measured within a given time interval, the higher the sampling rate, the better the signal is approximated. . . 35
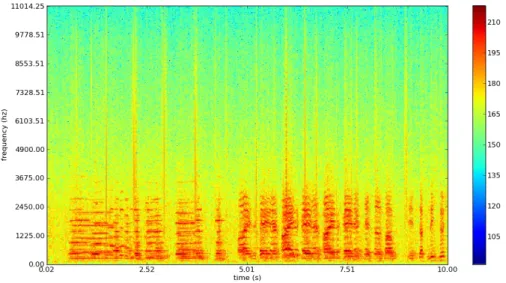
2.15 Graphical representation of a signal spectrogram. Along the vertical axis are frequency values, along the horizontal axis is time, and the colour bar represents the magnitude of the frequency component. With the three pieces of information it is possible to visualize the temporal evolution of the frequency components. . . 36
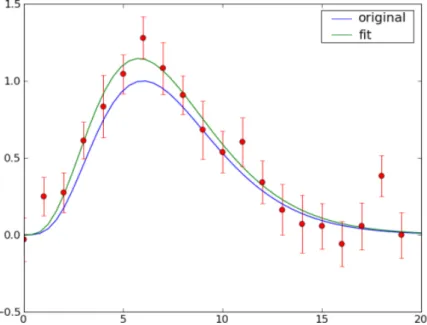
2.16 Function approximation with noisy data. The vertical lines on the data points represent error or variation in the measurement. . . 37
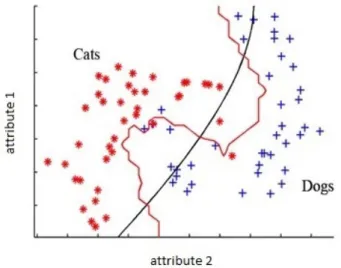
2.17 Two class animal classification with a decision boundary between the sets. . . 39
2.18 Graphical illustration of the structure of probabilistic graphical models. . . 42
2.19 Bayesian and Markov probabilistic graphical models. . . 43
2.20 Probabilistic graphical model and associated disjoint conditional probability dis-tributions. . . 44
3.1 Orthosis position actuation. . . 55
4.1 System design schematic with signal acquisition for on-line mode data-flow. . . . 62
4.2 System design schematic for off-line mode data-flow. . . 63
4.3 Device status monitor GUI depicting device status information. . . 64
4.4 Classifier GUI depicting model classification and command inference results. . . . 65
4.5 Text input GUI with predictive text functionality. . . 67
4.6 Temporal classification performance visualization tool. . . 68
4.7 Snap-shot of temporally-sequenced spatio-spectral topographic maps. The row labels in the image represent mental tasks, and the column labels represent fre-quency bins that are spaced in 2Hz intervals from 2Hz to 26Hz. . . 69
4.8 Control model as defined on the text input interface. . . 70
4.9 Emotivepoc EEG headset. . . 73
5.1 The evaluated discriminative probabilistic graphical models have blue labels. The CRF is shown for comparison purposes, and both the HCRF and LDCRF have been used in the experiments. . . 80
6.1 Emotiv EEG time series visualization program snap-shot. . . 87 6.2 Confusion matrix results for sub2 corresponding to row two in Table 6.1. . . 89 6.3 Effect of sampling rate and contact quality variations on the EEG measurements.
Variations of this kind can be three orders of magnitude higher than the normal EEG activity, and negatively influence the classification performance of the models. 90 6.4 Confusion matrix results obtained using sub1 test data. The LDCRF doesn’t
perform well on the word generation mental task. The motor-imagery tasks appear to be discriminable, and the structure they encode has been learnt by the LDCRF. . . 92 6.5 Temporal classification performance on Emotiv data for sub1. The plot represents
the results obtained from the test data. The results obtained from sub2 are similar in form. The misalignment in the inferred and actual class labels indicated misclassification. . . 93 6.6 Confusion matrix results obtained using subj2 test data. The results indicate
that both the first and third mental tasks are inferred with 100% accuracy when the actual class label coincides with any of those classes. Using Figure 6.7, it is clear that the classification error observed with the second mental task results is due only to the first two clusters in the data, beyond that the LDCRF produces error-free classification performance. . . 94 6.7 Temporal classification performance on BCI Competition data for subj2. The
plot represents the results obtained from the test data. The misalignment in the inferred and actual class labels indicated misclassification . . . 94 6.8 Confusion matrix results obtained using subj3 test data. The results indicate
that the third mental task is inferred with 100% accuracy when the actual class label coincides with that class. A large proportion of the misclassification is attributable to the second mental task, in which the structure appears to not being learnt well by the LDCRF. . . 95 6.9 Temporal classification performance on BCI Competition data for subj3. The
plot represents the results obtained from the test data. The misalignment in the inferred and actual class labels indicated misclassification . . . 96 6.10 Temporal layout of classification results. The figure indicates that the model
consistently infers the same class label for almost all data samples. It should also be noted that only two of the total three classes are inferred throughout the whole process. . . 99 6.11 Confusion matrix results obtained from the cross-subject validation. The results
indicate that the model doesn’t infer one of the classes at all, either correctly or incorrectly. The 100% true positive accuracy noted in one of the classes could be spurious. . . 99 6.12 In some samples there were similarities in the measurements, as highlighted with
ovals in the image. The samples were collected in one session and from one subject. Each mental task was performed independently of other mental tasks, consequently they do not share the same timestamp. It is a matter of coincidence that they appear in the same frame on the TeSSTMaps visualization tool. Thus the degree of similarity depicted here is a gross underestimate of the true amount of similarity between the sequences. All the tasks were mental, and that means that the motor tasks were imagined. . . 101
List of Tables
5.1 Emotiv Data: Frequency bands and channels used for HCRF and LDCRF state representation. . . 77 5.2 BCI Competition Data: Frequency bands and channels used for HCRF and
LD-CRF state representation. . . 79 6.1 HCRF classification using Emotiv data. Each row represents an indepedent trial. 91 6.2 LDCRF classification using Emotiv data. . . 92 6.3 LDCRF classification using BCI Competition data. . . 93
Acknowledgements
First, I would like to thank Shun and Pravesh for grooming me over the past couple of years, and for supporting me in pursuing this madness, which on occasion results in wild bursts of energy and lethargy. I’d also like to thank Benji for going the extra mile in supervising this project, and in particular for reviewing numerous late-night-typed documents that somehow managed to carry vast amounts of grammatical and spelling errors. I’d also like to thank Hima for providing additional supervision in pursuing this experiment. Lastly, I would like to thank Adam Pantanowitz and Professor David Rubin from the School of Biomedical Engineering for their generous help. Without their Emotiv epoc headset, this project would have ground to
a halt. I hope this is the starting point for productive future collaboration. From whom I inherited blood:
..ripples tell tales from distant ages, and winds blow across forgotten lands, so flows the great current,
and in the darkest night it rages. Grains define isiqu,
and they never grow weak,
for the earth remembers that which arose from it. The first ray of dawn illuminates,
and the wise stand at the edge of the hills, but only to witness the gushing rivers, and though them life flows..
Abbreviations
BCI: Brain Computer Interface CRF: Conditional Random Fields CSP: Common Spatial Pattern DFT: Discrete Fourier Transform EEG: Electroencephalography EMG: Electromyography FFT: Fast Fourier TransformfMRI: functional Magnetic Resonance Imaging GUI: Graphical User Interface
HCRF: Hidden Conditional Random Fields HMM: Hidden Markov Model
LDCRF: Latent Dynamic Conditional Random Fields LDA: Linear Discriminant Analysis
kNN:k Nearest Neighbour
MDA: Minimum Distance Analysis MRI: Magnetic Resonance Imaging SDK: Software Development Kit SMR: Sensory-Motor Rhythms SNR: Signal-to-Noise Ratio
Chapter 1
Introduction
1
Problem Definition
Life is filled with unpredictable events that can lead to loss of motor control either through tissue damage which is induced by injuries, degeneration of a tissue group, or other ailments. Amongst injuries, one of the most common causes are motor vehicle accidents. There are various causes for degeneration of neural tissue, some common examples include: Parkinson’s disease, Huntington’s disease, and amyotrophic lateral sclerosis [Purves et al., 2004]. Other causes include ailments that influence motor control, but do not necessarily manifest as neural tissue degeneration. A prime example of such an ailment is stroke [Purves et al., 2004]. Loss of motor control leads to a considerable degradation of the quality of life. This manifests itself under various guises, among which we have a considerable or total loss of capacity to be able to tend to one’s basic needs such as being able to feed oneself, or to communicate with other people.
The problem under consideration in this work concerns the severing of the neuro-muscular connection, which in some cases this amounts to dismemberment of an associated appendage. Although it is possible to continue living, the experience does carry important implications concerning the quality of life. One of the most common problems associated with motor-control loss is the disconnect from society that the afflicted person feels. This disconnect often leads to depression for the afflicted person [Taylor 2006].
1.1 Importance of the Problem
The effects of the aforementioned conditions go beyond the person who is afflicted, since the condition becomes a problem within the family. In other cases it becomes a problem to society at large. Within the family unit, a care-giver is required to attend to the needs of the afflicted person. Since there is considerable concentration of wealth in South Africa (Gini coefficient of 0.65 as measured in 2011 [Statssa 2011]) as well as in many other countries in the world, this leads to the creation of an additional non-negligible burden on the family. This usually calls for greater resource requirements while the means of obtaining those resources are decreased, as in the case of an economically active person who becomes disabled.
Within a larger societal context, the effects are compounded by the number of people who then have to be allocated state disability grants (1 127 285 people as measured in South Africa
in August 2014 [Sassa 2014]). Although disability grants are based on prudent government policy, the financial resources that are required are substantial (R17 450 371 800 per annum as measured in South Africa in August 2014 [Sassa 2014]). These resources could be used for further advancement of society if people with disabilities could be given the opportunity to contribute to society, which in itself is a fulfilling experience, as it forms a part of purposeful living.
2
Proposed Solution
This work is aimed at providing an alternative channel for communication that does not depend on neuro-muscular connections, although there are advances in tissue engineering which could prove to be the ultimate solution for some of these problems by recreating neuro-muscular connections [Purves et al., 2004]. Applying those advances to solve problems at large-scale at present is not possible for technical and financial reasons [Purves et al., 2004]. In contrast we propose a low-cost solution that can be used in everyday situations by the average person.1
We propose a low-cost and non-invasive brain-computer interface (BCI).2 Non-invasive BCI technology does not require the insertion of measurement devices into body tissue. In the context of EEG, the measurements are obtained from placing electrodes on the scalp of the subject. The application of the BCI could for instance be to allow a user to perform text input on a computer by performing certain mental tasks. The tasks could include imagining moving one’s left arm or performing arithmetic operations. Different mental tasks would be mapped to different instructions that a computer would execute. This would result in text being typed out without the use of standard peripheral devices such as a keyboard or mouse.
2.1 Technical Prerequisites
In order to achieve the above stated objective, various technical challenges have to be addressed. The first challenge pertains to what it is that has to be measured in order to make the solu-tion work. The answer to this is provided by neuroscience theory. As discussed in Secsolu-tion 2 of Chapter 2, the brain exhibits non-uniform anatomical structure and neurophysiological be-haviour across various regions. Of particular importance is the electrophysiology of the brain, as this provides the electrical signal that can be measured and used as a correlate signal convey-ing information about the underlyconvey-ing activity in the brain. This signal is measured as electric potential differences between electrodes placed at different locations on the scalp. The essential insight here is that the time series of the electric potential differences encodes structure con-cerning which cortical regions are activated, and in what temporal order. The spatio-temporal dynamics in this signal are what is required in order to proceed to the next step leading to the
1The price of a clinical-grade EEG machines go into the region of ZAR100 000. In contrast, the Emotiv epoc
headset we use in this work costs ZAR10 000, although some of the newer models from the same manufacturer cost less than the Emotivepoc.
2
Non-invasive BCIs such as those based on electroencephalography are easier to use since they do not require direct contact with internal tissue. This stands in contrast to invasive BCIs such as those based on electrocor-ticography (ECG). Although invasive BCIs have higher spatial resolution and lower noise in the measured signal, the risk they pose with regards to infection or inflammation responses rules them out for this work.
proposed solution.
The second challenge pertains to how the measured signal should be transformed in or-der to reveal the structure encoded therein. Theoretical insights from both neuroscience and signal processing motivate that the transformation should reveal frequency domain structure, as opposed to purely temporal domain structure (see Section 3 of Chapter 2). The resulting frequency distribution information also exhibits complex spatio-temporal dynamics. Thus in order to derive meaning from this information, a model that can represent the dynamics is required. Unfortunately, one of the major limitations of current neuroscience theory is that a general theory of how the brain works is still not available, so interpreting the data becomes a substantial problem.
The third challenge pertains to finding an appropriate model that addresses the limitation of neuroscience theory outlined above. This limitation makes it challenging to derive a mathe-matical model that can represent the dynamics of the observed data, since there is currently no sound theoretical justification for the observed data. In order to circumvent the problem, we recast the mathematical modeling problem into a machine learning problem (see Section 4 of Chapter 2). When the problem is expressed within the machine learning paradigm, the main objective then becomes automatically learning the association between input data and output data. This means that the input data, which is frequency distribution information, is associated with an abstract class, and this class represents a label of some predefined mental activity. It is important to note that the reformulation of the initial problem is not intended to provide epis-temological insight pertaining to how the brain works, but instead is for providing a mapping between the input data and an abstract classification label. Once the mapping has been learnt for each subject, the labels produced by the model can then be used to invoke the execution of a predefined set of instructions on a computer.
2.2 The Contribution of this Work
The main contribution of this work concerns investigating the feasibility of creating a low-cost BCI, using the low-cost Emotiv EEG sensing technology (see Section 5 of Chapter 4). The chosen hardware is not useful in clinical applications due to the low resolution and the quality of the signals it provides, but it may be used for BCI applications [Emotiv 2014]. Our particular focus is on the machine learning models that can be used to facilitate acceptable performance levels of the proposed BCI. We perform classification and sequence labeling using probabilistic graphical models. A broad outline of these models is provided in Section 4.3 of Chapter 2, and a detailed description is provided in Section 3 of Chapter 5. The probabilistic graphical models that we use have been shown to provide superior performance in various application domains, including EEG related domains [Quattoni et al. 2007, Morency et al. 2007, Saa and C¸ etin 2012, Saa and C¸ etin 2013]. The models also have various theoretical properties, such as learning temporal dynamics and circumventing unjustifiable statistical independence assumptions, that make them especially suited to this application domain. The use of low-cost EEG hardware and probabilistic graphical models in the context of BCI technology is our main contribution.
3
Conclusion
This chapter presents the argument that the problem of motor-function loss leads to the de-generation of the quality of life for an afflicted individual, and that the repercussions are also significant at a societal level. The socio-economic implications carried by this problem are sub-stantial. In the second section, the proposed solution that may prove to be applicable to a wide range of people in the economic spectrum was introduced.
There are various technical challenges that have to be addressed in this regard, and some of the solutions to these challenges are found within the theoretical constructs of neuroscience, signal processing, and machine learning. The essential insight concerning the proposed solution is that an electrical correlate signal can be measured on the scalp of the person using the BCI, and the signal can be meaningfully interpreted such that the intentions of the user are translated into the execution of computer instructions. All the required theoretical constructs are developed and discussed in the subsequent chapters.
4
Organization of the Dissertation
In the chapters that follow, the theoretical foundation of the proposed solution is first outlined in Chapter 2. This is achieved by discussing the required key theoretical results from neuroscience, signal processing, and machine learning. In Chapter 3, various studies relating to the subject of this work are reviewed. In that chapter, we note the dominant use of clinical-grade EEG hardware in BCI technology research field. In this work we take a different approach by seeking to make the technology accessible to people of average means. This is achieved by using low-cost EEG technology.
In Chapter 4, the procedure that was followed to perform the investigations is outlined. It is in that chapter this the research hypothesis and the research methodology are presented. This work has a considerable empirical research component, and so a detailed account of the tools which were developed in order to enable experimentation is presented. Chapter 5 then outlines the experimental protocol that was followed to test the performance of the system. An outline of the data collection methodologies and experiment paradigms is provided. The concluding section provides a technically oriented description of the probabilistic graphical models that we use in this work.
In Chapter 6, the results obtained from the experiments are presented. This presentation begins with an outline of the visualization tools that assist in extracting useful information from the experimental data. The chapter ends with a discussion pertaining to the data and some of the irregularities that were encountered during the experimental sessions. After the results have been presented, we turn to the analysis of the results in Chapter 6, in which the research hypothesis of this work is tested. In that chapter, the correspondence between the data and neuroscience is also investigated. The chapter ends with an analysis of the performance of the machine learning models that were used in this work. Lastly, Chapter 7 provides a discussion of the research findings and possible avenues for future work are outlined.
Chapter 2
Theoretical Foundation
1
Introduction
This chapter discusses the theoretical results that are required to implement the proposed solution. The discussion begins with basic insights from neuroscience that have led to the current model of the brain and how it functions from a computational perspective. It is in this section that the foundation of electroencephalography (EEG) is outlined (see Section 2). Subsequently we introduce some basic concepts from signal processing theory that are required when data with complex structure has to be processed (see Section 3). The discussion concludes with a discussion on machine learning and some of the main results from the field that are used in this work (see Section 4).
2
Neuroscience Theory
Decades of brain research have produced important results concerning both the structure and function of brain regions. Lesion studies have revealed that brain functions seem to be related to very specific brain regions. Although the regions do depend on other regions for input of information, some functions are dominated by certain regions in the sense that if the region is damaged, then the corresponding function is lost [Purves et al., 2004]. This discovery formed the basis of the model that is presented in Figure 2.1. The model represents current knowledge on matters of anatomical definition and physiological processes in the brain.
Although a general theory of brain functions is still not available, the study of neuroscience has undergone substantial transformations and has made considerable progress. Some of the major contributions have revealed deep anatomical information, with one iconic example being the neuron staining technique introduced by Santiago Ram´on y Cajal over a century ago. Cajal’s technique provided the first insights into the structure of the atomic units of the brain which are the neurons (see Figure 2.3).
With the neuron having been isolated, further research would be carried out which not only unveiled more delicate anatomical definitions, but gave rise to the study of the physiology of the neuron itself. Most of the studies pertaining to neuron physiology involved investigating electrical properties of the neuron. Regularities in electrical response of the neuron would soon lead to what we now call computational neuroscience, as discussed in Section 2.2.
Figure 2.1: The cortical area function-demarcated model of the human brain. The labels indicate the function of the corresponding area. Varying amounts of neural tissue are dedicated to performing functions, as illustrated in the image.
Source: Neurophysiology [KIN 2016].
Progress in related fields such as physics have provided tools that allow for safer and more effective investigation of both anatomical and physiological details. In the context of anatomy, magnetic resonance imaging (MRI) has proven indispensable when financial constraints are not prohibitive. The primary benefit of using MRI is very high spatial resolution. In the context of physiology, functional magnetic resonance imaging (fMRI) proves to be indispensable, but the latency which can vary up to six seconds is not negligible. EEG, which is the sensing modality used in this work, offers very low spatial resolution. However the latency is low, and this makes it ideal for investigating physiological processes that vary in the timescales of the order of hundreds of milliseconds.
In subsequent subsections, a deeper exposition of neuroscience principles is provided. The exposition begins with anatomical and physiological concepts about the brain, in which the structural and functional details are uncovered (see Section 2.1). This has been the dominant view on the subject for over a century. The next subsection concerns the computational neu-roscience perspective, in which the brain is viewed as a computational system which performs information processing via physiological processes that are supported by the underlying anato-my (see Section 2.2). The formulation of neuronal activity in terms of a mathematical model is one of the fundamental results from the field. EEG measurement forms the basis of this work, so a detailed account of its underlying principles is important. Thus the exposition ends with a discussion of EEG, in which the source of the phenomenon is revealed and the methodology for measurement standardization is outlined (see Section 2.3).
2.1 Brain Anatomy and Physiology
The study of brain anatomy concerns the structural make-up of the brain. The brain has numer-ous structures, most of which we exclude from our discussion. Our discussion focuses primarily
on the neocortex. The neocortex is a multi-layer neural tissue that represents the outermost surface of the brain. Only mammals have the neocortex, and it is thought to have appeared recently in evolutionary terms. Current knowledge suggests that the neocortex is responsi-ble for higher-order cognitive capabilities such as language processing, planning, mathematical reasoning, and other capabilities of comparable complexity.
Brain anatomy is important because it helps us better understand the brain both in anatom-ical definition and physiologanatom-ical functioning. Anatomanatom-ical definition defines the possibilities for physiological processes. For example, the neocortex has a non-trivial structure. There are multitudes of cortical folds which enable higher neural tissue densities to be packed into the relatively small volume provided by the human skull. The effects of cortical folds go beyond just neural tissue densities, with the measurable consequences being non-negligible. There is research that is aimed at functional localization, an example being by Brett et al. [2002] on the brain warping problem which is one of that fundamental problems in the research area.
The folding reorients patches of the neural tissue and with it, the orientation of electri-cal properties such as electric dipoles. When EEG measurements are performed, the apparent source of the EEG activity may be very misleading. This happens because the summation of electric dipoles is not independent of the geometry of the dipole configuration. Source localiza-tion is one of the difficulties that are impeding the development of EEG based brain imaging technology. The problem is aggravated when inter-subject comparative investigations are per-formed. This follows from the observation that individual brains exhibit different patterns in the structure of the cortical folds [Brett et al. 2002]. The result being that neural activation from the same cortical areas may have varying apparent source localities, when the orientation of the cortical folds is not taken into account.
In contrast to brain anatomy, brain physiology concerns the study of the physical processes that allow the brain to function properly and they manifest in various forms. The processes are also mediated by various mechanisms which include chemical messengers and electric potentials. In this work, the focus is exclusively on electrically mediated processes, as it is from these processes that the EEG signal arises (see Section 2.3).
Brain physiology is important because it provides the theoretical framework used to charac-terize the normality of certain processes in the brain. There are various physiologically inspired tests, some of which are based on EEG. For example, EEG tests are used to determine if a patient has epilepsy. Based on the spatial distribution and regularities in the EEG signal, a neurologist is able to make inferences concerning normality.1 This topic on EEG is developed further in Section 2.3.4. A quantitative study of physiological processes naturally leads to the computational neuroscience perspective, because this shift in perspective involves information processing (see Section 2.2).
An important neurophysiological observation is that varying amounts of neural tissue within the cortex is dedicated to the control of certain parts of the body (see Figure 2.2). Furthermore, neural tissue corresponding to different parts of the body is localized around certain cortical subregions within the motor cortex. The result being that if there are electrodes positioned to measure EEG signals from those regions, then detecting the EEG activity from those high neural
1It is worth stating that abnormal EEG activity does not necessarily imply clinically abnormal brain function.
density subcortical regions is easier because of the higher levels of activity.2 The next subsections describe basic anatomy and electrophysiology of the neuron, which is the fundamental building block of the brain. Section 2.1.2 naturally leads us to the information processing perspective from computational neuroscience (Section 2.2). This perspective provides the philosophical foundation assumed in this work, and marks the end of our discussion of neuroscience.
Figure 2.2: Cortical homunculus model for neural-tissue-to-body-part mapping. Varying amounts of neural tissue within a cortical region are dedicated to a particular body part. The spatial distribution of the tissue has a direct influence on the measurement of EEG activity corresponding to a particular region.
Source: The cerebral cortex of man: a clinical study of localization of function [Penfield and Rasmussen 1950].
2.1.1 Anatomy of the Neuron
Different parts of the nervous system have different kinds of neurons, and the neurons have different functions within the nervous system. Anatomy of the neuron is the study concerned with the structural composition of the neuron, and thus provides a static view of the neuron. Three of the anatomical signatures of neurons are depicted in Figure 2.3. Neurons have three primary structures. The bulbous black object represents the cell body, and the spiny projections represent either axons or dendrites. Vital functions that keep the cell alive are performed in the cell body. The cell nucleus is also located in the cell body. Action potentials to be communicated with other neurons propagate via the axon.3 Action potentials received from other neurons propagate via the dendrites, and are relayed to the cell body of the receiving neuron.
The anatomical properties of the cell are important because they define the possibilities for the electrophysiological processes (see Section 2.1.2). For example, the bi-lipid layer on the neu-ron provides the electrical insulation that is required for propagating the action potential along
2To use music as an analogy, these regions are the band-members who play the loudest. 3
Figure 2.3: Schematics of biological neurons. Cell bodies that contain the nucleus are depicted using black bulbous dots. The long projections emanating from the cell body represent the axon of the neuron that transmits the action potential of that neuron to other neurons it is connected to. The short projections represent the dendrites of the neuron that receive action potentials from other neurons connected to it.
Source: Neuron doctrine [Wikipedia neuron 2015].
the axon. If there are structural weaknesses on the bi-lipid layer, then information transmission is compromised.
2.1.2 Electrophysiology of the Neuron
Electrophysiology of the neuron is the study concerning the electrical properties of the neuron. Electrophysiology provides a dynamic view of the neuron since the electrical properties vary with time, giving rise to the differential equation formulation presented in Equations 2.1 of Section 2.2.2. In this work we focus on the dynamical properties.
What is typically measured is the electric potential difference between two reference points on the neuron. Neurons have intrinsic electrical properties because they maintain potential differences between the inner and outer environments of the cell. The processes involved in maintaining the potential differences are active ion-exchange mechanisms. The ion-exchange mechanisms are mediated by ion-channels which are located on the cell membrane of the neuron. One of the major advances in the subject came by way of neuron excitation experiments. A classic setup of these is depicted in Figure 2.4. Those experiments suggested that the encoding scheme that the brain uses, which manifests through the discharge of action potentials, is determined by anatomical structures and well-defined physical processes [Dayan and Abbott 2001]. Even though different brains induce variations to the mechanism owing to differences in how each brain has developed, the underlying principle is invariant.
This leads to the view that there is a particular encoding mechanism that the brain uses to process and transmit information. This idea is further developed in Section 2.2. If those information processing mechanisms can be understood, then they can be directly used to encode,
Figure 2.4: Measurement of neuron potential difference. Depending on the stimulation induced on a neuron that has synaptic coupling with another neuron, a measurable change in the po-tential difference is produced between two spatially separated locations in the receiving neuron. Charge is a conserved quantity, so the spatial distribution of the potential difference has to reflect the conservation. In the image, the potential differences are measured with respect to ground at two locations and differences in the plotted profiles illustrates the conservation of charge.
Source: Electrophysiology [Wikipedia electrophysiology 2016].
decode, or transmit neural information beyond the nervous system. In this work, the objective is to leverage this notion in order to create the bridge between mental tasks and the execution of computer instructions.
Action potentials generated in a neuron are propagated through the neuron’s axon. The destinations of the action potential are the synaptic junctions in which the dendrites from other neurons make connections. It is worth noting that the connection is not a trivial physical connection: there are spaces at the synaptic junctions. The transmission of action potentials is mediated by neuro-transmitters which traverse the space between the synaptic junctions of different neurons (see Figure 2.5). Section 2.2 provides a quantitative framework which is used to describe the creation and propagation of the action potentials.
2.2 Computational Neuroscience
Mathematical modeling has been successfully applied in various fields, and has produced re-sounding success in physics. Circa 1950, a new paradigm drawing from biophysics emerged in neuroscience. The paradigm led to the creation of the Hodgkin-Huxley model which formed the basis for the biophysical modeling of action potentials. Computational neuroscience pertains to the application of quantitative techniques to describe the physical processes in the brain in terms of information processing. Within this paradigm, the primary focus is on information processing and the anatomical structures that make it possible.
Computational neuroscience is important because through the use of quantitative tech-niques, it provides a framework that allows for the systematic study of information processing in the brain. It also shows that the brain employs definite and unambiguous mechanisms for information processing. The main task in computational neuroscience then is uncovering those
Figure 2.5: Neuro-transmiter mediated inter-neuron electric action potential transfer. The axon terminal is connected to the neuron that is the source of the action potential. The recipient of the action potential is neuron with the dendritic extension.
Source: Action potential [Wikipedia action potential 2016].
mechanisms that underlie information processing.
This philosophical basis is pivotal to this work, because it justifies the search for a general trend in cortical activity that is associated with certain mental tasks. The general idea being the following. Certain mental tasks give rise to increased or decreased neural activity in certain cortical regions. If the neural activity in those cortical regions is largely invariant whenever a particular mental activity is performed, then the observables (i.e. through EEG signals) associated with neural activity would also be largely invariant. Hence, the cortical activity would also exhibit a general trend associated with the performance of particular mental tasks. If the mental tasks invoke neural activity differently, then it follows that in the absence of informational degeneracy, the general trends observed at the cortical level would also be different. Thus the cortical activity trends would be distinguishable from each other.
There are various models which focus on different problems in the field. On one side of the spectrum, we find chemical intracellular processes that regulate the cross-membrane potential differences and regulate firing rates for a single neuron (see Figure 2.4). On the other side of the spectrum, we find inter-neuron processes that communicate information within small regions of neural tissue (see Figure 2.5), and across long-range pathways between cortical regions and sensory or motor extensions of the nervous system (see Figure 2.6).
The primary means by which information is communicated between neurons is through action potentials.4 The action potentials propagate through neuron axons. In this work, we focus exclusively on aspects related to inter-cortical action potentials, the propagation of those potentials, and the measurable effects that they produce. Below, we discuss the biophysical model which describes the propagation of action potentials.
4There are other mechanisms, such as those mediated by chemical messengers like hormones, which are
involved in the communication of information. But for practical reasons, which pertain to what we measure in the study, they are not discussed in this work.
Figure 2.6: Schematic depicting long-range information processing in the nervous system. Not all nerves are directly connected to the brain with a single long-range connection. The spinal cord provides the relay mechanism that transmits action potentials to and from the brain. Concerning motor function, the connection that emanates from the brain terminates at a cor-responding muscle. Concerning sensory function, the connections that emanate from sensory units such as tactile sensors on the skin terminate in the brain.
2.2.1 Action Potential Modeling
Various efforts have been made in the computational neuroscience field regarding the physical processes that lead to the observed neuronal excitation. The Hodgkin-Huxley model [Hodgkin and Huxley 1952] provides early attempts based on biophysical insights to model the electrical response of a neuron given its internal state and its environmental conditions (see Figure 2.7). In the Hodgkin-Huxley model, the action potential which propagates through the neuron’s axon is of central importance. The essence of the idea is that a neuron can be considered as an electrical circuit. The physical attributes of the cell are then modeled as electric circuit components (see Figure 2.7).
Figure 2.7: Schematic of the Hodgkin-Huxley model for action single neuron action poten-tial. The model is based on biophysical modeling with certain physical attributes of a neuron represented by an electrical circuit that performs an analogous role in an electrical circuit.
Source: Hodgkin and Huxley model [Wikipedia Hodgkin-Huxley 2016].
For example, the bi-lipid layer is represented as a capacitanceCm. Voltage-gated and leak
ion channels are represented as non-linear conductances gn(t, V) and gL, respectively. The
electrochemical gradients driving the flow of ions are represented by batteriesEn andEL. And
the ion pumps and exchangers are represented by current sourcesIp. The main task is reduced to
modeling the electric potential difference V between the intracellular and extracellular media. This electric potential difference affects the current state of the neuron, and determines the properties of the action potential when it arises.
In the original Hodgkin-Huxley model, synaptic interactions are not considered. However, in the extended Hodgkin-Huxley model the synaptic interactions are also part of the model [Mirowski 2006]. This makes the model useful for representing the dynamics of neural activity within a network of neurons. This is a significant improvement on the original model because information processing is defined at the network level, and not at the individual neuron level. A single neuron cannot extract visual information from the retina on its own: a network of neurons is required to accomplish such a task.
Both the original and extended versions of the Hodgkin-Huxley models are expressed using a set of coupled non-linear differential equations, as illustrated Equation 2.1. The variables in Equation 2.1 have a subscript iwhich indexes the neuron being considered in the network. The set variables of primary interest are the Vi. As can be seen in the model, these depend
on other variables which have their own dynamical properties as well. The variables ni, mi,
channel activation, sodium channel activation, and sodium channel inactivation. The voltage-dependent parameters αj and βj represent the flow rates for the different ion-channels. The
parameters ¯gN a, ¯gK and ¯gL represent the maximum values for the conductances associated
with the sodium, potassium and leak ion-channels. Gsynapse[j,i] specifies the synaptic coupling
between neuronsiandj. The original model can be recovered if the subscriptiis dropped and the terms involving synapses are set to make a zero contribution [Mirowski 2006].
C∂Vi ∂t +gi(Vi−Ei) =I applied i (t) gi = ¯gN am3ihi+ ¯gKn4i + ¯gL+ X j6=1 Gsynapse[j,i] Ei= ¯gN am3ihiEN a+ ¯gKn4iEK+ ¯gLEL+ X j6=1
Gsynapse[j,i]Ej,i
∂mi ∂t =αm(Vi)(1−mi)−βm(Vi)mi ∂ni ∂t =αn(Vi)(1−ni)−βn(Vi)ni ∂hi ∂t =αh(Vi)(1−hi)−βh(Vi)hi. (2.1)
The computational neuroscience perspective offers invaluable insight owing to its quantita-tive formulation, as it shows that there is some underlying natural order in how neurons process information. In this work we also adopt a quantitative formulation of brain activity. However, the standard neuroscience representation is not useful for BCIs which employ non-invasive mea-surement techniques. Three criticisms that lead us to depart from the standard computational neuroscience approach are presented below.
2.2.2 Pragmatic Considerations
The current models make no allowance for purposefully guided neural activity. What is meant is that the role of thinker is not explicitly recognized, and purposeful thinking is consequently not recognized. In our work, the intent of the user is the central concern. The approach is akin to the kinematical description of moving bodies in classical mechanics, in which the evolution of the system is completely determined by intrinsic kinematics of the moving body.
Given appropriate initial conditions and considering stochastic effects, this evolution can in principle be determined within the framework of the model.5 By and large, the theory provides a description of how a neuron or a group of neurons react to given electrical input and environmental conditions. The question concerning whether the brain fundamentally operates a highly sophisticated input-output mapping is currently within the confines of speculative philosophy. The question need not detain us here. In this work, the intentions of the user are fundamental. Consequently, the computational neuroscience approach in its current form cannot be fully adopted.
5
There is a formulation of the models that is based on stochastic calculus, but that doesn’t detract from the argument put forward.
The next consideration is that the current models are specified in the language of non-linear differential equations. Currently there is no known general computational framework for solving general non-linear differential equations.6 This short-coming in current analysis tech-niques makes working with non-linear differential equations challenging from a mathematical perspective. There are numerical techniques that yield numerical solutions to these problems. However, those techniques are not panacea, because they are prone to convergence failure. The problem is further complicated by the fact that the equations appearing in Equations 2.1 have to be solved for each of the approximately 100 billion neurons in the human brain [Purves et al., 2004, pg. 29]. All these problems render the model computationally infeasible. These prob-lems are especially severe in the context of wearable EEG technology, despite the appeal of the models being theoretically rigorous. We seek quantitative techniques which provide aggregate ensemble information.
Taking the lead from physics, we seek a framework akin to thermodynamics for the descrip-tion of the behavior of gaseous substances. With the understanding that the sought framework may give rise to phenomenological observables, we purposefully refrain from making any infer-ences about the underlying dynamics within the neural tissue.7 In short, the approach we seek makes no epistemological claims about brain function.
Lastly, our measurement process does not allow us to directly measure the action potentials that are communicated between neurons. We also cannot determine the other parameters that appear in the extended Hodgkin-Huxley model provided by Mirowski [2006] (see Equations 2.1). These limitations follow from the fact that our technique is non-invasive, and measures aggregate activity on the scalp. The EEG signal that we measure is a spatially aggregated and attenuated correlate signal of the underlying action potentials (see Section 2.3). Thus our approach is not directly compatible with the approach relying on action potentials, or spatially aggregated spike-trains, as used in the electrocorticographic measurement process.8
Our approach leads us to employ signal processing (see Section 3) and machine learning (see Section 4) as surrogates to standard computational neuroscience. Both topics are discussed and their use motivated in the indicated sections.
2.3 Electroencephalography
This subsection provides an overview of EEG-related concepts. First, the manifestation of EEG is discussed. Thereafter, EEG measurement standardization and interpretation of EEG data are discussed.
6This stands in contrast to linear differential equations which in principle can be solved when the roots of the
characteristic equation are obtained.
7Taking the lead from physics again, we note that the observable defined as pressure is not a fundamental
entity in the same way as energy of the gas molecules. It is however very useful when gas behaviour is investigated.
8
Electrocorticographic measurements are performed intracranially, thus there is physical contact with the neural tissue. The spatial resolution of the measurement is higher than that of EEG, but it is vastly lower than that achieved when thin electrode filaments are directly inserted into the tissue.
2.3.1 Overview of EEG
EEG is a non-invasive tool for recording electrophysiological activity in the brain. EEG activity is a measure of the difference in electric potentials as measured between two different regions on the scalp. This is achieved by placing electrodes at different locations on the scalp, and measuring the resultant potential difference providing outputs as depicted in Figure 2.8. EEG is important because it provides an alternative to the costly and bulky fMRI technology. An additional advantage of using EEG over fMRI is the signal latency. EEG provides neurophysi-ological information at a temporal resolution of milliseconds, and this stands in stark contrast to the temporal resolution of fMRI which can go up to six seconds. This means that short-lived dynamics of physiological processes with corresponding electrophysiological correlates can be detected when EEG is used. Low latency is particularly important in situations such as BCI control applications, where relatively short reaction times are required or are desirable. An-other benefit of low latency is that the lag between signal detection and task performance is also low, and that makes signal and task synchronization easier to determine. However, all of these benefits should be weighed against the downside of low spatial resolution, which is also a characteristic feature of EEG.
EEG is used in a variety of contexts. In the clinical context, EEG is used to infer clinical brain function abnormalities such as epilepsy. A newer application of EEG is emerging in BCI technology. In BCI technology, the EEG provides a control signal for a computer program which interprets the EEG signal, then executes the appropriate predefined set of instructions. The latter context is the subject of this work.
EEG measures the difference in electric potentials between two different locations on the scalp as it varies in time. Recording electrodes usually consist of small metal cups or disks that are attached to the scalp so that they make good mechanical and electrical contact [Fisch 1999, pg. ix]. The measurements are presented as multi-channel recordings as depicted in Figure 2.8. There are two technologies for measuring EEG activity: wet-electrode, and dry-electrode technologies. The most common and currently most reliable is the wet-electrode technology. Typically saline solution is required to increase electrical conductivity of the skin, as this helps with obtaining higher signal quality.9 Dry-electrode technology is by-and-large still under development. The signal quality offered by dry-electrode technology is still inferior to that of electrode technology. However, there are problems associated with using wet-electrode technology (see Section 5). The EEG sensor used in this work is based on wet-wet-electrode technology.
EEG is highly susceptible to environmental disturbances. Variations in EEG data are arti-ficially induced by environmental features such as lighting conditions. Other sources of artificial variations are body-part movements from the person wearing the equipment (see Figure 2.8). For example, the eye-ball has the structure of an electric dipole, so when the eye is moved, a time varying electric potential is produced. Another example is muscle tissue: there is a significant amount of electrical activity that is involved during the contraction of muscles. This activity results in what is called electromyography (EMG), producing signals which are usually 2 orders of magnitude higher than EEG. When the nature of the measured phenomenon is taken into consideration (i.e. potential differences in the range micro-volts up to a few milli-volts), it becomes apparent why these environmental features can easily induce variations in the EEG
Figure 2.8: The samples of main types of artifacts in human EEG. 1 - Electrooculographic artifact caused by the excitation of eyeball’s muscles. 2 - Electrode’s artifact caused by bad contact between P3 electrode and skin. 3 - Swallowing artifact. 4 - Common reference electrode’s artifact caused by bad contact between reference electrode and skin.
Source: Electroencephalography [Wikipedia electroencephalography 2016].
data. Unfortunately there is currently not much that can be done to handle these sensitivities, apart from creating a controlled environment. Thus we see that signal sensitivities present themselves as serious problems when working with EEG.
In addition to the above sensitivities, EEG data is also inherently noisy and exhibits sub-stantial loss of signal fidelity. Usually, the noise manifests in the EEG data as artifacts. The noise is primarily due to the sensing technology being used. In general this is a universal feature of all measurements. The outlined sources of sensitivities and noise hold back the development of BCI technologies that are robust. Other limiting factors are attributable to the cost of the system. Thus most of the work on BCI technology is still confined to laboratory settings. One of the aims of this work is to investigate the feasibility of using low-cost EEG sensing technology in BCI applications. A further discussion pertaining to signal fidelity is provided in Section 5.
2.3.2 Manifestation of EEG
The source of the EEG is electrical activity generated by nerve cells in the cerebral cortex in response to cortical processing and various kinds of input, including that from pacemakers of rhythmical activity in the depth of the brain [Fisch 1990, pg. ix]. These fluctuating potentials summate and conduct to the scalp where they can be recorded as the scalp EEG [Fisch 1990, pg. ix].
Since each neuron makes a contribution to the total EEG that is measured, it follows that neurons located in neighbouring regions to the neurons of interest create an interference pattern. Roughly speaking, this can be considered as a form of noise because the signal of interest is contaminated by the signal from neighbouring regions.10 The noise is accentuated
10
when the region of interest is located within a cortical fold, and it is surrounded by other regions which are also activated when a certain task is performed. In addition to noise, there is signal attenuation that occurs while the EEG signal is in transmission towards the scalp. The attenuation is induced by the dura mater and the bone tissue that forms the cranial cavity. The effect of the mentioned tissue structures is not negligible, and is one of the major reasons why electrocorticography provides better results than EEG.
In broad terms, EEG activity is categorized into five groups according to the frequency of the signals.11 Decomposing a multi-frequency signal into various constituent signals is the subject of Section 2.13. Figure 2.9 illustrates how the various categories are demarcated. A brief outline concerning the function of each of the rhythms is also provided below.
Figure 2.9: EEG signal decomposition into primary EEG bands. The frequency decompositions of the EEG signal represent the current categorization scheme. All except the gamma waves have been attributed to specific brain activiy.
Delta rhythms are slow brain activities typically preponderant only in deep sleep stages of normal adults. Otherwise, they may be indicative of pathologies [Adeli and Ghosh-Dastidar 2010, pg. 75].
Theta rhythms exist in normal infants and children as well as during drowsiness and sleep in
also part of brain physiology. That is to say, we have no epistemological grounds to use labels such as noise and interference in the strict interpretation of the words. In this context, the words are to be interpreted loosely so as to avoid excessive reductionism.
11There are also mu and sensory-motor rhythms that are contained within the categories, but we leave them
adults. Only a small amount of theta rhythms appears in the normal waking adult. Pres-ence of high theta activity in awake adults suggests abnormal and pathological conditions [Adeli and Ghosh-Dastidar 2010, pg. 75].
Alpha rhythms exist in normal adults during relaxed and mentally inactive awakeness. The amplitude is mostly less than 50µV and appears most prominently in the occipital region [Adeli and Ghosh-Dastidar 2010, pg. 75].
Beta rhythms are primarily found in the fronto-central regions with lower amplitude than alpha rhythms. They are enhanced by expectancy states and tension [Adeli and Ghosh-Dastidar 2010, pg. 76].
Gamma rhythms in contrast to the other rhythms, are usually not of much clinical and physiological interest and therefore often filtered out in EEG recordings [Adeli and Ghosh-Dastidar 2010, pg. 76].
In this work, the EEG bands that are used correspond to the alpha and beta rhythms. As discussed in Section 2 of Chapter 5, certain frequency windows are selected from the rhythms and these frequency windows are associated with voluntary movement, and state of concentration. Pfurtscheller et al. [1976] presents findings pertaining to power spectrum changes when the brain is engaged in certain tasks. Pfurtscheller et al. [1976] reports the changes in the power spectrum as indicative of event-related cortical desynchronization of the EEG, and this desynchronization is a result of activation of certain cortical regions.
2.3.3 EEG Measurement Standardization
EEG measurement standardization pertains to the definition of a standard template for con-ducting EEG measurement experiments. The measurement templates are called montages, and they define the spatial configuration for electrode placement on the scalp. A montage can be defined by selecting a set of electrode placement sites using the general montage diagram in Figure 2.10. The selected set would then constitute a montage.
In order to assist in experimental design standardization, the international 10-20 system for placement of EEG electrodes was developed (see Figure 2.11). The system ensures that experiments or measurements can be reproduced with ease. The standard is essential since there are non-negligible differences in the structure of cortical folds and head size variability between people (see Section 2.1). The 10-20 system ensures that electrode placement locations approximately correspond to the same functional regions even across different individuals. In this work, we use wet-electrodes and the montage used has a fixed electrode placement layout which covers the cortical areas labeled as: AF3, F7, F3, FC5, T7, P7, O1, O2, P8, T8, FC6, F4, F8, and AF4.
2.3.4 EEG Interpretation
Interpretation of EEG data pertains to the extraction of meaningful information from the data. The information may be used for various purposes including clinical diagnosis, and BCI technol-ogy. Depending on the context of study, the actual data that is being studied varies according to some transformation that is applied to the raw EEG data. For example, in the clinical context, the data that are studied are the multi-channel voltage recordings. The interpretation of EEG data is of paramount importance when assessing the presence of certain neurological
Figure 2.10: General montage template using the 10-20 electrode placement system. The topo-graphical layout of the nodes is intended to provide full coverage on the scalp.
Source: Anatomy and physiology [Neurofeedback 2016].
disorders such as epilepsy. In the context of BCI technology, the data that are usually studied are obtained after some frequency transformation is applied to the data multi-channel voltage recordings. When the concept is applied to BCI technology, it allows us to infer the intentions of the user of the BCI, thereby providing a communication link that bypasses the standard neuromuscular connection.
In clinical applications, the interpretation is currently carried out by skilled personnel who, as a result of extensive training, can notice irregularities which have been established primarily through empirical findings. As can be seen in Figure 2.8, the structure of the EEG data is non-trivial, and extracting irregularities is challenging. In the context of BCI technology, the task is typically carried out by a machine learning inspired model that has been trained and validated with experimental data (see Section 4). There are substantial practical difficulties associated with EEG interpretation. The difficulties arise owing to different factors, one of which being the difficulty of source localization as outlined in Section 2.1. However, other factors are dependent on the context in which the task is performed.
In the clinical context for example, another factor is that the services rendered by skilled personnel are expensive. Additionally, even access to those services is a difficulty in its own right, depending on geographical location. In Africa, this pro