Global off-line evaluation of the ISBA-TRIP flood model.
61
0
0
Full text
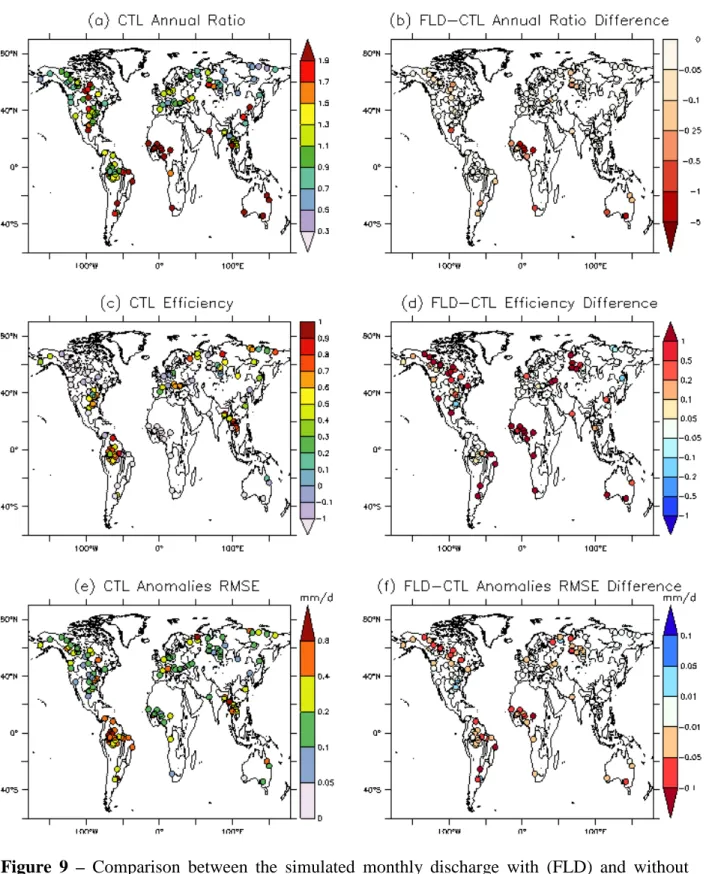
Figure


+7


Related documents
