1
Heterogeneous Preferences for
Community Recycling Programs
Gorm Kipperberg
Associate Professor
Department of Business Administration, University of Stavanger 4036 Stavanger, Norway
Telephone: +47 47 67 48 29; Fax: +47 51 83 37 50; Email: [email protected]
Douglas M. Larson
Professor
Department of Agricultural and Resource Economics, University of California, Davis One Shields Avenue, Davis, California, USA
2
Heterogeneous Preferences for
Community Recycling Programs
Abstract
This paper examines households’ preferences for community recycling programs, which have both public and private good dimensions. The data come from a survey conducted in Seattle, WA that elicited stated preferences for different recycling systems (or program changes) relative to status quo with experimental variation in the overall community recycling rate achieved and expected household cost. The community recycling rate is interpreted as capturing the public benefits of recycling programs and constitutes the most common way local and national agencies formulate waste management objectives and evaluate policy initiatives. The paper begins with panel mixed logit estimations that uncover heterogeneous preferences across program type and across individuals within specific program types, and yield the first estimates in the literature of marginal willingness to pay for community recycling rate improvements. Then, posterior individual-specific utility parameters are analyzed with regressions using perceived behavioral implications, basic household characteristics, and attitudes as explanatory variables. Overall, this paper generates interpretable policy-relevant insights into the public and private good dimensions of community recycling programs.
Keywords: stated preferences, mixed logit, willingness to pay, recycling programs,
impure public goods, environmental policy
3
1. Introduction
Stated preference (SP) methods can be used to elicit preferences for both public and private goods (Louviere et al., 2000; Freeman, 2003).1 For example, environmental economists typically employ SP methods to value non-market goods such as improvements in environmental quality, which have benefits that are non-excludable and non-rival (Freeman, 2003). In contrast, marketing research employ SP methods to predict consumers’ response to and willingness to pay for new products or product attribute bundles, which give rise to private benefits (Louviere et al., 2000). This paper applies SP methodology to examine preferences and willingness to pay (WTP) for community recycling programs (CRPs), which, in general, have both public and private good dimensions.
From the perspective of local communities or the overall society, the main arguments for implementing and operating CRPs are to decrease the amount of wastes sent to landfills, conserve natural resources, and reduce externalities from virgin material production processes (Smith, 1972; Hoel, 1978; Kinnaman and Fullerton, 2000; Kinnaman, 2006). Measurement of an overall recycling rate is the most common way local and national policy agencies formulate waste management objectives and evaluate the effects of specific policy initiatives (e.g., EPA, 2005; City of Seattle, 2009). This overall recycling rate, which herein is referred to as the community recycling rate, measures the fraction of total municipal solid waste generated that is diverted away from landfills through various recycling and waste reduction programs. In this paper, this recycling rate is interpreted as capturing the public good dimension of CRPs.
While waste reduction, resource conservation, and externality abatement fit the economic definition of public good, the associated benefits are not disconnected from the manner in which they are produced. CRPs are implemented in particular ways, targeting specific recyclable materials and economic sectors, and vary in program features. Examples of some common CRPs
4
are residential curbside recycling programs, drop-off recycling centers, and business food waste collection. Moreover, the success of specific programs, both in terms of cost-effectiveness and the community recycling rate achieved, depends on how willing consumers (and firms) are to participate in them. This activity or use-dimension, which may give rise to private utility or disutility, makes CRPs de facto mixed private-public (or impure public) goods (Andreoni, 1990; Kotchen, 2005; Kotchen and Moore, 2007).
From the point of view of the individual household, participation in a CRP can be viewed as the outcome of utility-maximization, with decisions being affected both through budgets and preferences (e.g., Wertz, 1976; Morris and Holthausen, 1994, Kinnaman and Fullerton, 2000). In situations where there is a user fee placed on conventional waste disposal, households can recycle to reduce disposal amounts and associated expenditures (Fullerton and Kinnaman, 1996; Allers and Hoeben 2010). The private trade-off is that this benefit may come at the cost of spending more time and effort (Morris and Holthausen, 1994; Bruvoll et al., 2002). Various types of recycling activities may also be utility-non-neutral, with some being enjoyable and other types perceived as burdensome. This is evidenced in the empirical literature on household recycling behavior which shows that recycling intensities vary across materials (Jenkins et al., 2003; Ferrera and Missios, 2005; Kipperberg, 2007). People may also have positive preferences over both the level of environmental public goods and their own contributions to these goods, which potentially adds another private good dimension to the recycling choice context (Andreoni, 1990; Brekke et al., 2003; Nyborg and Rege, 2003). Two related ideas are, one, that recycling has become a social norm that must be lived up to in order to obtain social approval or avoid social disapproval (Holländer, 1990; Bruvoll and Nyborg, 2004) and, two, that recycling provides one of several ways for people to obtain status or identity as so-called green (environmentally friendly) consumers (Akerlof and Kranton, 2000; Kotchen, 2005; Brekke et al., 2010). Regardless
5
of underlying motivation (Ackerman, 1996), these private good dimensions are likely to influence households’ preferences and willingness to pay for recycling programs.
This paper employs SP data from a household survey conducted in Seattle, WA to examine preferences for both the private and public good dimensions of CRPs. A contingent rating experiment included in the survey elicited participants preferences over five alternative recycling programs (or recycling system changes) relative to status quo with experimental variation in the community recycling rate achieved and expected household cost.2 Using the rating data and other information collected in the survey, two separate econometric analyses are produced.
First, panel mixed logit specifications, formally motivated from a random utility model (RUM) framework, are estimated to investigate preference heterogeneity across programs, across individuals within specific program types, and for improving the community recycling rate (Section 4). As regards to the latter, despite this common way of evaluating the success of recycling programs, this paper is the first in the literature to produce explicit estimates of marginal WTP for improvements in the community recycling rate. Existing SP research in the area of recycling and waste management has typically examined the total value of a particular program, without much explicit attention to program features or the public benefits produced (Tiller et al., 1997; Lake et al., 1996; Kinnanman, 2000; Aadland and Caplan, 1999, 2003, 2006; Caplan et al., 2002; Blaine et al., 2005; Bohara et al., 2007).3
Second, posterior individual-specific utility parameters are extracted using Bayesian techniques and analyzed in regressions using household background information (Section 5). Specifically, results for variables capturing perceived behavioral implications for the alternative programs (elicited as part of the contingent rating experiment), socioeconomic status, and various attitudes generate insights into the nature of preference heterogeneity as it pertains to the private
6
good dimensions of CRPs and various behavioral motivations. While the literature has suggested several ways to explain heterogeneity, such as segmentation analysis, latent-class models, and interactions of observable information with logit parameters in various ways (Hensher et al., 2005), few researchers have taken this particular ex-post approach to analyzing determinants of preference heterogeneity. One published exception is Hu et al. (2006), who studies preferences for GMO features in food products.
Following the two econometric analyses, several policy implications from the findings are discussed (Section 6). Here, a conservative estimate of WTP for improving the community recycling rate is converted into a per-ton equivalent for the City of Seattle, which yields a figure that suggests the non-market public good value of recycling is not only statistically significant but also economically non-trivial. Overall, this paper makes contributions to empirical literatures on valuing waste reduction programs, understanding preferences for mixed private-public goods with environmental implications, and explaining preference heterogeneity.
2. Data
The contingent rating experiment was included in a mail-mode survey carried out in Seattle, Washington.4 The survey was designed, tested, and implemented following the Tailored Design Method (Dillman, 2000), with actual implementation taking place between October 2004 and February 2005. Overall, the survey achieved a response rate of 0.60 and generated useful data for 1172 households.
A rating format for eliciting preferences was chosen because of its simplicity and potential ability to generate a large amount of preference information, while requiring relatively low effort from participants, compared to other SP approaches such as choice experiments (Layton and Lee, 2006). This was an important design consideration as the survey questionnaire
7
had to meet other research objectives as well, and in total, placed high demands on the participants.5
The specific research objective of the rating experiment was to elicit preferences for different changes to Seattle’s existing recycling system, and in doing so, identify the value people place on increasing the community recycling rate. At the time of the survey, the recycling rate in Seattle was 40%, but city planners were looking into ways to improve this rate to 60% (City of Seattle, 2009). Under consideration were several changes or additions to the existing recycling system that could yield higher levels of recycling. The experiment was designed in close collaboration with city planners and the final design included five alternative recycling programs (or system changes), which for the purpose of the below discussion are given the following labels: “SINGLE-STREAM”, “BAN”, “FOOD WASTE”, “NON-RESIDENTIAL”, and “NEW YORK”. An example of the rating experiment as it appeared in the survey questionnaire is reproduced in Appendix 1.
Alternative 1, SINGLE-STREAM, would constitute a move from dual- to single-stream curbside recycling. Instead of separating glass from other recyclable materials, Seattle households would be permitted to put all recyclables into a single container. Different materials would then be separated at a material recovery facility and sold for recovery and re-use in secondary markets. In general moving from multi-stream to single-stream recycling is predicted to have a positive effect on community recycling levels. From the household’s perspective, dealing with a single container may simplify the recycling effort and reduce time use. However, this program change, which has been rapidly implemented in many communities, remains contentious. A major private-use concern for many households is the size of the recyclable container. Some people are also concerned about contamination issues, and related, some are skeptical about whether the quality of community recycling will be the same even though the level of recycling might
8
increase. Hence, it is possible that SINGLE-STREAM could be either positively or negatively viewed by households (holding the community recycling rate and household cost constant).
Alternative 2, BAN, would prohibit disposal of recyclable items in the regular trash. From society’s perspective, this program change is expected to increase community recycling. Privately, such prohibition imposes a constraint on behavior that is likely to make households worse off, specifically, by potentially requiring more care and time devoted to recycling efforts. While standard economic theory suggests that such constraint would be perceived negatively (all else equal), it is possible that some segments of people would welcome this program. Such preferences could arise among individuals who would be unaffected by the prohibition and perceive others as not committing enough resources towards contributing to overall waste reduction.
Alternative 3, FOOD WASTE, would add separate curbside collection of food waste to the current recycling system. As food waste constitutes a large portion of what ends up in landfills, adding this component is predicted to increase the community recycling rate. Privately, it would permit households to recycle more and potentially reduce waste disposal amounts. On the other hand, use of this program would require increased household effort. Moreover, some people may have concerns about sanitation/odor issues associated with both own food waste and that of surrounding neighbors.
Alternative 4, NON-RESIDENTIAL, would expand recycling options for businesses and local organizations, and thereby increase the community recycling level. As employees of businesses and members of local organizations, this program change also has private good implications, which some people may view positively and others view negatively. On the one hand, people with preferences for contributing towards public goods are likely to view it as inherently beneficial as it affords them an opportunity to recycle more outside the home. On the
9
other hand, people motivated by a sense of duty, or people who recycle strictly to live up to a social norm, are likely to view this program as privately costly due to increased social scrutiny and pressure.
Alternative 5, NEW YORK, would remove curbside recycling in the residential sector, one of the key components of the current recycling system in Seattle.6 While this change was actually not under consideration by the City of Seattle, this alternative was included in the rating experiment to get a better understanding of people’s preferences and willingness to pay for the existing curbside recycling program.7 To the extent that people recycle as a way to save money on waste disposal, or have preferences for actively contributing to the overall level of recycling in Seattle, this alternative is likely to be associated with substantial reductions in the private benefits of the overall recycling system. However, consistent with the reasoning above, individuals who recycle out of duty or to live up to a social norm might feel they would be better off without curbside recycling, as such program makes personal recycling effort, or lack thereof, highly visible to others.
The survey asked participants to rate these alternatives relative to status quo, with each hypothetical program varying experimentally in the community recycling rate achieved (RECRATE) and estimated monthly cost per household (HHCOST). The experimental design for these attributes is summarized in Table 1. The ranges and levels of the attributes were based on information provided by city planners, with some adjustments made for statistical efficiency and identification purposes. From these ranges, a total of 15 different attribute profiles were developed based on random draws from the permissible attributes levels. These profiles were subsequently included in equal numbers in different questionnaire versions, which were then assigned randomly to the sample population.
10
The rating task involved eliciting a rating score for each alternative program on a 0-10 scale, with the existing system given an exogenous score of 5 (the mid-point of the rating scale).8 The lowest score (0) was designated to mean that the alternative program would be much worse than the current system, whereas the highest score (10) was designated to imply that the alternative program would be much better than Seattle’s current system, with any integer between 0 and 10 permissible. Table 2 reports statistics on number of respondents, percentages of rating scores classified as worse than, the same, and better than the current system, and sample mean and standard deviation for each alternative program. NEW YORK was the lowest rated program, whereas NON-RESIDENTIAL was the highest rated program.9
Information treatment prior to the rating exercise reminded participants of key features of the existing recycling system and was followed by a question that asked them to give an overall opinion of it.10 The participants were also reminded that the alternative programs could have behavioral implications in terms of how much the household would be able to recycle, which, in turn, could affect time spent on recycling and money spent on waste collection services. The participants were asked to think carefully about these implicit attributes prior to rating the hypothetical programs, with de-briefing questions asking them to quantify the perceived impacts afterwards (see Appendix 1).11 Tables 3 and 4 summarize responses to these de-briefing questions. Implied disposal cost changes were computed based on an earlier survey question that asked the respondents to identify their household’s current trash container matched with similar questions for the alternative programs.12 Change in recycling effort was elicited both qualitatively (increase, decrease, or stay the same) and quantitatively (change in minutes spent recycling per week).
11
3. Analytical Framework
When preferences are elicited with a rating format, researchers face many options when it comes to data-coding and estimation strategy (e.g., Mackenzie, 1993; Boyle et al., 2001; Layton and Lee, 2006; Bond et al., 2010). In this paper, the rating scores are given ordinal interpretations from which a pseudo-choice dataset of pair-wise preference comparisons is constructed.13 For every pair of programs, the highest rated program is taken to be the one preferred by the respondent. This is a pseudo-choice observation since the respondent did not actually choose, but such choice is implied by the ordinal preference information contained in the ratings. For example, in comparisons between status quo (whose rating was exogenously set to five) and the alternative programs, a rating score greater than five is taken to mean that the alternative recycling program is preferred to the existing system, and conversely for a rating score less than five. The same logic applies in comparisons between all other pairs of programs. This approach yields up to 15 informationally non-redundant preference revelations per respondent, which are summarized in Table 5.14
These preference revelations are formally motivated from a RUM framework. Let Unj be
the total utility to respondent n from program j, which has a systematic component (Vnj) and a
random component (enj). Assuming linear functional form for the systematic component and an
additive random component give the following expression for total utility (1) Unj=αnj +βn1⋅RECRATEnj +βn2 ⋅HHCOSTnj +enj,
where αj represents the intrinsic utility (or disutility) of the program, potentially arising from its private good dimensions, and the parameter pair (β1,β2) represents utility weights on the community recycling rate (RECRATE) and household cost (HHCOST), respectively. 15
12
In the implicit comparison of programs i and j, it is assumed that a respondent rates the former higher than the latter if and only if Uni >Unj. Tracking the pair-wise comparisons by
subscript k, k=1,..,Kn(Kn ≤15) and assuming that the error component is independently and
identically distributed type I extreme value conditional on the deterministic portion of utility, the probability that program i is preferred to j Pnik ≡Pr(Unik >Unjk) can be written as
(2) njk nik nik V V V nik e e e P + = .
The joint probability Pn for all available observations for respondent n is given by
(3)
∏
= = Kn 1 k nik n P P .Equation (3) could be estimated by a fixed parameter logit (FPL) approach, which would suffer from the independence of irrelevant alternative restriction, ignore the possibility of preference heterogeneity, and fail to account for multiple observations per respondent. The panel mixed logit (PML) model overcomes these shortcomings by assuming that the random errors are well-behaved conditional on non-zero individual-specific parameters. The PML probability L is n
given by the integral
(4) Ln =
∫
Lnf(θ|Λ)dθ,where f(θ|Λ)is a density function for the distribution of θ≡(α1,α2,..,αJ,β1,β2) and Λ are fixed coefficients of that distribution, typically, central tendency (e.g., mean) and spread (e.g., standard deviation), which are to be estimated. The probability in (4) does not have closed-form solution and must be approximated by simulated maximum likelihood procedures. This is typically achieved by taking R draws for θ from f(θ|Λ)to compute a mean joint probability
13 (5) =
∑
θ r r n n P ( ) R 1 L ~ .For implementation of the first econometric analysis (Section 4), the intrinsic utility parameters and the parameter on the community recycling rate are specified as random. 16 The intrinsic utility parameters are assumed to be distributed normally, a flexible specification since it permits both negative and positive values, consistent with the discussion in Section 2. The parameter on RECRATE is specified as log-normal, which imposes the assumption that an increase in the community recycling rate is strictly positively valued (an economic good), all else equal, which is consistent with the idea that it captures the public benefits of CRPs.17
The PML estimation yields population coefficients Λˆ , which characterize the distribution )
| (
f θ Λ , from which predictions of individual-level parameters θˆncould, in principal, be drawn. A Bayesian extension of this approach is to start with Λˆ as a prior and then updating with information on the respondents’ implied choices. Let the information in the preference comparison profiles of respondent n be denoted xn and let the sequence of implied choices be
represented by sn. Then the posterior parameter distribution h(θ|sn,xn,Λ) can be obtained by
Bayes’ theorem as follows (5) ) , x | s ( P ) | ( f ) , x | s ( P ) , x s | ( h n n n n n n Λ Λ θ ⋅ θ = Λ θ .
The second econometric analysis (Section 5) relies on this approach to extract posterior individual-specific estimates of the intrinsic utility parameters αˆnj, which are utilized in ex post
14
4. Logit Estimation Results
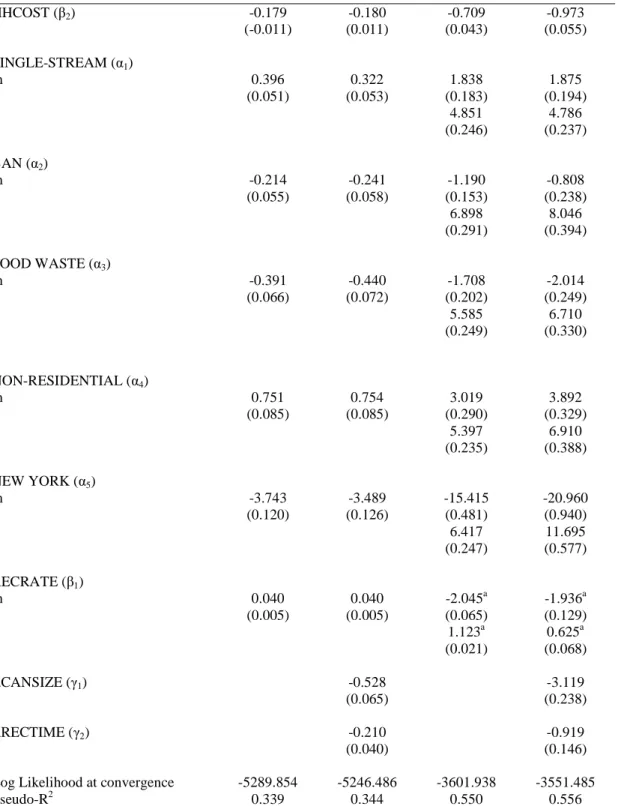
Table 6 presents estimation results for both FPL and PML specifications. FPL1 and PML1 include program-indicators and the two explicit attributes of the experiment (HHCOST and RECRATE), whereas FPL2 and PML2 also include variables that captures the perceived behavioral implications (∆CANSIZE and ∆RECTIME). The latter two variables were coded as -1 for a decrease, 0 for no change, and +1 for an increase in garbage can size and household recycling time relative to status quo, respectively, and are estimated with fixed parameters (γ1, γ2)
for ease of interpretation. All estimated coefficients are significant at least at a 0.01 significance level, and each estimated model is statistically significant overall (when compared to an equally-likely outcome model). The PML models are statistically superior to their FPL counterparts as indicated by improved pseudo-R2 and likelihood ratio tests (details not reported). A likelihood ratio test between the two PML models yields a chi-square statistic of 8.36, which exceeds the 0.05 level of significance critical value with two degrees of freedom (χ22,0.05 =5.99), but not the 0.01 critical value (χ22,0.05 =9.21).
The estimated means (m-coefficients) of the intrinsic utility parameters (α1, α2, α3, α4, α5)
are statistically different from zero in all models, consistent in signs across specification, and also statistically different from each other within each estimated model. The SINGLE-STREAM and NON-RESIDENTIAL programs have positive mean coefficients, suggesting that on average (i.e., for a “typical” household), these programs generate positive utility, holding constant the community recycling rate and household cost (and for FPL2 and PML2, also ∆CANSIZE and
15
negative, which implies that these programs generate negative intrinsic utility, on average. These results demonstrate preference heterogeneity across program type.
In the PML specifications, the estimated standard deviations (s-coefficients) of the intrinsic utility parameters are also highly statistically significant. This implies that preferences vary across households within each program type. Furthermore, there are substantial segments of people with both positive and negative preferences for each recycling system change (except NEW YORK), as shown in Table 7. For example, the program SINGLE-STREAM is predicted to yield negative intrinsic utility for about 35% of households, whereas 65% would get positive utility from its implementation. The program NON-RESIDENTIAL has the highest share of households with positive intrinsic utility (71%), whereas NEW YORK has the highest share with negative utility (over 95%).
Taken together, the above results demonstrate heterogeneous preferences both across programs and across households within each program type. Importantly, this finding holds in PML2, which controls for the perceptions of behavioral implications, with the variables
∆CANSIZE and ∆RECTIME having negative and significant estimated coefficients. One possible explanation for this persistence of preference heterogeneity is that the different programs have idiosyncratic private-good implications beyond the perceived behavioral implication (see more in Section 5).
The coefficient on RECRATE is highly significant with positive sign in both FPL models, consistent with the idea that increased community recycling rate is a public good attribute of CRPs. In the PML models, the estimated mean and standard deviation coefficients (m and s) for
)
ln(β1 are statistically significant. At point estimates the implied median, mean, and standard deviation of β1are 0.13, 0.24, and 0.55 based on PML1 and 0.14, 0.18, and 0.15 based on PML2.
16
This suggests that households also have heterogeneous preferences for improvements in the community recycling rate.20
Economic welfare measures can be obtained from the estimated models by recognizing that the cost parameter identifies marginal utility of money, which can be used to monetize the non-price attributes. Specifically, the monetary value of the intrinsic component of program type j is given by WTP(αj)=−αj/β2, whereas marginal WTP for a one percentage point increase in the community recycling rate can be computed as WTP(RECRATE)=−β1/β2.
The results reported in Table 8 shows that the four models yield close mean welfare estimates, with the PML models implying large variations across households. Using PML2 as an example, the mean intrinsic value of moving from dual- to single-stream recycling is about $2.3 per household per month, prohibiting disposal of recyclables in the trash is associated with a welfare loss of about $1, implementing curbside food waste recycling has a negative intrinsic value of almost $2.5, expanding recycling options for businesses and local organizations has a value of a about $4.8, and removing the current curbside recycling program is associated with a welfare loss of $26 per household per month.
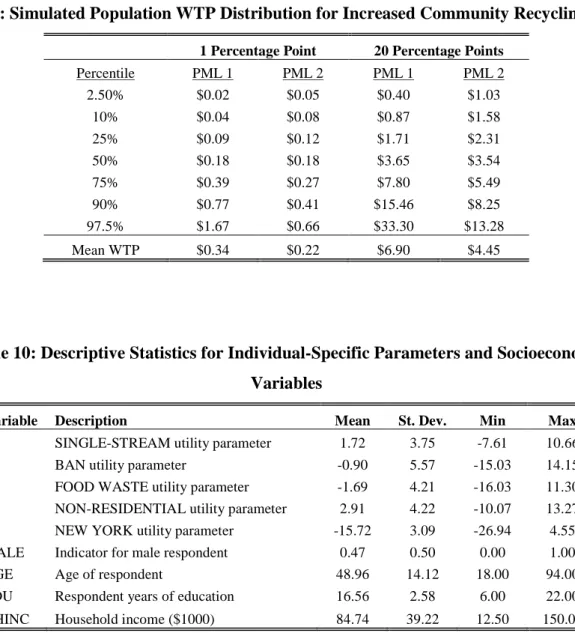
As regards to WTP for improving the community recycling rate, the PML2 results reported in Table 8 suggest mean (median) WTP for a one percentage point increase of $0.22 ($0.18) per household per month and a standard deviation of $0.18.A more detailed and robust characterization of WTP distribution can be obtained by the full-information simulation method suggested by Hensher and Green (2003). Results are reported in Table 9, which breaks down WTP by population percentile reported for both a one percentage point increase and a 20 percentage point improvement in the community recycling rate (the City of Seattle’s long term goal). As seen, there are large variations in population WTP, with the PML2 suggesting a tighter
17
distribution than PML1. The PML2 model suggests that the lowest 10% of the population has WTP of less than $0.08, whereas the highest 10% has WTP of more than $0.41 per household per month for a one percentage point increase. The median WTP is about $0.18 in both models, while PML1 has higher simulated mean WTP than PML2 ($0.34 versus $0.22). The extent to which these WTP estimates are economically significant is addressed in Section 6.21, 22
5. Determinants of Individual-Specific Preferences for Different CRP Types
The above analysis uncovered significant variations in preferences across program type and across individuals, holding the community recycling rate and household cost constant. One reason for such heterogeneity could be that recycling programs differ in behavioral implications and other private-good dimensions, and that households perceive and experience such idiosyncratic factors differently. Here, this preference heterogeneity is analyzed further by extracting individual-specific utility parameters for the different program types (αˆnj) using the Bayesian technique described in Section 3. These parameters are subsequently regressed on various household background data. In order to explicitly explore the role of perceived behavioral implications, the PML1 model (which did not include the ∆CANSIZE and ∆RECTIME variables) is used as the basis of analysis.
The other explanatory variables employed are several socioeconomic characteristics (AGE, EDU, MALE, and HHINC) collected in the survey, and attitude factors generated from an auxiliary factor analysis of responses to a series of attitude questions also included in the survey. Descriptive statistics for the individual-specific parameters and the socioeconomic variables can be found in Table 10.23 The attitude factors are given descriptive labels and corresponding interpretations (for respondents with high factor score) as follows:
18
Green Consumer: Sees recycling as a way to contribute to resource conservation and helping the environment, to be socially responsible, and to satisfy an intrinsic ethical duty.
Private Technological Constraint: Sees recycling as too time consuming, difficult due to lack of information, and not beneficial due to insufficient household production of recyclable materials or insufficient storage space.
General Altruism: Sees contributing to public causes as effective and one’s responsibility.
Resource Scarcity: Thinks the earth has limited resources and that animals have rights alongside humans.
External Motivation: Sees recycling as a way to save money, appear responsible in the eye of others, and as something one is expected to do.
Technological Optimist: Thinks the so-called ecological crisis is exaggerated, that nature can cope with industry, and that human resourcefulness will ensure that the earth remains livable.
Free-Rider Awareness: Perceives a lack of recycling effort from other people.
Linear regressions are performed both with and without the attitude factors and results are reported in Table 11. While all models are statistically significant overall at a 0.01 level of significance, the adjusted R2 statistics are generally low, with the models including attitude factors performing better. Low overall explanatory power is expected for a couple of reasons. First, the underlying idea behind all random parameter models (such as the PML) is to uncover preference heterogeneity that typically cannot be captured by observable information. Second, while several attitude questions were recycling-related, none pertained specifically to any of the alternative programs in the contingent rating experiment.
Nonetheless, several statistically significant results can be observed. First, ∆CANSIZE is significant with negative coefficient in all models. The coefficient on ∆RECTIME is also negative as expected, but only significant in the SINGLE STREAM and BAN regressions. Taken
19
together, these results suggests that perceived behavioral implications, in terms of garbage can size needed and household recycling effort, influence preferences for specific program types.
As regards to the socioeconomic characteristics, AGE is significant with negative coefficient in the FOOD WASTE and NON-RESIDENTIAL models. This suggests that older households perceive recycling food waste as a burden, beyond the extra time it might take, and despite a potential reduction in garbage can-size needed. Older people may also be less involved in the labor market and private organizations, and might therefore perceive less personal benefits from expanding non-residential recycling options. The results for EDU suggest that higher education is associated with lower intrinsic utility from the SINGLE-STREAM and NEW YORK programs and higher utility from the BAN and FOOD WASTE programs, all else equal. The variable MALE is significant with negative coefficient in the FOOD WASTE model, suggesting that men like less (dislike more) a food waste recycling program. Household income (HHINC) does not appear to be a significant determinant of preference for specific CRP types.
As regards to the attitude factors, several interesting insights can be glanced. First, the “Green Consumer” factor is generally statistically significant. This suggests that type of CRP affects households’ (perceived) ability to contribute to environmental and resource conservation, a private good dimension. The negative coefficient for this factor in the SINGLE-STREAM model is consistent with skepticism about whether such program would yield the same quality of recycling. The positive coefficient in the BAN regression might suggest that prohibition of recyclables in the trash is seen as validation of the importance of individual recycling effort, which would increase utility for someone with a “Green Consumer” attitude. The positive coefficients for this attitude variable in the FOOD WASTE and NON-RESIDENTIAL models are consistent with the fact that food waste and non-residential waste are frontier waste streams for increasing society’s overall recycling rate, due to their current low diversion rates (in Seattle
20
and elsewhere). The negative coefficient on the “Green Consumer” factor in the NEW YORK model is consistent with the fact that removing the curbside recycling program would dramatically decrease households’ ability to contribute to overall recycling.
Results for the “Private Technological Constraints” factor are also intuitive and consistent with private good dimensions of CRPs. Respondents with a relatively high score on this factor view the added convenience or simplicity of single-stream recycling more positively, have greater dislike for the BAN and FOOD WASTE programs (which place more emphasis on individual effort), and are relatively positive (or less negative) towards the NEW YORK program (which would place less emphasis on household recycling). Similar observations can be made for the other attitude factors. For example, it is interesting to observe that the coefficient on the “Technological Optimist” factor is positive and significant in the SINGLE-STREAM model and that the coefficient on the “Free-Rider Awareness” factor is positive and significant in the BAN model. The former suggests that people who believe in technology are less skeptical to a single container recycling system, whereas the latter observation might be related to reciprocity and fairness preferences.
6. Discussions and Policy Implications
The above econometric analyses have several policy implications. First, policymakers and program planners should be cautious of implementing program changes that many households view negatively, or perceive as generating negative private utility. While the survey’s rating exercise experimentally controlled for the community recycling rate, in practice, the overall community level of recycling is determined by people’s collective behavior. Given the degree of preference heterogeneity uncovered, any new program or recycling system change should be preceded by public outreach and information campaigns, and ideally accompanied by specific
21
incentive mechanisms encouraging participation. This is direct implication of the established mixed private-public good nature of CRPs.
Secondly, policymakers and program planners should be aware of the idiosyncratic and potentially counter-intuitive ways people perceive specific program changes. For example, the mixed preferences for the SINGLE-STREAM program, which is intended to make recycling more convenient for households, appears surprising. However, this program change has been contentious with many people questioning its convenience and ability to produce the same quality of recycling in the community. The finding in this paper is consistent with Jamelske and Kipperberg (2006) who find that about 35% of people in Madison, Wisconsin exhibit negative preferences for moving from a dual-stream to single-stream curbside recycling system. Another counter-intuitive result is the relatively large predicted share of people who associate the BAN alternative with positive intrinsic utility. In the case of Seattle, this finding could perhaps be reconciled by noting that 60% of the respondents did not think this prohibition would impact their recycling effort (Table 4). These people may view a non-binding constraint on own behavior positively if it helps improve the community’s overall waste reduction by placing binding constraints on others. Furthermore, 19% of the respondents thought this program would be associated with reductions in household waste disposal and expenditures, which would at least partially offset any negative utility associated with the additional constraint (Table 3). The mixed finding for the FOOD WASTE program is consistent with the idea that while food waste collection permits households to reduce their conventional trash disposal, many people have concerns over sanitation and odor issues. Moreover, while over half of the respondents thought this program would lead to an increase in household recycling time (Table 4), less than a third predicted that it would actually produce personal benefits through reduced waste disposal (Table 3). Finally, it is noteworthy that the NON-RESIDENTIAL program had the highest predicted
22
population share with positive intrinsic utility. While this program is unlikely to have behavioral impact at home, it may nonetheless be associated with private benefits through providing additional recycling opportunities outside the home. In contrast, NEW YORK, which is the program that would likely impact household behavior the most (as indicated by statistics reported in Tables 3 and 4), has the highest predicted negative utility share. The welfare analysis for this recycling system change suggests that abandoning the existing curbside recycling program would be associated with a welfare loss in the range of $19 to $26 per household per month (depending on estimated model).
Thirdly, as to the statistically significant WTP estimates for improving Seattle’s community recycling rate, the question arises whether these estimates are meaningful or economically significant. If these WTP estimates are interpreted as the non-market value of the public good benefits produced by CRPs, mean WTP can be multiplied by population size to obtain total non-market value (Freeman, 2003). Applying the lower mean estimate produced by PML2 to the approximately 150,000 single-family households in Seattle yields total value of about $396,000 per year for a one unit percentage point increase, or about $7.92 million per year for a 20% increase in the community recycling rate, which seems economically non-trivial. Furthermore, this calculation must be considered biased downward since any positive value that households who live in apartment buildings (excluded from this study) may place on increasing the community recycling rate is not included. Finally, the above non-market value can be converted to a per-ton estimate. This is useful for benefit-cost assessments, which are typically conducted by comparing recycling options to conventional waste disposal options on a per-ton basis. Using 2004 statistics for the City of Seattle, the total amount of waste generated per year was about 780,000 tons, which means a one percentage point increase in the recycling rate corresponds to 7,800 tons of recycled materials. This yields a non-market value estimate of about
23
$51 per recycled ton, a value that is economically significant in light of typical market costs of different waste management options throughout the Unites States. For example, in the case study of Kinnaman (2000), recycling one ton of materials cost about $102, whereas disposing of the same amount in a landfill cost $47, based strictly on market price data. Hence, the public benefits produced by recycling programs may go a considerable way toward justifying their sometimes higher costs.
7. Conclusions
This paper used a stated preference approach to examine preferences for community recycling programs, which are inherently mixed private-public (or mixed public) goods. The data employed came from a household survey carried out in Seattle, WA, which elicited contingent ratings of five hypothetical programs relative to Seattle’s existing quo recycling system, with experimental variation in the community recycling rate achieved and expected household cost.
Panel mixed logit analysis revealed large variations in preferences, both across program types and across respondents within each program type, which is suggestive of idiosyncrasies in the private good dimensions of recycling programs. Each hypothetical program, except one, was found to be associated with both a substantial portion of people who would perceive it privately beneficial, as well as a substantial portion of people who would place negative intrinsic value on its implementation, holding constant the community recycling rate and expected household cost. This preference heterogeneity was examined further in ex post regressions of posterior individual-specific parameters on variables representing perceived behavioral implications, socioeconomic status, and various attitudes. These regression results provided additional evidence of the private good dimensions of community recycling programs and were consistent with the idea that there could be multiple motivations operating in households’ decisions to participate in them.
24
Willingness to pay for improving the community recycling rate, interpreted as a measure of the public good dimension of community recycling programs, was found to be both statistically and economically significant, while varying substantially in the population. Despite the fact that local and national policy agencies frequently set recycling rate goals, and judge the success of policies and programs according to such measures, this paper constitutes the first effort to directly measure household valuation of increasing the community recycling rate. The mean willingness to pay for a 1 percentage point increase was found to be about $0.22 per household per month, or $396,000 per year for all 150,000 single-family households in Seattle, which translates into about $50 per ton of recycled materials for this particular community.
Overall, the preference heterogeneity and willingness to pay estimates from this paper’s analysis have important implications for policy, specifically, with regards to which programs (or recycling system changes) should be pursued, and how programs should be promoted and complemented with incentive mechanisms. Ultimately, the political feasibility and economic viability of community recycling programs depend critically on public support and the participation propensities of consumers (and firms), which is a direct consequence of the programs’ mixed private-public good nature.
25
REFERENCES
Aadland, D.A., and A.J. Caplan. 1999. “Household Valuation of Curbside Recycling.” Journal of Environmental Planning and Management 42(6): 781-799.
Aadland, D.A., and A.J. Caplan. 2003. “Willingness to Pay for Curbside Recycling with Detection and Mitigation of Hypothetical Bias.” American Journal of Agricultural Economics 85(2): 492-502.
Aadland, D.A., and A.J. Caplan. 2006. "Curbside Recycling: Waste Resource or Waste of Resources?" Journal of Policy Analysis and Management, 25(4): 855-874.
Ackerman, Frank. 1997. Why Do We Recycle? Markets, Values, and Public Policy. Island Press. Akerlof, G.A., and R.E. Kranton. 2000. “Economics and Identity.” The Quarterly Journal of Economics CXV (3): 715‐753.
Allers, M.A., and C. Hoeben. 2010. “Effects of Unit-Based Garbage Pricing: A Differences-in-Differences Approach.” Environmental and Resource Economics 45: 405-428.
Andreoni, J. 1990. “Impure Altruism and Donations to Public Goods: A Theory of Warm-Glow-Giving.” The Economic Journal 100: 464-477.
Blaine, T.W, F.R. Lichtkoppler, K.R. Jones, and R.H. Zondag. 2005. “An Assessment of Household Willingness to Pay for Curbside Recycling; a Comparison of Payment Card and Referendum Approaches.” Journal of Environmental Management 76(1): 15–22.
Bond, C.A., D.L. Hoag, and G. Kipperberg. 2010. “Agricultural Producers and the Environment: A Stated Preference Analysis of Colorado Corn Producers”. Canadian Journal of Agricultural Economics Forthcoming.
Boyle, K. J., T. P. Holmes, M. F. Teisl, and B. Roe. 2001. “A Comparison of Conjoint Analysis Response Formats.” American Journal of Agricultural Economics 83 (2): 441–54.
Brekke, K. A., S. Kverndokk, and K. Nyborg. 2003. “An Economic Model of Moral Motivation.” Journal of Public Economics 87 (9-10): 1967-1983.
Brekke, K.A., G. Kipperberg, and K. Nyborg, Karine. 2010. ”Social Interaction in Responsibility Ascription: The Case of Household Recycling.” Land Economics Forthcoming.
Bruvoll, A., B. Halvorsen, and K. Nyborg. 2002. “Households' Recycling Efforts.” Resources, Conservation & Recycling 36 (4): 337-354.
Bruvoll, A. and K. Nyborg. 2004. “The Cold Shiver of Not Giving Enough: On the Social Cost of Recycling Campaigns.” Land Economics 80 (4): 539-549.
26
Caplan, A.J., T.C. Grijalva, and P.M. Jakus. 2002. “Waste or Want Not? A Contingent Ranking Analysis of Curbside Waste Disposal Option.” Ecological Economics 43: 185-197.
City of Seattle. 2009. City of Seattle 2008 Recycling Rate Report. http://www.seattle.gov/util/stellent/groups/public/@spu/@usm/documents/webcontent/spu01_00 5874.pdf (Accessed July 5, 2010).
Dillman, D. 2000. Mail and Internet Surveys: The Tailored Design Method. Second Edition, John Wiley and Sons.
Ferrera, I. and P. Missios. 2005. “Recycling and Waste Diversion Effectiveness: Evidence from Canada.” Environmental and Resource Economics 30(2): 221–238.
Freeman, A.M. 2003. The Measurement of Environmental and Resource Values: Theory and Methods Second Edition, Resources for the Future Press.
Fullerton, D. and T.C. Kinnaman. 1996. “Household Responses to Pricing Garbage by the Tag.” American Economic Review 86(4): 971–984.
Hensher, D.A. and W.H. Greene. 2003. “The Mixed Logit Model: The State of Practice.” Transportation 30: 133-76.
Hensher, D., Rose, J. and W. Greene. 2005. Applied Choice Analysis. Cambridge University Press.
Hoel, M. 1978. “Resource Extraction and Recycling with Environmental Costs.” Journal of Environmental Economics and Management 5(3): 220-235.
Holländer, H. 1990. A Social Exchange Approach to Voluntary Cooperation. American Economic Review 80: 1157-1167.
Hu, W, M. Veeman, W. Adamowicz, and G. Gao. 2006. “Consumers’ Food Choices with Voluntary Access to Genetic Modification Information.” Canadian Journal of Agricultural Economics 54:585-604.
Jamelske, E. and G. Kipperberg. 2006. ”A Contingent Valuation Study and Benefit/Cost Analysis of the Switch to Automated Collection of Solid Waste with Single Stream Recycling in Madison, Wisconsin.” Public Works Management and Policy 11(2): 89-103.
Kinnaman, T.C. 2000. “Explaining the Growth in Municipal Recycling Programs: The Role of Market and Non-Market Factors.” Public Works Management and Policy 5(1): 37-51.
Kinnaman, T.C. and D. Fullerton. 2000. “The Economics of Residential Solid Waste
Management,” in The International Yearbook of Environmental and Resource Economics 2000/2001. H. Folmer and T. Tietenberg, eds. Cheltenham: Edward Elgar, pp. 100–147.
27
Kipperberg, G. 2007. “A comparison of household recycling behaviors in Norway and the United States.” Environmental and Resource Economics 36: 215–235.
Kotchen, M.J. 2005. “Impure Public Goods and the Comparative Statics of Environmentally Friendly Consumption.” Journal of Environmental Economics and Management 49(2): 281-300. Kotchen, M.J., and M.R. Moore. 2007. “Private Provision of Environmental Public Goods: Household Participation in Green-Electricity Programs.” Journal of Environmental Economics and Management 53: 1-16.
Lake, I.R., I.J. Bateman, and J.P. Parfitt. 1996. “Assessing a Kerbside Recycling Scheme: A Quantitative and Willingness to Pay Case Study.” Journal of Environmental Management 46: 239-254.
Layton, D.F., and S.T. Lee. 2006. From ratings to rankings: The Econometric Analysis of Stated
Preference Ratings Data. In Explorations in Environmental and Resource Economics: Essays in Honor of GardnerM. Brown, Jr., edited by R. Halvorsen and D. F. Layton, pp. 224–44. Cheltenham, UK: Edward Elgar.
Louviere, J., D. Hensher, and J. Swait. 2000. Stated Choice Methods: Analysis and Application.
Cambridge, United Kingdom: Cambridge University Press.
Mackenzie, J. 1993. “A Comparison of Contingent Preference Models.” American journal of Agricultural and Resource Economics 75: 593-603.
Morris, G.E., and D.M. Holthausen Jr.. 1994. “The Economics of Household Solid Waste Generation and Disposal.” Journal of Environmental Economics and Management 26: 215–234. Nyborg, K., and M. Rege. 2003. “Does Public Policy Crowd Out Private Contributions to Public Goods?” Public Choice 115 (3): 397-418.
Ruud, P. 1996. “Approximation and Simulation of the Multinomial Probit Model: An Analysis of Covariance Matrix Estimation,” working paper, Department of Economics, University of California, Berkeley. http://elsa.berkeley.edu/~ruud/montreal.pdf (accessed July 5, 2010).
Siikamaki, J., and D.F. Layton. 2007. “Discrete Choice Survey Experiments: A Comparison using Flexible Methods.” Journal of Environmental Economics and Management 53: 122-39. Smith, V.L. 1972. “Dynamics of Waste Accumulation: Disposal versus Recycling.” The Quarterly Journal of Economics 86(4): 600-616.
Tiller, K.H., P.M. Jakus, and W.M. Park. 1997. “Household Willingness to Pay for Drop-Off Recycling.” American journal of Agricultural and Resource Economics 22(2): 310-320.
Train, Kenneth. 2003. Discrete Choice Methods with Simulation. First Edition, Cambridge University Press.
28
Revelt, D., and K. Train. 1999 “Mixed Logit with Repeated Choices: Households' Choices of Appliance Efficiency Level.” Review of Economics and Statistics LXXX(4): 647-657.
United States Environmental Protection Agency. 2005. Resource Conservation Challenge. 2005 Action Plan. http://www.epa.gov/epawaste/rcc/resources/act-plan.pdf (Accessed July 5, 2010). Wertz, K.L. 1976. “Economic Factors Influencing Households’ Production of Refuse.” Journal of Environmental Economics and Management 2(4): 263-272.
29
Table 1: Experimental Levels for Explicit Attributes
Program RECRATE HHCOST
SINGLE-STREAM (39, 40, 41, 42, 44) (0, 1, 2, 3) BAN (41, 42, 46, 50, 52) (-4, -2, 0, 1, 2) FOOD-WASTE (40, 42, 45, 48, 49) (0,1, 3, 5, 6) NON-RESIDENTIAL (42, 45, 50, 55, 58) (1, 2, 4, 6, 7) NEW YORK (25, 30, 32, 35, 40) (-6, -3, 0) Note: A positive cost suggested that there would be an extra monthly fee on the household’s utility bill, whereas a negative cost suggested there would be a credit.
Table 2: Summary of Program Rating Responses
Program N Worse Same Better Mean SD
SINGLE-STREAM 1128 37% 17% 46% 5.3 3.0
BAN 1125 41% 12% 47% 5.2 3.2
FOOD-WASTE 1116 61% 12% 27% 3.7 3.0
NON-RESIDENTIAL 1107 36% 13% 51% 5.4 3.2
NEW YORK 1116 95% 3% 2% 0.7 1.6
Table 3: Perceived Change in Garbage Can Size and Implied Disposal Cost
Program Increase Same Decrease Average ∆$
SINGLE-STREAM 0% 0% 0% $0.00
BAN 0% 81% 19% -$1.41
FOOD-WASTE 0% 71% 29% -$1.80
NON-RESIDENTIAL 0% 0% 0% $0.00
NEW YORK 69% 28% 3% $10.00
Note: Disposal cost changes are given in dollars per household per month.
Table 4: Perceived Change in Recycling Effort and Time Spent Recycling
Program Increase Same Decrease +/- Min.
SINGLE-STREAM 7% 59% 34% -8.98
BAN 37% 60% 3% 20.03
FOOD-WASTE 54% 44% 2% 35.24
NON-RESIDENTIAL 0% 0% 0% 0.00
NEW YORK 19% 40% 41% 1.32
30
Table 5: Summary of Pseudo-Choice Pair-Wise Comparisons
Comparison # of Observations Pr(i)
01. SQ vs. SINGLE-STREAM 798 45% 02. SQ vs. BAN 826 45% 03. SQ vs. FOOD WASTE 811 68% 04. SQ vs. NON-RESIDENTIAL 831 40% 05. SQ vs. NEW YORK 887 99% 06. SINGLE-STREAM vs. BAN 761 47%
07. SINGLE-STREAM vs. FOOD WASTE 750 67% 08. SINGLE-STREAM vs. NON-RESIDENTIAL 744 46% 09. SINGLE-STREAM vs. NEW YORK 800 98%
10. BAN vs. FOOD WASTE 718 71%
11. BAN vs. NON-RESIDENTAL 716 46%
12. BAN vs. NEW YORK 779 96%
13. FOOD WASTE vs. NON-RESIDENTIAL 683 23%
14. FOOD WASTE vs. NEW YORK 678 94%
15. NON-RESIDENTIAL vs. NEW YORK 761 97% Note: Number of respondents = 956, Total Number of Observations = 11,543
31
Table 6: Logit Estimation Results
FPL1 FPL2 PML1 PML2 HHCOST (β2) -0.179 -0.180 -0.709 -0.973 (-0.011) (0.011) (0.043) (0.055) SINGLE-STREAM (α1) m 0.396 0.322 1.838 1.875 (0.051) (0.053) (0.183) (0.194) s 4.851 4.786 (0.246) (0.237) BAN (α2) m -0.214 -0.241 -1.190 -0.808 (0.055) (0.058) (0.153) (0.238) s 6.898 8.046 (0.291) (0.394) FOOD WASTE (α3) m -0.391 -0.440 -1.708 -2.014 (0.066) (0.072) (0.202) (0.249) s 5.585 6.710 (0.249) (0.330) NON-RESIDENTIAL (α4) m 0.751 0.754 3.019 3.892 (0.085) (0.085) (0.290) (0.329) s 5.397 6.910 (0.235) (0.388) NEW YORK (α5) m -3.743 -3.489 -15.415 -20.960 (0.120) (0.126) (0.481) (0.940) s 6.417 11.695 (0.247) (0.577) RECRATE (β1) m 0.040 0.040 -2.045a -1.936a (0.005) (0.005) (0.065) (0.129) s 1.123a 0.625a (0.021) (0.068) ∆CANSIZE (γ1) -0.528 -3.119 (0.065) (0.238) ∆RECTIME (γ2) -0.210 -0.919 (0.040) (0.146)
Log Likelihood at convergence -5289.854 -5246.486 -3601.938 -3551.485
Pseudo-R2 0.339 0.344 0.550 0.556
Notes:
Standard errors are reported in parentheses. All estimates are significant at the 0.01 significance level. Number of respondents = 956; Number of observations = 11,543,
Number of simulated draws = 150 Halton. Results were produced in NLOGIT 4.0.
aIn the PML models, m and s represents the mean and standard deviation of ln(β 1).
32
Table 7: Intrinsic Utility Distributions
PML 1 PML 2
Program Negative Positive Negative Positive
SINGLE-STREAM 35% 65% 35% 65%
BAN 57% 43% 54% 46%
FOOD WASTE 62% 38% 62% 38%
NON-RESIDENTIAL 29% 71% 29% 71%
NEW YORK 99% 1% 96% 4%
Note: Based on point estimates of mean (m) and standard deviation (s) coefficients.
Table 8: Basic Welfare Measures for CRP Type and Community Recycling Rate Increase
FPL1 FPL2 PML1 PML2
Mean Mean Mean St. Dev. Mean St. Dev.
SINGLE-STREAM $2.22 $1.79 $2.59 $6.85 $2.31 $5.89
BAN -$1.20 -$1.34 -$1.68 $9.74 -$0.99 $9.90
FOOD WASTE -$2.19 -$2.44 -$2.41 $7.88 -$2.48 $8.26 NON-RESIDENTIAL $4.20 $4.19 $4.26 $7.62 $4.79 $8.51 NEW YORK -$20.95 -$19.38 -$21.76 $9.06 -$25.80 $14.40
↑RECRATE (one percentage point) $0.22 $0.22 $0.34a $0.77 $0.22a $0.18 Note: Welfare measures are computed at coefficient point estimates and are reported in terms of WTP per household per month.
33
Table 9: Simulated Population WTP Distribution for Increased Community Recycling Rate
1 Percentage Point 20 Percentage Points
Percentile PML 1 PML 2 PML 1 PML 2 2.50% $0.02 $0.05 $0.40 $1.03 10% $0.04 $0.08 $0.87 $1.58 25% $0.09 $0.12 $1.71 $2.31 50% $0.18 $0.18 $3.65 $3.54 75% $0.39 $0.27 $7.80 $5.49 90% $0.77 $0.41 $15.46 $8.25 97.5% $1.67 $0.66 $33.30 $13.28 Mean WTP $0.34 $0.22 $6.90 $4.45
Table 10: Descriptive Statistics for Individual-Specific Parameters and Socioeconomic Variables
Variable Description Mean St. Dev. Min Max
αn1 SINGLE-STREAM utility parameter 1.72 3.75 -7.61 10.66
αn2 BAN utility parameter -0.90 5.57 -15.03 14.15
αn3 FOOD WASTE utility parameter -1.69 4.21 -16.03 11.30
αn4 NON-RESIDENTIAL utility parameter 2.91 4.22 -10.07 13.27
αn5 NEW YORK utility parameter -15.72 3.09 -26.94 4.55
MALE Indicator for male respondent 0.47 0.50 0.00 1.00
AGE Age of respondent 48.96 14.12 18.00 94.00
EDU Respondent years of education 16.56 2.58 6.00 22.00 HHINC Household income ($1000) 84.74 39.22 12.50 150.00
34
Table 11: Linear Regression Results for Individual-Specific Intrinsic Utility Parameters
SINGLE-STREAM BAN FOOD WASTE NON-RESIDENTIAL NEW YORK
CONSTANT 5.383 5.007 -1.817 -1.272 -1.798 -1.472 3.330 4.583 -13.547 -14.014 (5.464) (5.034) (-1.245) (-0.872) (-1.636) (-1.314) (3.023) (4.156) (-16.453) (-16.957) ∆CANSIZE -1.355 -1.320 -1.071 -0.964 -0.702 -0.547 (-2.924) (-2.925) (-3.543) (-3.208) (-3.726) (-2.956) ∆RECTIME -0.698 -0.799 -2.196 -1.871 -0.015 -0.016 -0.097 -0.010 (-2.997) (-3.473) (-6.450) (-5.548) (-1.430) (-1.532) (-0.716) (-0.076) AGE -0.015 -0.009 -0.010 -0.019 -0.042 -0.041 -0.038 -0.037 -0.009 -0.007 (-1.621) (-1.017) (-0.785) (-1.450) (-4.247) (-4.103) (-3.798) (-3.730) (-1.269) (-0.940) EDUCATION -0.210 -0.192 0.153 0.119 0.160 0.126 0.081 -0.010 -0.084 -0.058 (-4.331) (-3.869) (2.148) (1.639) (2.968) (2.243) (1.486) (-0.180) (-2.084) (-1.416) MALE -0.086 -0.144 0.248 0.436 -0.752 -0.594 -0.134 0.176 0.300 0.129 (-0.357) (-0.601) (0.700) (1.236) (-2.802) (-2.192) (-0.492) (0.652) (1.496) (0.648) HHINC 0.004 0.002 -0.009 -0.006 -0.003 -0.002 0.002 0.002 -0.001 -0.001 (1.236) (0.597) (-1.852) (-1.338) (-0.936) (-0.561) (0.529) (0.580) (-0.217) (-0.448) Green Consumer -0.383 0.623 0.246 0.330 -0.464 (-3.220) (3.582) (1.836) (2.469) (-4.716)
Private Tech. Constraint 0.492 -0.904 -0.271 -0.304 0.508
(4.209) (-5.222) (-2.059) (-2.309) (5.212) General Altruism -0.016 0.230 0.207 0.901 -0.130 (-0.126) (1.252) (1.465) (6.388) (-1.249) Resource Scarcity -0.211 0.150 0.490 0.347 -0.229 (-1.791) (0.871) (3.685) (2.620) (-2.349) External Motivation -0.183 0.565 0.109 -0.102 -0.061 (-1.486) (3.148) (0.790) (-0.736) (-0.597) Technological Optimist 0.383 -0.513 -0.319 -0.197 0.269 (3.078) (-2.850) (-2.297) (-1.419) (2.636) Free-Rider Awareness -0.381 0.360 0.064 0.211 0.027 (-3.204) (2.064) (0.480) (1.581) (0.273) Adjusted R2 0.03 0.07 0.05 0.11 0.05 0.07 0.02 0.07 0.02 0.07 F-Statistics 6.39 7.29 9.58 7.44 9.20 6.58 5.71 8.01 3.53 6.53 Significance Level 0.0000 0.0000 0.0000 0.0000 0.0000 0.0000 0.0000 0.0000 0.0018 0.0000
35
35
36
37
38
38
1 SP methods include contingent valuation, choice experiments, and contingent (conjoint) ranking/rating preference
elicitation approaches.
2 Seattle is well-known for successful recycling programs, both in terms of resident propensity to participate in them
and relative cost-effectiveness. The hypothetical programs in the contingent rating experiment represented changes to the existing Seattle recycling system, which were under considerations by the City’s policymakers and planners to achieve improvements in the community recycling rate.
3 Most of these studies use contingent valuation methods to study WTP for curbside recycling programs. Exceptions
are Tiller et al. (1997) who examine the value of drop-off recycling and Kinnaman (2000) who looks at combined (curbside and drop-off) recycling services. Caplan et al. (2002) use a contingent ranking approach to elicit preferences across three policy options and derive WTP measures per gallon of waste diverted. Several of these studies have also looked at WTP differences between users and non-users. For example, Tiller et al. (1997) differentiate between rural recyclers, rural non-recyclers, and suburban recyclers, whereas Bohara et al. (2007) jointly estimate household decisions to reduce garbage container size and WTP for curbside recycling services.
4 Only households living in housing units that would give access to the curbside recycling program and be charged
volume-based fees on waste disposal (primarily single-family households) were eligible for this survey. There are about 150,000 such households in Seattle.
5
The questionnaire contained five parts with multiple questions in each. The first part sought to quantify current recycling and waste disposal behavior. The second part asked experimentally varied contingent valuation questions. The third part contained the contingent rating experiment analyzed in this paper. The fourth part gathered detailed data on individual and household characteristics, while the fifth part elicited various attitudes and information on other household activities potentially related to environmental preferences.
6
Curbside recycling programs had come under increasing scrutiny at the time, partly based on their fiscal costs. The most highly publicized case was the City of New York, which placed a moratorium on glass and plastic collection in its residential recycling program in 2001 (hence, the label NEW YORK here). A policy reversal with full services resumed took place in April 2004. Nevertheless, it is believed that many other U.S. communities may have followed suit. The underlying cost-benefit analysis behind such decisions typically ignores the non-market value consumers may place on recycling programs and assumes that markets are fully efficient in signaling resource scarcity and landfill externalities.
7 The survey also contained a contingent valuation experiment directly eliciting willingness to pay for the existing
curbside recycling program (included in half of the questionnaires) and questions eliciting actual behavior (that can be used in revealed preference analysis).
8
Pre-testing the experiment indicated that the large majority of potential participants were very familiar with the current system, establishing that parsimonious informational treatment would suffice in terms of describing the five hypothetical programs (see Appendix 1).
9 Only participants who answered all questions in the rating experiment section of the survey are included in the
econometric analyses of this paper. This yielded usable data on 956 respondents.
10
About 85% expressed a favorable opinion of the current recycling system, whereas 5% had a neutral opinion and 10% had an unfavorable opinion.
11 Based on focus groups and personal interviews during the design phase of the survey, it was concluded that
SINGLE-STREAM and RESIDENTIAL would be inconsequential to waste disposal behavior and that NON-RESIDENTIAL would not affect recycling effort/time at the household level.
12 At the time of the survey, the City of Seattle provided the following trash collection services: Micro-Can
(12-gallon), $10.05/month; mini-can (20-(12-gallon), $12.35/month; 1-can (32-(12-gallon), $16.10/month; 2-can (64-(12-gallon), $32.20/month. Each additional 32-gallon was charged an incremental fee of $16.10/month.
13 The results reported in this paper are qualitative robust across various data-coding and estimation strategies
explored as part of preliminary data explorations and robustness checks. Moreover, the reported WTP estimates for improving the community recycling rate are also quantitatively robust over various approaches, including the censored rank-ordered approach proposed by Layton and Lee (2006). These robustness findings (which are consistent with results in Bond et al., 2010) will be the focus of a methodological companion paper.
14 All tied scores are discarded since they contain no ordinal preference information. Layton and Lee (2006) propose
a method for including ties.
15 These parameters have n subscripts because they may vary across people, while the attribute variables have n