August 2017
Tax delinquent farm land in Iowa
Ronald C. Bentley
Iowa State College
John P. Himmel
Iowa State College
Follow this and additional works at:
http://lib.dr.iastate.edu/bulletin
Part of the
Agricultural Economics Commons
This Article is brought to you for free and open access by the Extension and Experiment Station Publications at Iowa State University Digital
Repository. It has been accepted for inclusion in Bulletin by an authorized editor of Iowa State University Digital Repository. For more information,
please contact
digirep@iastate.edu
.
Recommended Citation
Bentley, Ronald C. and Himmel, John P. (2017) "Tax delinquent farm land in Iowa,"
Bulletin: Vol. 28 : No. 325 , Article 1.
Available at:
http://lib.dr.iastate.edu/bulletin/vol28/iss325/1
AGRICULTURAL EXPERIMENT STATION
IOWA STATE COLLEGE OF AGRICULTURE
AND MECHANIC ARTS
R . , E. B U C H A N A N , D I R E C T O R A G R I C U L T U R A L E C O N O M I C S S E C T I O N
282
S IG N IF IC A N T P O IN T S
Iowa farm land area involved in tax delinquencies has increased from 4
million acres in 1929 to 12 million acres in 1933.
Farm real estate taxes delinquent during the collection year have increased
from $3,553,54.4 in 1929 to a peak o f $11,674,457 in 1932. T h e delinquent
taxes for 1933 showed a total o f $10,374,201, a slight reduction from the
peak year.
Outstanding delinquency carried over into the new tax list books has in'
creased from $72,278 in 1929 to $5,406,265 in 1933— a 6 9 'fold increase.
T h e delinquent tax problem is most acute in the north central and the
Missouri valley cash grain areas and the southern pasture area.
T h e two
livestock feeding areas are intermediate with the dairy section showing the
lowest o f all.
There is a'striking inverse relationship between the postponement in tax
sales and the increasi in outstanding delinquency as o f Dec. 31.
Taxes have taken an increasing percentage o f the gross farm income be'
ginning in 1928 witlk 16 to 20 percent and reaching a peak o f 38 to 40
percent in 1932.
Assessed valuation expressed as a percentage o f farm real estate value has
increased from 45'52 percent in 1928 to 66'75 percent in 1932.
Low value
land is assessed relatively higher than high value land.
G L O S S A R Y
Levy Year
— Taxes are levied sometime between A u g. 15, the date all local
budgets must be certified to the county auditor, and Dec. 31, the date tax
lists must be delivered to the county treasurer.
These taxes are to be cob
lected the following year.
Collection Year—
Taxes may be paid any time after the first M onday in
January following the levy year, and until the first M onday o f December,
which is the Tax Sale Date.
Tpctalimpnf Delinquency
— Taxes becom e delinquent and carry penalty in
two approximately equal installments as o f April 1 and Oct. 1.
Outstanding Delinquent Taxes
— Taxes that are not paid voluntarily, or
by means o f tax sale during the collection year are carried over into the next
year’s tax list books.
This carryover includes all unpaid taxes from former
years.
Tax Sale—
Tax sale, according to law, is held on the first M onday in De-
cember o f the collection year, following due notice and publication for a period
o f 3 weeks.
For more detailed information see Paragraphs 7244'6 Iowa
Code, 1927.
TAX DELINQUENT FARM LAND IN IOWA
By R
onaldC. B
entleyand J
ohnP. H
im m eliThe purpose of this bulletin is two-fold: (1) To make avail
able statistical data which summarize the problem of unpaid
taxes on Iowa farm real estate for the years 1929 to 1933 in
clusive;2 and (2) to set forth and comment briefly upon some
of the apparent economic relations that bear upon the amount,
character and geographical variations in tax delinquency.
Twenty-seven percent of the farm real estate taxes payable
in 1933 became delinquent. These delinquent taxes totaled more
than $10,000,000.
Even more serious than the current de
linquency problem, however, was the accumulation of unpaid
taxes of former years. These unpaid taxes are mute evidence
of the recent critical economic position of Iowa agriculture.
The collapse of farm income was the chief and immediate
cause responsible for the extraordinary increase in tax de
linquencies. A number of additional factors, however, were
contributory. (1) The traditional reliances of state and local
taxing districts for a large proportion of their revenue upon
the property tax. The relatively large tax burden, according
ly, carried by real estate intensified the strain occasioned by
the price and income dislocation brought about by the depres
sion.
(2) The increased demand for public services, and the
resultant need for more revenue to support governmental
agencies furnishing such services, gave rise to a tax load on
farm real estate virtually twice as heavy as that levied during
the pre-war years.
(3) The overcapitalization cif farm real
estate engendered by the short post-war inflation and the sub
sequent downward recapitalization and resulting liquidation,
led, especially after 1930, to a situation in which many farmers
who had apparent title to farm property were uncertain when
* Project 80 of the Iowa Agricultural Experiment Station.
Dr TT G w Utt e , i
f TeatlJ
appreciate the suggestions and criticisms made byBrindie^nfro^fnr n/T?ong heifdT ° / t-he Agricultural Economics Section; J. H
nf , r ° f Research, Interim Committee, and the cooperation of each
°f th.e individuals affiliated with Federal Project 6 throughout thestate nationafnw 1* ^ .or\ which this study is based were obtained as part of a
With sponsored by the Bureau of Agricultural Economics
and l a n d T l w 1106 -f CWA help data on farm real estate delinquencj^ taxTaies
1929-iqrf S i 18.
%
every county of the state were collected for the yearsdirection Pr°Ject was supervised and the tabulations were made under the
284
their mortgage would be foreclosed. This uncertainty as to
ownership status was directly responsible for much of the in
difference toward keeping up tax payments.
(4) Another
contributory factor, one that explains some of the differentia)
variations in tax delinquency within the state, is the unequal
tax load borne by the several types of farming areas relative
to the level of productivity existing in each area. (5) Within
a given taxing district unequal assessments also have added to
the criticalness of the tax delinquency problem.
F A R M L A N D A R E A D E L IN Q U E N T IN T A X E S
Iowa has over 212,000 farms comprising an area slightly
in excess of 34 million acres. During the year 1932, the peak
year of current tax delinquencies, there were more than 102,000
pieces of property on which owners failed to meet their tax
payments on time. These delinquent properties represented
over 12
m illion
acres, or approximately 35 percent of the farm
land in the state.
This unprecedented delinquency declined
somewhat in 1933 as to number of properties; however, the
percentage of total land area on which taxes were unpaid
changed little, as is shown in Table 1. For 1929-1933, farm land
involved in tax delinquency increased three-fold, from 4 mil
lion to 12 million acres.
A surprisingly high concentration of delinquency occurred
in some townships and relatively little in others. One town
ship, in 1933, showed as high as 81 percent of its land area de
linquent, while others reported as low as 1 percent. Figure 1
helps one to visualize the extent and distribution of delin
quency and its increase for the 5-year period. A complete pic
ture of unpaid farm real estate taxes by counties is shown
in table 1 of the Appendix.
O U T S T A N D IN G D E L IN Q U E N T T A X E S 3
While the 250 percent increase in current delinquency from
1929 to 1932 showed the pressure of economic depression, the
more significant and alarming fact was the accumulation and
carrying forward of unpaid taxes of not only the current year
but also of previous years. Total taxes unpaid at the close of
the collection year (Table 2) increased from .2 percent in
285
1929-1933.
Year of collection1
Number of Percentage of Number of acres
of land on which all land on which Percentage of taxes were delinquent8 farm properties all farm properties
on which taxes
became delinquent2 were delinquent
on which taxes taxes became delinquent 1929. 1930. 1931. 1932. 1933. 36,761 40,750 53,503 102,643 89,410 17.47 19.54 29.68 48.36 42.13 4,117,798 4,597,181 7,458,221 12,175,703 12,075,831 12 13 27 36 35
1929, to 14 percent of the total levy in 1933, or a 69- fold in
crease for the five years.
Tax sales further reflect economic conditions and the atti
tude of the public toward them. AYhile there was no legisla
tion suspending tax sales, each year fewer counties held sales.
There is a close relation between the postponement of tax
sales and the increase in outstanding delinquency.
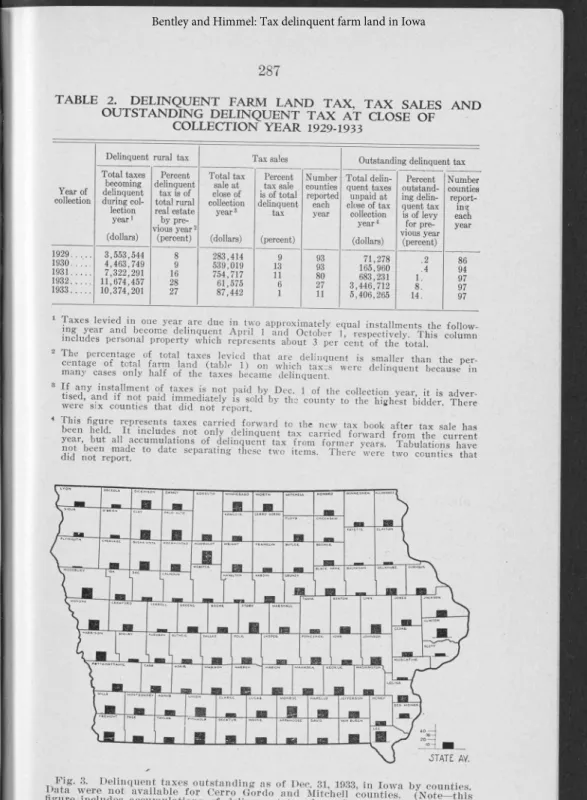
The distribution of tax delinquency geographically within
286
the state and the accelerated rate of increase are shown in fig.
2. The piling np of delinquent taxes by areas in the state is
shown in fig. 3. Actual delinquent tax sales and outstanding
delinquency by years for each county are shown in table 1 of
the appendix.
F A R M R E A L E S T A T E T A X D E L IN Q U E N C IE S B Y
T Y P E O F F A R M IN G A R E A S
Prior to the large holdings of corporate-owned farm land in
Iowa, farm receipts were virtually the sole source of income
from which taxes on farm land could be paid. Essential, there
fore, to an understanding of the wide differences in the amount
of tax that remained unpaid in the various types' of farming
areas, is a study of the farm income structure of livestock,
grain and dairy farms.
The southern pasture area showed the largest percentage of
farm tax delinquency during the earlier years, 1929-1931, in
dicating the farm distress that existed in that area of the state
prior to the general decline in prices.
The effects of high
mortgage indebtedness, relative to the productive value of the
land, incurred during and following the World War, was a
TABLE 2. DELINQUENT FARM LAND TA X , T A X SALES AND
OUTSTANDING DELINQUENT T A X A T CLOSE OF
COLLECTION YEAR 1929-1933
Year of collection
Delinquent rural tax Tax sales Outstanding delinquent tax Total taxes becoming delinquent during col lection year1 (dollars) Percent delinquent tax is of total rural real estate by pre vious year2 (percent) Total tax sale at close of collection year3 (dollars) Percent tax sale is of total delinquent tax (percent) Number counties reported each year Total delin quent taxes unpaid at close of tax collection year4 (dollars) Percent outstand ing delin quent tax is of levy for pre vious year (percent) Number counties report ing each year 1929... 1 9 3 0 ... 1931 ... 1932 ... 1933 ... 3,553,544 4,463,749 7,322,291 11,674,457 10,374,201 8 9 16 28 27 283,414 539,019 754,717 61,575 87,442 9 13 11 6 1 93 93 80 27 11 71,278 165,960 683,231 3,446,712 5,406,265 .2 .4 1. 8. 14. 86 94 97 97 97
in t? k yea r are d u e in tw o a p p rox im a tely equal in stallm en ts the fo llo w -in g y ear an d b e co m e d e l-in q u en t , A p r il 1 and O cto b e r 1, resp ectiv ely T h is colu m n in clu d e s p erson al p ro p e rty w h ich rep resen ts abou t 3 p er ce n t o f the l o t a l .
2
T h e p ercen tage o f total taxes le v ie d that are d e lin q u en t is sm aller than the n e rcen ta g e o f total fa rm lan d (ta b le 1) on w hich t a x is w e re d X n q u e n t becauseP in m any cases o n ly h a lf o f the taxes b ecam e delin qu en t.
* tL H nyo i" sta’ lme)nt o f t.a x es is n o t paid b y D e c. 1 o f the co lle ctio n y ea r, it is ad ver- w e re s ix cou n tfesPThat1” M n o t rep ort K g C0Unty t0 W b id d e r' T h e re
4
Deen held, b een i T I u e h H e ^ ^ t Ki t in clu d e s n ot o n ly d elin q u en t tax ca rried fo rw a r d f r o m the cu rre n tg ) B i ji t0 the ne-w tax b ook a fte r ta x sale has n 1 tr’h bUt a11 a ccu m u la tion s o f d e lin q u e n t tax fro m f o r m e r years. T a b u la tion s have d fd n ot r e ^ r t 6 separatln ^ these tw o item s. T h e re w ere tw o c o u n t s thatPig. 3. Delinquent taxes outstanding as of Dec. 31, 1933, in Iowa by counties
J l0t
available for Cerro Gordo and Mitchell counties. (Note—this^nc^u<fes accumulations of delinquent tax from former years and is ex
288
contributing factor to the distress that already was apparent in
southern Iowa prior to 1930.4
The two livestock feeding areas of the state had the lowest
percentage of delinquency and with the exception of 1933
remained in relatively the best condition.
See table 3 and
fig. 4. The dairy and cash grain areas held a position between
the southern pasture and livestock areas until 1932 when
some interesting changes took place. The cash grain area in
1932 and 1933 showed the highest delinquency in the state,
even more than the southern pasture area by 4 percent, in
1932, and 2 percent, in 1933. Up until 1933, the dairy area
had more delinquency than either of the two livestock feeding
areas.
As already indicated, in order to explain the wide differences
in the level of unpaid farm real estate taxes for the several
types of farming areas of the state, it is necessary to examine
the year to year variations in farm income. The farm income
of each area is closely related to the prices which producers
received for their products.
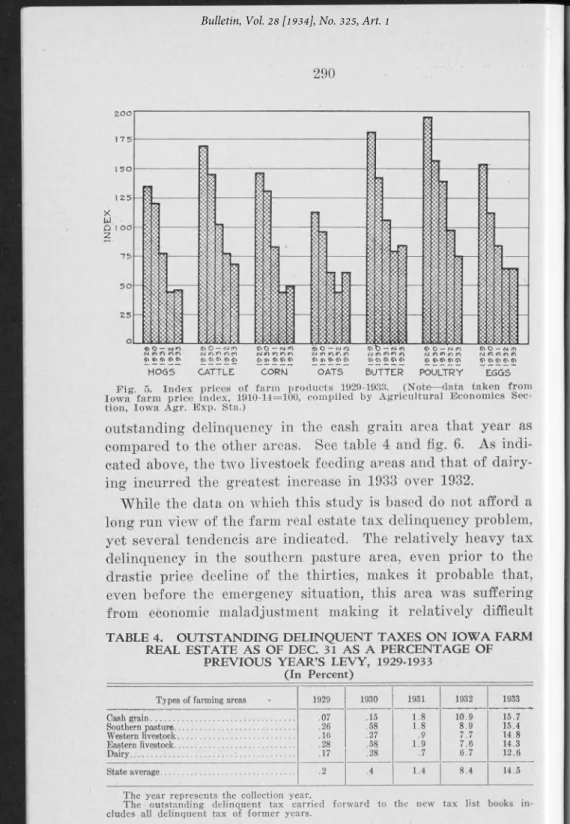
The decline of farm prices of the principal agricultural prod
ucts of Iowa is shown in fig. 5. In 1930, the prices of all com
modities dropped, but, with the exception of oats, all remained
above pre-war. In 1931, farm prices, except those of cattle,
butter and poultry, fell below pre-war. Hogs and feed grain
took the greatest slump.
The cash grain area showed the
largest increase in delinquency, the southern and livestock
areas were next and the dairy area showed the least. It was
not until 1931 that tax delinquency first increased sharply—78
percent greater than in 1930.
TABLE 3. IO W A FARM REAL ESTATE DELINQUENT TAXES AS A
PERCENTAGE
OF
TOTAL TAXES LEVIED, 1929-1933 (In Percent)
Type of farming areas 1929 1930 1931 1932 1933
9 10 18 34 30 11 13 20 30 28 6 7 13 25 27 7 8 13 24 ' 25 D airy... ... 9 10 14 26 24 8 9 16 28 27
T h e y e a r in d ica tes the y e a r o f co lle ctio n . T h e 1929 c o lle c tio n s are the lev ies
of 1928, etc.
4 See studies by Murray and Bentley, circulars 1^2 and 147, for the mortgage
foreclosure situation in Iowa, Agricultural Emergency in Iowa, Agric. Exp. Sta., Iowa State College.
289
In 1932, feed grain and hog prices dropped to record lows,
far below cattle and dairy products. The 75 percent additional
increase in unpaid taxes for the state, over 1931, was concen
trated most heavily in the cash grain, livestock feeding and
dairy sections.
In 1933, all commodities strengthened slightly except cattle
and poultry. Corn prices were improved materially by the corn
loans made at the close of 1933 and it was in the cash grain
area that delinquencies decreased most heavily. The dairy and
southern pasture areas also’ improved a little, while the two
livestock feeding areas experienced a still further increase in
tax delinquency over 1932.
O U T S T A N D IN G D E L IN Q U E N T T A X E S B Y A R E A S 5
Measured in unpaid taxes, the accumulative effect of 3 years
of falling agricultural prices reached its peak in 1932. De
linquent taxes -outstanding, including unpaid taxes carried for
ward from previous year or years, increased greatly. The most
striking pyramiding of unpaid past taxes was recorded in the
cash grain area/ The improvement of feed grain prices in 1933,
however, was reflected in the relatively smaller increase in
290
Fig 5. Index prices of farm products 1929-1933. (Note— data taken from
Iowa farm price index, 1910-14=100, compiled by Agricultural Economics Sec tion, Iowa Agr. Exp. Sta.)
outstanding delinquency in the cash grain area that year as
compared to the other areas. See table 4 and fig. 6. As indi
cated above, the two livestock feeding areas and that of dairy
ing incurred the greatest increase in 1933 over 1932.
While the data on which this study is based do not afford a
long run view of the farm real estate tax delinquency problem,
yet several tendencis are indicated. The relatively heavy tax
delinquency in the southern pasture area, even prior to the
drastic price decline of the thirties, makes it probable that,
even before the emergency situation, this area was suffering
from economic maladjustment making it relatively difficult
TABLE 4.
OUTSTANDING DELINQUENT TAXES ON IO W A FARM
REAL ESTATE AS OF DEC. 31 AS A PERCENTAGE OF
PREVIOUS YEAR’S LEVY, 1929-1933
(In Percent)
Types of farming areas 1929 1930 1931 1932 1933 Cash grain... .07 .15 1.8 10.9 15.7 Southern pasture... .26 .58 1.8 8.9 15.4 Western livestock... .16 .27 .9 7.7 14.8 Eastern livestock... .28 .58 1.9 7.6 14.3 Dairy... . ... .17 .28 .7 6.7 12.6 State average... .2 .4 1.4 8.4 14.5
T h e y e a r rep resen ts the collection year.
T h e ou tsta n d in g d elin q u en t ta x ca rrie d fo rw a r d to the n ew tax lis t b o o k s in clu d e s all d e lin q u e n t tax o f f o r m e r years.
for farmers in southern Iowa to pay taxes. It is quite appar
ent that the cash grain area, because of the relatively greater
decline of corn and oat prices, experienced the greatest price
and income dislocations attributable to the agricultural emer
gency. That the cash grain area suffered the severest shock
from the price decline which started in 1930 is evident from
the fact that this area which had the lowest delinquency in
1929 and 1930 recorded the highest percentage of outstanding
delinquent taxes in 1932 and 1933. In contrast, the dairy area
withstood the agricultural emergency better than any other
area, measured in terms of unpaid farm real estate taxes. Farm
prices of butter declined relatively less than other farm com
modity prices affecting Iowa farm income.
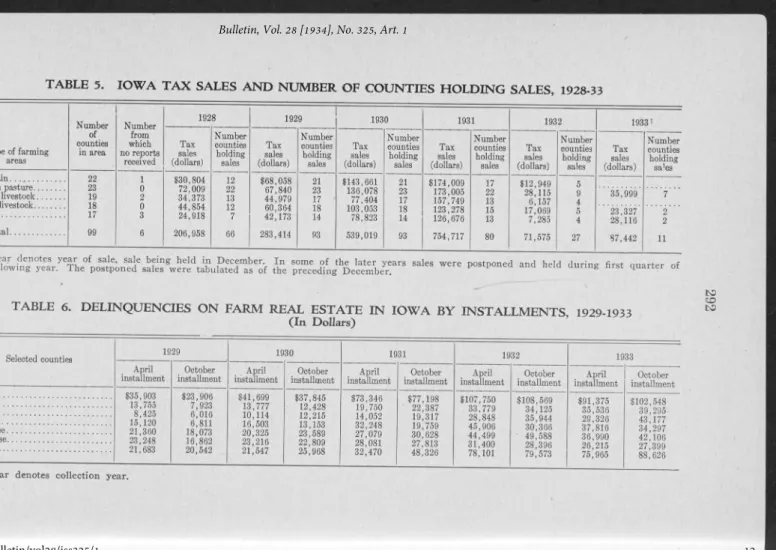
With the exception of 1930, tax sales were highest in the
southern pasture area throughout the 5-year period (table 5).
Outstanding tax delinquency undoubtedly would have been
much higher in southern Iowa had it not been for tax sales,
which were in part responsible for corporate owners taking
title to much land which was arear in interest and principal
payments. These corporate owners subsequently kept the taxes
paid on land they acquired.6 Although the rapid increase in
6 Murray and Bentley, Corporate owned land in Iowa, Bui. 307, Iowa Agr.
TABLE 5. IO W A T A X SALES A N D NUMBER OF COUNTIES HOLDING SALES, 1928-33
Type of farming areas Number of counties in area Number from which no reports received 1928 1929 r 1930 1931 1932 19331 Tax salas (dollars) Number counties holding sales Tax sales (dollars) Number counties holding sales Tax sales (dollars) Number counties holding sales Tax sales (dollars) Number counties holding sales Tax sales (dollars) Number counties holding sales Tax sales (dollars) Number counties holding sales Cash grain... Southern pasture... Western livestock... Eastern livestock... Dairy... State total... 22 23 19 18 17 99 1 0 2 0 3 6 330,804 72,009 34,373 44,854 24,918 206,958 12 22 13 12 7 66 368,058 67,840 44,979 60,364 42,173 283,414 21 23 17 • 18 14 93 3143,661 136,078 77,404 103,053 78,823 539,019 21 23 17 18 14 93 3174,009 173,005 157,749 123,278 126,676 754,717 17 22 13 15 13 80 312,949 28,115 6,157 17,089 7,285 71,575 5 9 4 5 4 27 35,999 23,327 28,116 87,442 7 2 2 11 Y ea r den otes y e a r o f sale, sale b e in g h eld in D ecem b er,the fo llo w in g y ea r. T h e p o s tp o n e d sales w e re tabulated as o f the p r e ce d in g D e ce m b e r.I n som e o f the la te r years sales w e re p ostp on ed an d held d u r in g first q u a rte r o f t o
TABLE 6. DELINQUENCIES O N FARM REAL ESTATE IN IO W A BY INSTALLMENTS 1929-1933
^
(In Dollars)
Selected counties 1929 1930 1931 1932 1933
April installment
October
installment installmentApril October installment
April
installment installmentOctober April installment October installment April installment October installment S tory... ... Adams... 335,90313,755 8,425 15,120 21,360 23,248 21,683 323,906 7,923 6,016 6,811 18,073 16,862 20,542 $41,699 337,845 12,428 12,215 13,153 23,589 22,809 25,968 373,346 19,750 14,052 32,248 27,079 28,081 32,470 377,198 ' 22,387 19,317 19,759 30,628 27,813 48,326 3107,750 3108,569 391,375 3102,548 Carroll... 33,779 34,125 35,536 39,295-Audubon... 28,848 35,944 29,326 43,177 Allamakee... 45,906 44,499 31,400 78,101 30,366 37,816 34,297 Appanoose... ' 49,588 36,990 42,106 Harrison... 21,547 28,396 26,215 27,399 79,573 75,965 88,626 Y e a r d en otes c o lle c tio n y ea r.
corporate-owned land in southern Iowa resulted in the payment
of taxes on land so held, it is not meant that such ownership
is desirable, either to agriculture or to the community.
While tax sales were not large in the dairy section, they
continued throughout the period and were a factor in keeping
unpaid taxes at a relatively low level in northeastern counties.
For the state as a whole, tax sales reached their peak in 1931
and were a factor in holding the outstanding delinquency at a
relatively low figure in that year.
(Table 4)- By 1932, the
severity of delinquent taxes led to a temporary postponement
of sales in some counties, while in others— 66 counties—no sales
were held that year. By 1933, only 11 counties held tax sales.
T IM E A N D M E T H O D O F C O L L E C T IO N
A .
Installment Delinquency
7
During the collection year 1929, each of the 7 couiities, which
have been tabulated and summarized in detail had more taxes
delinquent following the first half due date, than after the sec
ond half.8 Prior to the general decline in prices, it apparently
was easier to meet taxes in the fall than in the spring months.
In 1930, four of the seven counties had a higher delinquency
on April 1 than on Oct. 1. In the following 2 years five of the
seven counties recorded more delinquent taxes after the second
installment due date than at the. close of the first installment
due date. In 1933, only one of the counties studied had more
delinquent taxes on April 1 than- it had Oct. 1. (Table 6)
. Table 6 again brings out clearly the adverse economic pres
sure of reduced farm income. Farmers were not only pressed
for funds at the time when the first installment was due, but
with falling prices many of them were still unable to pay at
the time the fall payment came due.
Others who found it
possible to pay the first tax installment, because of falling
prices, could not raise sufficient funds to meet the second pay
ment.
B.
Penalties and Rates of Interest on Delinquent Taxes
The increasing length of time that delinquent taxes on farm
real estate stay on the books of the county treasurer is another
7 See glossary for- a definition of “ Installment delinquency”, page 282. 8 These seven counties are: Story, Adams, Carroll, Audubon, Allamakee, A p panoose and Harrison. These counties are probably fairly representative of the state. The same county data are available for the remainnig counties, but tab ulating was suspended due to the exhaustion of project funds.
294
indicator of the unfavorable economic pressure on farmers.
Since the penalty against delinquent taxes was, until the col
lection year 1933, 1 percent per month (now % of 1 percent
per month) it is possible to compute the average length of time
taxes were delinquent by dividing the total penalty by the
amount of taxes delinquent. Table 7 shows the penalties paid
for each installment and the average number of months each
penalty was in effect. In 1929 and 1930 the second installment
of taxes was paid before or on the sale date. In both years
taxes due March 31, were permitted to run from 5 to 8 months
past the due date.
Beginning with the 1931 collection year, many counties start
ed postponing sales and by 1932 many counties not only post
poned, but did not hold tax sales. In 1932, the first tax install
ment ran 7 to 10 months past the due date, which means, that
in some cases, the 1931 taxes were carried into 1933. The sec
ond tax installment for 1932, in most cases, were carried over
into the following year.
In 1933, the penalty assessments dropped below the 1932
level. This decrease came as a result of a lowering of the pen
alty interest rate, from 1 percent to
%
of 1 percent per month.
If the interest rate is computed on a comparable base with the
earlier years the penalties were as large and the number of
months that delinquent taxes incurred penalty interest charges
is approximately the same as in 1932. Data covering the sec
ond half of 1933 are not comparable with those for 1932 since
the survey was completed in January, 1934, and accordingly it
was not possible to determine the length of time that 1933
delinquent taxes were carried.
R E A L E S T A T E L E V IE S A N D A SS E SSE D V A L U A T I O N
The" amount of governmental services has increased. The
revenue required to furnish such services, however, had not
declined nearly as much as did farm income. The disparity
between farm income and the'tax burden placed on real prop
erty along with the inequitable distribution of assessment has
forced many farm properties on the delinquent tax roll.
Using cash rent as an index of gross income, it was found
that taxes took progressively larger percentages of the gross
farm income. In 1928, taxes absorbed from 16 to 19 percent
1929 1930 1931 1932 1933 April October April October April October April October install- Rate install- Rate install- Rate install- Rate install- Rate install- Rate install- Rate install- Ttate install- Rate
ment ment ment ment ment ment ment ment ment ment
(dollars) (dollars) (dollars) (dollars) (dollars) (dollars) (dollars) (dollars) (dollars) 2,613 7.2 354 1.5 2,308 5.6 674 1.8 4,797 6.6 2,399 3.2 10,046 9.3 6,701 6.2 5,457 6.0 2,427 2.4 '732 5.3 160 2.0 1,033 7.5 299 2.3 1,153 5.9 610 2.7 2,552 7.6 1,432 4.2 2,143 6.0 892 2.3 461 5.5 110 1.8 500 4.9 214 1.8 789 5.6 436 2.3 2,213 7.6 1,400 3.9 1,674 5.7 822 1.9 886 5.9 105 1.5 892 5.4 196 1.5 1,990 6.2 959 4.8 3,418 7.5 1,725 5.7 2,164 5.7 873 2.5 1,173 5.5 324 1.8 1,208 6.0 369 1.6 1,589 5.9 646 2.1 2,955 6.7 1,387 2.8 2,186 5.9 906 2.2 1 '254 5.4 4 1 4 2.5 1,544 6.7 586 2.6 1,699 6.1 805 2.9 1,972 7.0 983 3.4 1,493 5.7 681 2.5 Harrison... 1,285 6.0 462 2.2 1,475 6.9 601 2.3 2,261 7.0 1,371 2.8 5,737 7.4 3,899 4.9 4,317 5.7 2,052 2.3
T h e y e a r den otes the c o lle c tio n year.
T h e rate f o r the y e a r 1929 t o 1932 in d ica te s th e a v era g e n u m b e r o f m onths ta x es w e re d elin q u en t. F o r 1933 the rate m ust be in cre a se d by % to sh ow n u m b er o f m on th s.
to C O
296
of the gross income as expressed by the adjusted cash rent.
By 1932, from 38 to 40 percent of the gross income was required
to pay these taxes. See table 8 and fig. 7.
Another measure of the disparity between farm income and
the tax burden placed on farm property is a comparison of tax
es and farm prices. Figure 8 shows the steady climb in gov
ernmental services as reflected in higher taxes during and fol
lowing the war, reaching a peak in 1922, one year after the
tremendous fall in farm commodity prices.
A. Millage Rates
In general, millage rates increase from 1928 to 1930 and
then decreased for the years 1931 and 1932. For the first 3
years of the period, the cash grain area had the highest millage
rate. In 1931 and 1932 the cash grain area shifted into third
place and the southern pasture and eastern feeding areas took
first and second place, respectively. (See table 9.)
The tax on a given farm or in a given area is computed by
multiplying the millage rate by one-fourth the assessed val
uation.9 If an increase or decrease in revenue is needed, the
adjustment takes place within these two factors.
fftt 'W '90 31 31
STATE. AVERAGE
Pig. 7. Percentage taxes consume of contracted rent by type of farming
area 1928-1932. (Note— year denotes year of levy. Prom 1930 to 1933 con
tracted rents have been adjusted— see footnote table 8.)
8 In 1933 this method was changed. Now the assessment is multiplied by the millage rate.
Types of fanning areas Cash grain... Eastern livestock . Western livestock. Southern pasture.. Dairy... f-State average... Y e a r d en otes ta x l e v y y ea r. 1928 1929
Tax Adjusted Percent Tax Adjusted per . cash rent tax is per cash rent acre per acre of rent açre per acre 1.47 8.12 18.1 1.56 8.26 1.43 8.23 17.4 1.53 8.13 1.34 8.23 16.3 1.46 8.35 1.11 6.30 17.6 1.19 6.36 1.08 6.46 16.7 1.17 6.54 1.32 7.47 17.7 1.40 7.53 1930 1931
Percent Tax Adjusted Percent Tax Adjusted per cash rent tax is per cash rent acre per acre of rent acre per acre of rent 18.9 1.58 7.12 22.2 1.38 4.82 28 6 18.8 1.50 7.11 21.1 1.34 4.82 27 8 17.5 1.45 7.21 20.2 1.26 4.88 25 8 18.7 1.17 5.51 21.2 1.04 3.73 27 9 17.9 1.25 5.65 22.2 1.09 3.83 28.5 18.6 1.38 6.55 21.5 1.21 4.42 27.4 1932 Tax per acre 1.22 1.21 1.19 .97 .99 1.12 Adjusted cash rent per acre 3.14 3.14 3.18 2.43 2.49 Percent tax is of rent 38.8 38.6 37.8 40.0 39.8 39.0
le a v in g o n ly farm r e a l 'e s t a t e f ^ ann uaI reP° rt the S ta te B o a rd o f A ssessm en t R e v ie w . P e rso n a l a n d co rp o ra te ta x was elim in a ted ,
U . SC Dh 5l * Ü S ? i r c o S S r f r t t ? ' S “ li° ” ° f A g “ o ltl“ 1 E — o m it* , I o w a A g rie n ltu ra l E x p e r im e n t S ta tio n , f r o m data co m p ile d b y the on iS S . i ? ™ T “ ef T n d £ 8 n ™ b e m 29 “ « » « * • b u t those f o r 1930, 1931 a n d 1932 w e re a d ju s te d b y the slid in g scale p r in cip le based
M illa rd P e ck , P la n t o r a d ju s tin g cash re n t to ch an ges in the p rice s o f fa rm p rod u cts. B u i. 295. I o w a A g r. E x p . Sta.
to
C D
298
TABLE 9. AVERAGE MILLAGE LEVIES ON FARM REAL ESTATE
IN IO W A BY TYPES OF FARMING AREAS, 1928-1932
Types of farming areas 1928 1929 1930 1931 1932 80.11 87.07 86.39 82.89 77.22 79.32 86.49 85.72 81.03 75.53 83.58 89.44 89.94 82.19 72.47 76.35 83.08 83.14 78.13 71.27 76.08 82.87 81.94 74.69 70.24 D ata ob tain ed f ro m an n u a l rep ort o f B o a rd o f A ssessm en t an d R e v ie w . Y e a r den otes y ea r o f levy.
B. Assessed Valuations
Assessments did not increase from 1928 to 1930 as did mill-
age rates; in fact, there was a decrease in some areas of the
state. With assessments remaining the same and governmental
services increasing,10 the only way to raise the desired revenue
was to increase the millage rate.
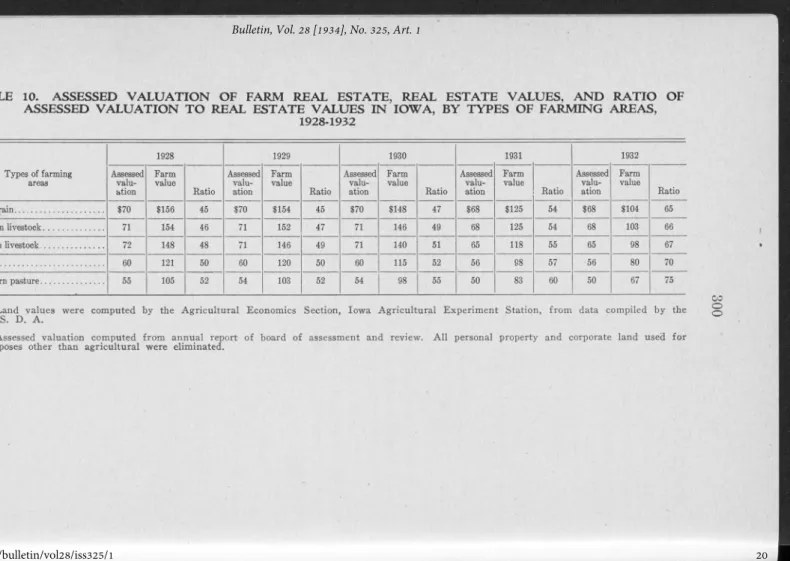
Although assessed value showed some decrease throughout
the 5-year period, it by no means kept pace with the decline in
land values (table 10). Assessed valuations dropped from 3
to 10 percent while land values tumbled 31 to 36 percent dur
ing the years 1929 to 1933.
The ratio of
assessed valuation
to
land value
reveals the
relatively greater tax burden placed upon the low producing
U.S.D.A. 1934 Farm Price Index prepared by Agr. Econ. Section, Iowa Agr. Exp. Sta.)
areas of the state. Table 10 shows that in 1928 the southern
pasture and the dairy areas, had the highest assessment in com
parison to land value. By 1932 these two areas show a still
higher ratio, the assessments were 75 to 70 percent of the land
value, respectively, whereas the other areas ranged from 65 and
67 percent.
The areas which recorded the greatest reduction in assess
ment, from 1928 to 1932, also showed the least reduction in mill-
age rate. In other words, in those areas where land values
dropped most— southern, eastern and dairy areas— assessors
found it advisable to reduce assessments, but the millage rate
was not lowered.
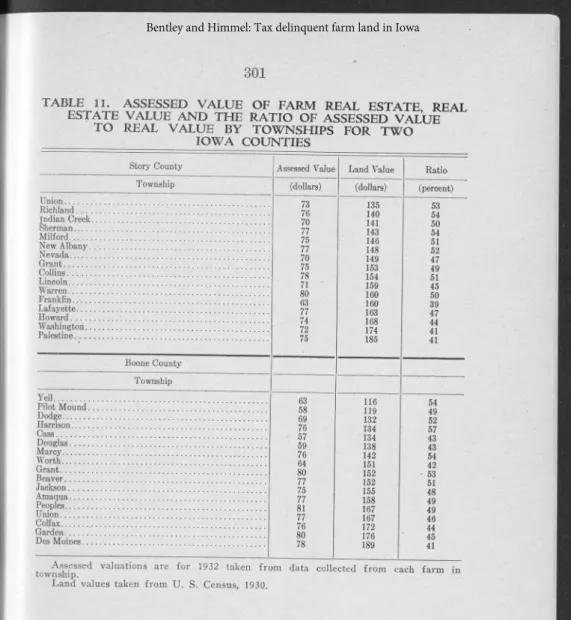
The relative over-assessment of poor land and the under
assessment of high-producing land is shown more clearly by
using a smaller area. Two counties: Story and Boone, have
been studied in detail, as shown in table 11. The low land
value townships have a high ratio and the high land value
townships a low ratio. The data appearing in table 11 warrant
careful study, since they throw light on the county assessment
problem. Within both counties the less valuable land is as
sessed at a relatively higher figure than is the more valuable
farm land.
TABLE 10. ASSESSED VALU ATIO N OF FARM REAL ESTATE, REAL ESTATE VALUES, A N D RATIO OF
ASSESSED VALU ATIO N T O REAL ESTATE VALUES IN IO W A, BY TYPES OF FARMING AREAS,
1928-1932
Types of fanning areas 1928 1929 1930 1931 1932 Assessed valu ation Farm value Ratio Assessed valu ation Farm value Ratio Assessed valu ation Farm value Ratio Assessed valu ation Farm value Ratio Assessed valu ation Farm value Ratio Cash grain... $70 $156 45 $70 $154 45 $70 $148 47 $68 $125 54 $68 $104 65 Western livestock... 71 154 46 71 152 47 71 146 49 68 125 54 68 103 66 Eastern livestock... 72 148 48 71 146 49 71 140 51 65 118 55 65 98 67 Dairy... 60 121 50 60 120 50 60 115 52 56 98 57 ■56 80 70 Southern pasture... 65 105 52 54 103 52 54 98 55 50 83 60 50 67 75L a n d v a lu e s w e re co m p u te d b y the A g ric u ltu ra l E c o n o m ic s S e c tio n , I o w a A g ric u ltu ra l E x p e r im e n t S ta tion , f r o m data co m p ile d b y the §
U . S. D . A . '
A ssessed v a lu a tion c o m p u te d f r o m an n u a l rep ort o f b oa rd o f assessm en t a n d rev iew . A l l p erson al p rop erty an d co rp ora te la n d u sed f o r p u rposes oth er than a g ricu ltu ra l w e re elim in ated.
TABLE 11. ASSESSED VALUE OF FARM REAL ESTATE, REAL
ESTATE VALUE AND THE RATIO OF ASSESSED VALUE
TO REAL VALUE BY TOWNSHIPS FOR T W O
IO W A COUNTIES
Story County Township Union... Richland... Indian Creek... Sherman... Milford... New Albany. .■... Nevada... Grant... Collins... Lincoln... Warren... Franklin... Lafayette... Howard... Washington... Palestine... Boone County Township Yell... ... Pilot M ound... Dodge... Harrison... Cass... ... Douglas... Marcy... Worth... ... Grant... Beaver... Jackson... . ... Amaqua... Peoples... U nion.. : ... Colfax... ... Garden... Des Moines...Assessed Value Land Value (dollars) 63 58 69 76 57 59 76 64 80 77 75 77 81 77 76 80 78 (dollars) 135 140 141 143 146 148 149 153 154 159 160 160 163 168 174 185 116 119 132 134 134 138 142 151 152 152 155 158 167 167 172 176 189 Ratio (percent) 53 54 50 54 51 52 47 49 51 45 50 39 47 44 41 41 54 49 52 57 43 43 54 42 53 51 48 49 49 46 44 45 41 A sse sse d va lu a tion s are f o r 1932 taken f r o m data eolle cte d f r o m each fa rm in tow n sh ip.
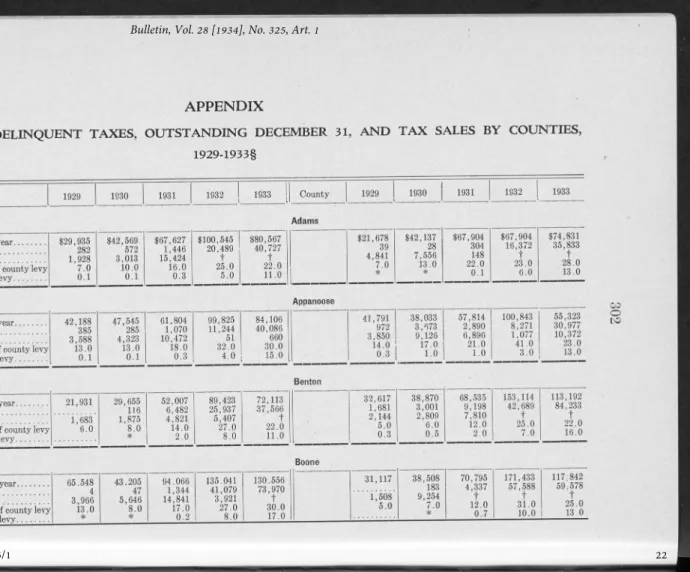
APPENDIX
TABLE 1. TOTAL DELINQUENT TAXES, OUTSTANDING DECEMBER 31, AN D T A X SALES BY COUNTIES,
1929-1933§
County 1929 1930 1931 1932 1933 I County 1929 1930
1
1 1931 1932 1933Adair Adams
Total tax delinquent during the year... Total tax unpaid Dec. 3 1 ... .. Percent total tax delinquency is of county levy Percent unpaid tax is of county le v y ...
$29,935 282 1,928 7.0 0.1 $42,569 572 3,013 10.0 0.1 $67,627 1,446 15,424 16.0 0.3 $100,545 20,489 t 25.0 5.0 $80,567 40,727 i 22.0 11.0 $21,678 39 4,841 7.0 * $42,137 28 7,556 13.0 * $67,904 304 148 22.0 0.1 $67,904 16,372 t 23.0 6.0 $74,831 . 35,833 ü 28.0 13.0 Allamakee Appanoose
Total tax delinquent during the year... Total tax unpaid Dec. 31... Percent total tax delinquency is of county levy Percent unpaid tax is of county levy...
42,188 385 3,588 13.0 0.1 47,545 285 4,323 13.0 0.1 61,804 1,070 10,472 18.0 0.3 99,825 11,244 51 32.0 4.0 84,106 40,086 660 30.0 15.0 41,791 972 3,850 14.0 0.3 38,033 3,673 9,126 17.0 1.0 57,814 2,890 6,896 21.0 1.0 100,843 8,271 1,077 41.0 3.0 55,323 30,977 10,372 23.0 13.0 Audubon Benton
Total tax delinquent during the year... Total tax unpaid Dec. 31... Percent total tax delinquency is of county levy Percent unpaid tax is of county levy...
21,931 1,683 6.0 29,655 116 1,875 8.0 * 52,007 6,482 4,821 14.0 2 .0 89,423 25,937 5,407 27.0 8.0 72,113 37,566 t 22.0 11.0 32,617 1,681 2,144 5.0 0.3 38,870 3,001 2,809 6.0 0.5 68,535 9,198 7,810 12.0 2.0 153,114 42,689 t 25.0 7.0 113,192 84,233 t. 22.0 16.0
Black Hawk Boone
Total tax delinquent during the year... Total tax unpaid Dec. 31... Percent total tax delinquency is of county levy
65.548 4 3,966 13.0 43.205 47 5,646 8.0 94.066 1,344 14,841 17.0 135.041 41,079 3,921 27.0 130.556 73,970 t 30.0 31,117 1,508 5.0 38,508 183 9,254 7.0 70,795 4,337 t 12.0 171,433 57,588 t 31.0 117,842 59,578 t 25.0
3
0
2
Bremer Buchanan
Total tax delinquent during the year... Total tax unpaid Dec. 31... $ 8,835 240
1,602 3 .0 0.1 $13,714 568 2,196 4.0 0.2 $22,899 4,018 4,496 5.0 1.0 $53,391 23,992 88 17.0 8.0 $49,642 37,525 t 19.0 14.0 $46,520 33 $48,800 $73,898 563 $117,69625,395 $92,1361 ,26,375 Percent total tax delinquency is of county levy
Percent unpaid tax is of county levy... 11.0* 11.0 16.00.1 30.00.6 24.07.0
Suena Vista Butler
Total tax delinquent during the year... Total tax unpaid Dec. 31... Tax sales... Percent total tax delinquency is of county levy Percent unpaid tax is of county levy...
22,595 30,752 75,152 181,595 175,659 25,300 26,254 52,841 94,412 73,571 515 66,087 95,641 145 8 759 29r758 1 39,994 2,722 3,115 14,253
i
t 2,920 4,050 13,070 t t 4.0 5.0 12.0 34.0 36.0 6.0 5.0 i i . o 26.0 22.0 0.1 12.0 20.0 * 0.2 8 .0 12.0 Calhoun Carroll ^Total tax delinquent during the year... Total tax unpaid Dec. 31... Tax sales... Percent total tax delinquency is o f county levy Percent unpaid tax is of county levy...
15,552 1,249 3 .0 22,920 1,497 4.0 58,592 1,315 7,816 11.0 0.3 124,864 17,844 t 27.0 4.0 105,040a 33,354 t 29.0 9.0 14,441 75 803 4.0 * 22,329 379 1,287 5.0 0.1 33,369 1,618 1,621 8.0 0.4 64,792 12,965 97 18.0 4.0 Ç ) 72,443 CO 21,223 t 23.0 7.0 Cass Cedar
Total tax delinquent during the year... 28,864 48,448 64,368 110,144 Total tax unpaid Dec. 31... 37 2,069 156 12,535 Tax sales... 869 1,994 9,285 t Percent total tax delinquency is of county levy 7.0
io.o
Í3.0 26.0 Percent unpaid tax is of county levy... * 0.4 * 3.0104,8483 25,490 27,918 58,096 109,815 117,683 58,565 101 82 5,504 13,965 47,055
t 1,970 946 536 301 t
27.0 .5 .0 5.0 11.0 23.0 26.0
15.0 * * 1.0 3 .0 10.0
Cerro Gordo Cherokee
Total tax delinquent during the year.. Total tax unpaid Dec. 31... Tax sales... Percent total tax delinquency is of county levy Percent unpaid tax is ot county le v y ..
42,946 65,223 5,639 9.0 20,844 14.0 76,734 80,531 46,9854 17,260 35,108 63,107 115,211 121,485 . 556 83 196 396 5,179 44,004 77,581 t t t 1,922 4,158 ' 11,195 126 t 16.0 20.0 13.0 3.0 6.0 Í0.0 22.0 25.0 1.0 * * 0.7 0.8 8.0 16.0
3
0
3
County 1929 1930 1931 1932 1933 County 1929 1930 1931 1932 1933
Chickasaw Clarke
Total tax delinquent during the year... Total tax unpaid Dec. 31... Tax sales...; ... Percent total tax delinquency is of county levy Percent unpaid tax is of county levy...
$28,499 85 3,662 9.0 * $48,341 5,658 15.0 • ~
---$37,964 821 10,694 12.0 0.3 $66,963 11,223 3,225 23.0 4.0 $54,371 26,277 t 21.0 10.0 $36,617 1,192 3,609 15.0 0 5 $54,254 3,148 3,221 20.0 1.0 $73,563 14,186 953 27.0 5 .0 $71,274 26,127 4,614 31.0 11.0 $56,624 17,414 2,397 27.0 8.0 Clay ClaytonTotal tax delinquent during the year... Total tax unpaid Dec. 31... Tax sales... ... Percent total tax delinquency is of county levy Percent unpaid tax is of county levy...
75,246 560 4,408 15.0 0.1 75,779 1.480 12,043 14.0 0.3 118,083 2,464 i 7,673 21.0 0.4 194,976 49,662 t 42.0 10.0 143,093 90,027 t 35.0 22.0 25,793 435 1,604 5.0 0.1 31,284 1,199 2,123 6.0 0.2 35,667 2,750 4,682 7.0 0.6 76,187 10,464 t 17.0 2.0 79,405 26,328 t 19.0 6.0 Clinton Crawford_______________ _______ ' ______ <W
Total tax delinquent during the year... Total unpaid tax Dec. 31.. ... Tax sales... Percent total tax delinquency is of county levy Percent unpaid tax is of county levy...
56,944 4,122 6,203 9.0 0.7 83,534 8,968 11,914 12.0 1.0 131,292 25,100 19,451 20.0 4.0 176,235 60,376 5,576 31.0 11.0 190,675 114,395 1,942 34.0 20.0 59,790 58 1,836 10.0 * 81,970 358 3,644 12.0 0 .1 126,640 1,360 16,497 20.0 0.2 163,620 31,811 t 30.0 6.0 165,8805 86,192 t 33.0 17.0 Dallas Davis
Total tax delinquent during the year... Total tax unpaid Dec. 31... Tax sales... Percent total tax delinquency is of county levy Percent unpaid tax is of county levy...
40,559 470 4,045 6.0 0.1 58,299 1,069 9,184 8.0 0.1 113,744 15,028 t 16.0 2.0 210,004 86,167 I 33.0 14.0 149,088 76,918 t 30.0 15.0 39,945 1,533 2,824 15.0 0.1 54,917 4,476 6,318 19.0 2.0 83,117 7,666 13,183 30.0 3.0 89,864 24,476 t 39.0 11.0 74,637 28,372 t 33.0 13.0 Decatur Delaware
Total tax delinquent during the year... Total tax unpaid Dec. 3 1 ...
42,201 173 60,587 124 75,757 4,607 17,185 87,904 30,280 1,350 76,163 45,545 t 53,091 5,791 3,873 66,466 9,614 7,306 86,992 7,835 11,145 123,229 38,363 i f 113,007 60,190 t
Des Moines Dickinson
Total tax delinquent during the year... Total tax unpaid Dec. 31... Tax sales... Percent total tax delinquency is of county levy Percent unpaid tax is of county levy...
$30,365 830 1,664 9.0 0.2 $36,874 1,805 1,879 10.0 0.5 $45,817 1,591 8,065 13.0 0.5 $75,634 13,315 5,085 24.0 4.0 $75,058 28,863 r 23.0 9.0 | $30,489 297 3,055 10.0 0.1 $37,011 867 3,497 12.0 0.3 $71,481 20,508 13,235 22.0 6.0 $99,026 41,824 144 35.0 15.0 $83,405 56,562 t 31.0 20.0 Dubuque Emmet
Total tax delinquent during the year... Total tax unpaid Dec. 31...
43,722 1,135 52,830 263 73,294 5,693 121,230 31,938 129,060« 64,008 38,247 44 2,443 12.0 * 48,830 713 ' 5,595 14.0 0.2 86,554 1,020 20,399 24.0 0.3 117,927 35,948 t 35.0 11.0 94,864 40,323 t 32.0 14.0 Percent total tax delinquency is of county levy
Percent unpaid tax is of county levy... 10.0 0.3 12.0 0.6 17.0 1.0 31.0 8.0 33.0 16.0 Fayette Floyd
Total tax delinquent during the year... Total tax unpaid Dec. 31...
61,080 61 3,820 11.0 * 68,780 170 5,864 11.0 * 104,920 860 17,995 17.0 0.1 150,320 8,968 t 28.0 2.0 102,8607 21,144 27,456 23.0 5.0 26,776 333 2,319 7.0 0.1 26,757 480 7,435 7.0 0.1 36,494 391 10,149 9.0 0.1 87,986 23,438 t 27.0 7.0 80,303 51,522 t 26.0 17.0 Percent total tax delinquency is of county levy
Percent unpaid tax is of county levy...
Franklin Fremont
Total tax delinquent during the year... 28,913 32,646 218 16,425 6.0 * 79,213 1,264 t 15.0 0.2 169,327 34,844 t 39.0 8.0 136,161 51,490 t 32.0 12.0 37,780 811 2,494 7.0 0.2 47,494' 580 1,189 8.0 0.1 95,186 5,005 6,313 16.0 0,9 167,166 59,372 527 33.0 12.0 155,071 91,913 t 34.0 20.0 5,074 6.0 * Percent total tax delinquency is of county levy Percent unpaid tax is of county levy...
Greene Grundy
Total tax delinquent during the year... 28,090 111 1,722 5.0 * 43,334 474 6,229 7.0 0.1 73,302 9,166 544 12.0 2.0 175,739 55,454 4,599 35.0 11.0 124,835 64,388 t 28.0 14.0 16,875 20,048 175 785 5.0 0.1 47,100 5,308 2,833 10.0 1.0 120,585 41,467 t 36.0 12.0 94,182 46,821 t 32.0 17.0 Tax sales...
Percent total tax delinquency is of county levy Percent unpaid tax is of county levy...
304 5.0 *
CO
County 1929 1930 1931 1932 1933 County 1929 1930 1931 1932 1933
Guthrie Hamilton
Total tax delinquent during the year... $50,200 136 $58,695 1,116 4,579 11.0 0.2 $107,831 7,440 15,483 20.0 1.0 $156,941 43,818 t 34.0 9.0 $112,466 44,129 t 27.0 11.0 $41,866 $57,445 141 $98,251 279 $174,770 1,376 t 37.0 3.0 $131,094» 36,283 t 30.0 8.0 Tax sales...
Percent total tax delinquency is of county levy Percent unpaid tax is of county levy...
3,243 10.0 * 5,474 8.0 * 23,890 11.0 * 988 18.0 0.5 Hancock Hardin
Total tax delinquent during the year... Total tax unpaid Dec. 3 1 . . . . ...
41,201 271 2,614 61,190 569 6,173 14.0 0.1 81,943 4,554 13,481 19.0 1.0 127,937 39,781 t 85,154 41,427 t 31,168 460 4,554 6.0 0.1 47,823 1,313 2,091 9.0 * 95,902 12,063 2,653 19.0 2.0 177,240 50,286 3,132 37.0 10.0 135,519 68,405 f Percent total tax delinquency is of county levy
Percent unpaid tax is of county levy... i o .o 0.1 31.0 10.0 27.0 13.0 33.0 16.0 Harrison Henry
Total tax delinquent during the year... Total tax unpaid Dec. 31...
51,440 1,036 7,000 10.0 0.2 51,640 2,713 2,865 10.0 0.5 82,913 7,599 20,479 16.0 1.0 171,900 40,357 t 34.0 8.0 179,2609 106,897 29,870 331 858 38,131 2,021 2,788 10.0 0 .6 46,359 4,646 2,779 13.0 1.0 83,266 20,109 t 85,510 29,688 3,864 28.0 10.0 Percent total tax delinquency is of county levy
Percent unpaid tax is of county levy...
36.0 21.0 8.0 0.1 25.0 6.0 Howard Humboldt
Total tax delinquent during the year... 28,942 493 38,388 1,043 39,359 3,980 69,717 17,434 54,253 I 27,235 24,896 460 30,329 620 69,397 8,002 11,867 20.0 2.0 125,210 54,507 93,334 72,557 2,664 2,529 61 t
Percent total tax delinquency is ot county levy Percent unpaid tax is of county levy...
10.0 0.2 12.0 0.3 13.0 1.0 27.0 7.0 24 .0 1 12.0 | '8 .0 0.2 0.29.0 45.020.0 39.030.0 Ida Iowa
Total tax delinquent during the year... 9,900 11,232 9 54,360 3,007 15,937 102,216 18,021 t 88,2121» 50,494 1 32,149 41,432 134 54,527 904 80,183 11,895 97,561ii 47,364 t 1,237 765 4,630 8,997 6,249 t
3
0
6
Jackson Jasper
Total tax delinquent during the year... Total tax unpaid Dec. 31... Tax sales... $ 1,782 831 1,327 $ 5,486 3,576 2,982 $ 9,779 9,089 2,885 $16,886 23,456 t $35,850 47,604 t $57,432 3,465 4,849 $68,235 6,837 8,415 $125,964 24,362 23,339 $159,926 55,594 t $147,598 63,296 t 26.0 Percent total tax delinquency is of county levy 0.5 1.0 2.0 5.0 12.0 6.0 9.0 Í7.0 25.0 Percent unpaid tax is of county levy... 0.3 0.9 2.0 8.0 15.0 0.4 0.9 3.0 9.0 11.0
Jefferson Johnson
Total tax delinquent during the year... Total tax unpaid Dec. 31... Tax sales... Percent total tax delinquency is of county levy Percent unpaid tax is of county levy...
29,022 115 1,814 9.0 *
...
43,346 972 4,026 12.0 0.3 51,901 3*, 342 5,074 16.0 1.0 81,870 21,045 t 29.0 7.0 66,405 39,446 t 25.0 15.0 82,688 3,243 2,726 16.0 0.6 51,051 7,845 5,841 9.0 1.0 77,929 17,980 1,207 14.0 3.0 110,371 54,309 t 22.0 11.0 115,725 79,397 t 26.0 18.0 Jones KeokukTotal tax delinquent during the year... Total tax unpaid Dec. 31... Tax sales... ... Percent total tax delinquency is of county levy Percent unpaid tax is of county levy...
29,657 512 3,665 7.0 0.1 36,020 1,315 2,531 8.0 0.3 58,612 9,010 2,292 12.0 2.0 98,553 26,687 t 22.0 6.0 89,647 50,174 t 23.0 13.0 18,940 2,192 2,566 4.0 0.5 29,773 5,088 4,153 6.0 0.9 51,989 13,114 9,109 10.0 3.0 101,175 40,047 t 22.0 9.0 130,897 82,152 t 31.0 19.0 Kossuth Lee
Total tax delinquent during the year... Total tax unpaid Dec. 31... Tax sales... Percent total tax delinquency is of county levy Percent unpaid tax is of county levy...
55,519 423 5,450 8.0 0.1 75,962 1,431 12,411 11.0 0.2 135,721 34,682 19,326 19.0 5.0 195,671 64,808 t 31.0 10.0 163,551 106,305 t 27.0 17.0 35,755 2,596 1,306 15.0 1.0 41,000 6,958 2,197 12.0 2.0 53,695 16,745 6,400 16.0 5.0 65,590 45,619 t 22.0 15.0 68.74512 68,579 t 24.0 24.0 Linn Louisa
Total tax delinquent during the year... Total tax unpaid Dec. 31... Tax sales... Percent total tax delinquency is of county levy Percent unpaid tax is of county levy...
10,937 17,137 52,663 79,138 48,855 61,264 85,680 120,927 41,861 111,442 5,492 8,887 17,617 28,450 t t 3,536 5,367 19,707 7,274 9.0 14.0 Í3.0 Ì5.0 21.0 33.0 7.0 20,0 1.0 2.0 4.0 8.0 111,818 52,057 21,385 34.0 16.0
County 1929 1930 1931 ■ 1932 1933 County 1929 1930 1931 1932 1933
Lucas Lyon
Total tax delinquent during the year... Total tax.unpaid Dec. 31...
826,736 41 1,337 11.0 * 834,648 17 2,006 13.0 * 846,715 1,001 8,349 18.0 0.4 863,314 18,841 124 25.0 8.0 854,720 36,211
t
24.0 16.0 824,223 69 1,973 6.0 * 825,546 271 15,007 6.0 0.1 843,797 1,212t
11.0 0.3 857,762 31,907t
19.0 11.0 852,256 32,658t
18.0 11.0 Percent total tax delinquency is of county levyPercent unpaid tax is of county levy...
Madison Mahaska
Total tax delinquent during the year... 76,728 92,872 124,008 154,400 124,232« 25,879 38,136 66,271 93,911 129,168 894 1,920 30,681 60,464 133 1,248 7,539 35,748 60,694 Tax sales...’ ... 4,052 7,807 12,403 2,366
t
1,352 2,864 9,477t
t
Percent total tax delinquency'is of county levy Í7.0 20.0 27.0 36.0 31.0 6.0 8.0 Ì3.0 20.0 31.0 Percent unpaid tax is of county levy... *
. .
0.2 0.4 7.0 15.0 * 0.3 0.5 8.0 15.0Marion Marshall
Total tax delinquent during the year... 10,686 25,000 41,860 95,742 100,911 30,772 47,045 88,333 161,105 148,076 Total tax unpaid Dec. 31... 630 2,108 10,277 46,671 71,369 626 569 4,745 55,475 84,273 Tax sales... 649 1,080 2,588
t
t
3,344 11,339t
t
t
Percent total tax delinquency is of county levy 2 .0 5.0 8.0 20.0 23.0 5.0 6.0 13.0 26.0 27.0 Percent unpaid tax is of county levy... 0.1 0.4 2.0 10.0 17.0 0.1 0.1 0.7 9.0 15.0
Mills Mitchell
Total tax delinquent during the year... 22,193 33,720 47,175 74,638 93,201 15,864 19,894 30,540 45,925 40.802 Total tax unpaid Dec. 31... 1,516 3,647 10,803 31,089 55,560 90 102 127 1,069 544 Tax sales... 1,811 2,966 10,457
t
t
1,711 4,775 6,049t
t
Percent total tax delinquency is of county levy 7.0 9.0 Í2.0 22.0 30.0 4.0 5.0 8.0 13.0 13.0 Percent unpaid tax is of county levy... 0.5 0.9 3.0 9.0 18.0 * * * 0.3 0.2
Monona Monroe
Total tax delinquent during the year... 47,733 57,099 118,505 171,720 147,667 27,608 35,668- 64,248 74,278 66,133 Total tax unpaid Dec. 31... 3,150 7,704 19,317 61,757 91,824 1,546 4,769 13,924 33,060 47,833 Tax sales... ... ... 7,488 5,230 36,234
t
t
1,845 3,590 5,704t
t
3
0
Montgomery Muscatine
Total tax delinquent during the year___ ____ Total tax unpaid Dec. 31... Tax sales.^... Percent total tax delinquency is of county levy Percent unpaid tax is of county levy...
$22,055 6 2,013 6.0 * $34,609 9 3,025 8.0 * $58,033 73 11,049 15.0 * $96,578 24,299 t 27.0 7.0 $90,682 47,550 t 28.0 15.0
1
$22,820 104 1,757 6.0 * $35,257 4,436 5,778 9.0 1.0 $37,471 6,982 9,171 11.0 2.0 $56,625 9,377 t 19.0 3 .0 $57,357 20,309 t 15.0 5.0 O’Brien OsceolaTotal tax delinquent during the year... 20,977 18,172 87 40,677 1,411 83,104 28,720 t 18.0 6.0 75,661 37,749 t 19.0 9.0 19,854 20 28,777226 50,178 1,764 11,688 16.0 0.6 63,596 14,237 t 22.0 5 .0 48,828 20,833 t 20.0 8.0 Tax sales...
Percent total tax delinquency is of county levy Percent unpaid tax is of county levy...
1,480 4.0 * 1,222 3.0 * 6i 040 8.0 0.3 2,230 6.0 * 6,481 9.0 0.1
Page Palo Alto
Total tax delinquent during the year... 15,579 166 28,823 211 56,879 2,906 8,636 113,409 42,367 t 108,382 62,129 f 75,635 1,284 5,208 82,705 3,384 138,848 20,293 171,574 78,163 t 141,691 101,830 t 33.0 24.0 2,723 1,496 5.0 * 81908 22;099 Percent total tax delinquency is of county levy
Percent unpaid tax is of county levy... 3.0 * Ì 1 .0 0 .6 • 25.0 9.0 26.0 15.0 Ì 6.0 0.3 Ì6.0 0.6 26.0 ' 4.0 37.0 17.0 Plymouth Pocahontas
Total tax delinquent dining the year... Total tax unpaid Dec. 31...
27,431 1,030 4,337 5.0 0.2 33,388 275 3,947 5.0 * 64,089 2,877 5,225 10.0 0.5 93,052 17,470 t 117,972 13,685 t 24.0 3 .0 34,340 60 1,462 41,072 598 4,827 8.0 0.1 88,587 9,472 7,449 17.0 2 .0 173,876 54,699 t 134,7421« 64,636 f Percent total tax delinquency is of county levy 20.0
4.0 '7 .0 * 34.012.0 35.0 17.0 Po|k Pottawattamie 148,495 509 104,090 1,650 163,470 5,940 266,445 42,723 329,915» 89,446 39,833 3,404 3,772 5.0 0.4 52,296 7,092 17,080 6.0 0.7 92,678 16,959 t 191,410 76,071 t 214,251 146,458 f Percent total tax delinquency is of county levy
Percent unpaid tax is of county levy... 20.0 0.1 14.0 0.2 19.0 0 .7 37.0 6.0 54.0 15.0 10.0 2.0 21.0 9.0 25.0 17.0
County 1929 ! 1930 1931 1932 1933 County 1929 1930 1931 1932 1933
Poweshiek Ringgold
Total tax delinquent during the year... Total tax unpaid Dec. 31... Tax sales... Percent total tax delinquency is of county levy Percent unpaid tax is of county levy...
$104,855 656 5,112 19.0 0.1 $151,912 1,705 7,106 27.0 0.3 $201,559 14,850 t 35.0 3 .0 $204,800 57,193 3,786 42.0 12.0 $167,182 74,405 t 37.0 17.0 $35,569 105 4,412 14.0 * $49,652 694 8,481 16.0 0.2 $77,517 10,711 7,019 26.0 4.0 $96,199 39,236 2,226 38.0 15.0 $101,340 66,569 8,061 40.0 26.0 Sac Scott
Total tax delinquent during the year...
Total tax unpaid Dec. 31... 19,472 26,51833 47,336 394 97,621 18,341 87,81135,842 16,88513 2,600 5.0 * 22,386 868 2,988 6.0 0.2 38,522 3,013 4,307 9.0 0.7 48,415 10,513
t
12.0 3 .0 52,511 23,555t
14.0 6.0 Tax sales... ...Percent total tax delinquency is of county levy
Percent unpaid tax is of county levy... 4 .Ó * 5 .0* 10.00.8 23.0
4.0 21.09.0
Shelby Sioux
Total tax delinquent during the year... Total tax unpaid Dec. 31... ... 14,5783
734 3.0 * 25,887 365 5,406 5.0 0.1 43,669 1,638
t
10.0 0.4 101,015 24,483t
22.0 5.0 97,370 33,067t
22.0 8.0 18,026 27 2,284 3 .0 * 21,601 208 5,470 3 .0 * 34,386 1,070t
6.0 0.2 79,633 22,011t
17.0 5.0 90,663 43,097t
20.0 10.0 Percent total tax delinquency is of county levyPercent unpaid tax is of county levy...
Story Tama
Total tax delinquent during the year...
Total tax unpaid Dec. 31... 58,999 79,54484 150,544 26,903
t
23.0 4.0 216,319 96,936t
40.0 18.0 193,905 120,625t
38.0 24.0 33,129 122. 2,053 5.0 * 45,377 516 3,044 7.0 0.1 78,874 5,671 11,469 12.0 0.9 138,765 41,444 132 27.0 8.0 115,031 44,791t
23.0 9.0 5,453 10.0 * Percent total tax delinquency is of county levyPercent unpaid tax is of county levy... 12.0*
Taylor Union
Total tax delinquent during the year... Total tax unpaid Dec. 3 1 ,... Tax sales... Percent total tax delinquency is of county levy
25,688 1,068 - 3,248 6.0 40,909 1,254 22,049 11.0 63,578 3,038 11,264 17.0 73,283 19,676
t
22.0 59,986 35,948t
21,216 437 320 31,338 259 1,711 50,048 6,731 3,756 73,612 27,846t
73,978 47,865 2,6033
1
0
Van Buren Wapello
Total tax delinquent during the year.. : ... Total tax unpaid Dec. 31... Tax sale§ ... Percent total tax delinquency is of county levy Percent unpaid tax is of county levy...
$42,994 1,461 5,319 15.0 0.5 $47,138 2,623 4,067 15.0 0.8 $64,302 6,557 3,256 21.0 2.0 $71,918 23,917 971 36.0 12.0 $59,850!« 41,728 293 28.0 19.0 $31,460 1,698 4,272 9.0 0.5 $44,990 5,158 4,919 12.0 1.0 $61,066 13,323 6,607 16.0 3 .0 $90,064 36,695
t
27.0 11.Ó $75,251 59,883t
24.0 19.0 Warren WashingtonTotal tax delinquent during the year... Total tax unpaid Dec. 31... Tdx sales... Percent total tax delinquency is of county levy Percent unpaid tax is of county levy...
46,614 638 6,884 9.0 0.1 56,811 298 18,104 11.0 0.1 159,667 2,857
t
33.0 0.6 132,955 40,926t
30.0 9.0 122,274 70,146 t 32.0 18.0 24,705 1,072 640 5.0 0.2 34,138 2,464 921 7.0 0.5 53,266 11,983 2,913 12.0 3 .0 151,098 31,587t
36.0 7.0 119,605 58,551t
28.0 14.0 Wayne WebsterTotal tax delinquent duripg the year... Total tax unpaid Dec. 31... Tax sales... ... Percent total tax delinquency is of county levy Percent unpaid tax is of county levy...
45,160 3,246 5,498 15.0 1.0 54,728 3,992 5,587 18.0 1.0 91,196 6,683 11,042 30.0 2.0 95,737 22,499 302 37.0 9.0 72,552 36,756 8 ,40§ 27.0 14.0 36,687 285 3,905 6.0 0.1 71,007 216 4,983 10.0 * 133,418 25,279 6,597 19.0 4.0 218,024 103,872
t
36.0 17.0 89,017 45,312t
18.0 9.0 Winnebago WinneshiekTotal tax delinquent during the year... Total tax unpaid Dec. 31... Tax sales... .. Percent total tax delinquency is of county levy Percent unpaid tax is of county levy...
26,912 347 2,287 9.0 0.1 34,452 1,247 3,113 12.0 0 .4 56,889 11,594 7,995 19.0 4 .0 92,174 35,040
t
35.0 13.0 75,889 55,214t
29.0 31.0 29,043 15 1,029 7.0 * 39,459 16 1,465 10.0 * 55,065 98 4,520 13.0 * 112,004 17,066t
30.0 5.0 91,468 36,358t
26.0 10.0 Woodbury WorthTotal tax delinquent during the year... Total tax unpaid Dec. 31... Tax sales... 91,250 1,954 104,935 1,434 171,011 5,702 249,172 92,968 239,438160,090 26,437230 4,153 9.0 0.1 29,234 548 4,025 10.0 0.2 38,472 1,482 10,568 13.0 0.5 78,872 41,690
t
29.0 15.0 71,331 41,690t
29.0 17.0 Percent total tax delinquency is of county levyPercent unpaid tax is of county levy... 11.0 0.2 12.00.2 20.0 0.7 35.0 13.0 35.0 24.0
County 1929 1930 1931 1932 193*3 I
Wright
Total tax delinquent during the year... ... Total tax unpaid Dee. 31... $31,45846
1,338 7.0 * $31,458 1,330 3,707
6.0
0.3 $89,642 10,154 7,90122.0
3.0 $161,471 57,297 5,013 38.0 13.0 $122,221 74,789 t 29.0 18.0 | Percent total tax delinquency is of county levyPercent unpaid tax is of county levy...
§ D e lin q u e n t ta x es m ean taxes, eith er the 1st or 2nd in sta llm en t that becam e d elin q u en t f o r o n e or m ore m on th s d u rin g the cu rre n t y ear. O utstan din g- D e c . , 31 m ean s taxes that w e re u n p a id a fte r the ta x sale an d ca rried fo rw a r d in to the n e w ta x list book s. T h is figu re in clu d e s all ' ta x es u n p a id fr o m f o r m e r yea rs. ,
* L e ss than 0.1. t N o sale. . . N o D ata.
T h e co u n tie s n o te d b elow d id n o t have co m p le te reports. T h e n u m b e r o f tow n sh ips w ere u sed f o r each o f the yea rs 1929-1933.
1 IS T o w n sh ip s 2 IS T o w n sh ip s 3 13 T o w n s h ip s 4 16 T o w n sh ip s 6 18 T o w n s h ip s 6 17 T o w n sh ip s 7 19 T o w n s h ip s 8 10 T o w n sh ip s
totals w e re estim ated f ro m the n u m b er o f tow n sh ip s listed. T h e sam e
9 19 T ow n sh ip s 10 11 T ow n sh ip s 11 ,15 T ow n sh ip s 12 12 T ow n sh ip s is 14 T o w n sh ip s 14 IS T ow n sh ip s 16 17 T ow n sh ip s 16 13 T ow n sh ip s