University of Kentucky University of Kentucky
UKnowledge
UKnowledge
Institute for the Study of Free Enterprise
Working Papers Institute for the Study of Free Enterprise 12-2016
Transaction Complexity and the Movement to Fair Value
Transaction Complexity and the Movement to Fair Value
Accounting
Accounting
Pinky RusliMontana State University, pru224@uky.edu Xinlei Zhao
University of Kentucky, xinlei.zhao@utoledo.edu David A. Ziebart
University of Kentucky, DZIEB2@uky.edu
Follow this and additional works at: https://uknowledge.uky.edu/isfe_papers Part of the Accounting Commons
Right click to open a feedback form in a new tab to let us know how this document benefits you. Right click to open a feedback form in a new tab to let us know how this document benefits you.
Repository Citation Repository Citation
Rusli, Pinky; Zhao, Xinlei; and Ziebart, David A., "Transaction Complexity and the Movement to Fair Value Accounting" (2016). Institute for the Study of Free Enterprise Working Papers. 23.
https://uknowledge.uky.edu/isfe_papers/23
This Research Paper is brought to you for free and open access by the Institute for the Study of Free Enterprise at UKnowledge. It has been accepted for inclusion in Institute for the Study of Free Enterprise Working Papers by an authorized administrator of UKnowledge. For more information, please contact UKnowledge@lsv.uky.edu.
Transaction Complexity and the
Movement to Fair Value Accounting
Pinky Rusli
Xinlei Zhao
David A. Ziebart
December 2016
Institute for the Study of Free Enterprise
Working Paper 6
University of Kentucky
244 Gatton College of Business and Economics
Lexington, KY 40506-0034
2 Rusli, Pinky, Xinlei Zhao, and David A. Ziebart. “Transaction Complexity and the Movement to Fair Value Accounting.” Schnatter Institute Working Paper. John H. Schnatter Institute for the Study of Free Enterprise, University of Kentucky, Lexington, KY, December 2016.
Abstract
Our global economy has pushed the complexity of business transactions to a new level, as companies now employ sophisticated contracts and financial instruments. However, it is unclear whether accounting standards are able to effectively capture transaction complexity, which has been growing at a rapid pace. In this study, we examine three questions related to transaction complexity: (1) Do accounting standards reflect differences in the complexity of the transactions being recorded? (2) Does the use of mark-to-market (i.e., fair value) accounting reduce the complexity of standards by relying on market valuations to capture transaction complexity? (3) Does the reliance on fair value measurements reduce audit costs for transactions with significant complexity? Our findings suggest that complex transactions result in complex accounting guidance, making the standards difficult to read and understand. However, the use of fair value accounting might be a solution to the challenges arising from transaction complexity. Our study informs regulatory bodies, investors, creditors, and public companies that are increasingly concerned about the state of financial reporting standards, which arguably have become very costly to implement yet less effective in communicating the economic substance of complex transactions.
Pinky Rusli Xinlei Zhao
Montana State University PhD Candidate
Jake Jabs College of Business and Entrepreneurship University of Kentucky
Accounting Department Gatton College of Business and Economics Bozeman, MT 59717-3040 Von Allmen School of Accountancy
Lexington, KY 40506-0034
David A. Ziebart
PwC Professor of Accountancy University of Kentucky
Gatton College of Business & Economics Von Allmen School of Accountancy Lexington, KY 40506-0034
dzieb2@email.uky.edu
Keywords: accounting standards, knowledge economy
Schnatter Institute Working Papers are circulated for discussion and comment purposes. They have not been peer reviewed through the institute. Working Papers present an author’s provisional findings, which, upon further revision, are likely to be republished in an academic journal. The opinions expressed in Schnatter Institute Working Papers reflect the views of the authors and may not represent the opinions of the Schnatter Institute or the University of Kentucky.
3 Transaction Complexity and the Movement to Fair Value Accounting
Pinky Rusli, Xinlei Zhao, and David A. Ziebart1
The knowledge economy has increased the complexity of business activities. Business
transactions have evolved from simple exchanges of goods and services to exchanges involving sophisticated contracts and financial instruments. The proliferation of complex securities and derivatives, where dramatic uncertainty and contingencies exist, makes it difficult even for the profession and practice of law (Lipshaw 2005). Furthermore, organizations have become interdependent, since they engage in integrating and coordinating business processes (Ketchen, Crook, and Craighead 2014; Larsen, Manning, and Pedersen 2013). Increased transaction complexity follows from intertwined business relationships (Zhou 2012; Ding, Dekker, and Groot 2013).
Yet, it is unclear how current accounting and reporting standards anticipate the new complexities and uncertainties of business transactions. On the one hand, complex transactions demand that accounting standards become increasingly complex as well (see, e.g., Thornton 2016). Importantly, the history and development of accounting thought, theory, and standards have been intertwined with broad economic development in a reciprocal linkage. Accounting is considered one of the oldest human recordkeeping systems and is designed to support
commerce.2 Accounting is arguably an economic institution that always evolves in response to
1 We thank the faculty and doctoral students of the Von Allmen School of Accountancy at the University of
Kentucky for their helpful feedback. We also thank Michael Ettredge, Yang Xu, and Han Sang Yi, who generously shared the variable codes and definitions from their study. Dave Ziebart gratefully acknowledges the financial support of the John H. Schnatter Institute for the Study of Free Enterprise.
2 Luca Pacioli is often hailed as the father of accounting. While he was not the inventor of the system of
double-entry bookkeeping, he was the first who described it systematically in his book, Summa de Arithmetica, Geometrica,
Proportioni et Proportionalita, published in 1494. Double-entry bookkeeping is still the basis of today’s accounting
4 market forces (Waymire and Basu 2008; Watts and Zuo 2016). As such, accounting practices and standards are expected to adapt to transaction complexity.
On the other hand, Dye, Glover, and Sunder (2015) aptly argue that formulating complex accounting standards in response to transaction complexity can be problematic. They assert that it is not feasible for accounting standard-setters to incessantly promulgate complex rules in order to win the “arms race” against the development of transaction complexity. Innovations in
transaction complexity escalate rapidly because sophisticated financial experts continuously engineer transactions to keep up with modern economies (Glode, Green, and Lowery 2012). In contrast, new accounting rules take years to develop. The development of accounting theory combined with financial reporting standards due to changes in the level of complexity underlying business transactions and activities has been somewhat simultaneous, with both theory and standards usually lagging behind the development in commerce. Accordingly, to some extent, accounting has always been playing catch-up with the underlying business transactions.
Dye, Glover, and Sunder (2015) also point out that the desire to constantly update standards may lead standard-setters to write overly detailed and complex rules that, ironically, result in suboptimal financial reporting. In a similar vein, Lev and Gu (2016) claim that accounting regulation has grown excessively complicated in response to the complexity of the business environment. They describe this phenomenon as “the Lev-Gu law of the dynamics of regulation,” which means that “regulatory systems strive to be even more complex than the structures or institutions they were charged to regulate” (2016, 221). Lev and Gu argue that the escalation of accounting complexity is a major reason for the deterioration of usefulness in accounting information. The increase in accounting complexity makes accounting information
5 difficult to decipher. At the same time, the information is losing its relevance because accounting standards are unable to capture all the nuances of business complexity (Lev and Gu 2016).
The first objective of our study is to find empirical evidence that the complexity in the underlying transactions is manifested in the complexity of the authoritative guidance used in the affiliated reporting standards.3 Our investigation draws upon a fundamental notion in systems theory, which dictates that all control mechanisms, including accounting regulation, require a more complex mechanism than the process or activity being controlled.4 Our findings support
this argument. Next, our study examines the economic consequences of accounting complexity. Specifically, we show that an audit fee premium is placed on complex transactions. In addition, we conjecture that the use of fair values for financial accounting and reporting is more effective than overly complex accounting standards to cope with the increase in transaction complexity. Supporting our hypothesis, our study suggests that the audit fee premium is mitigated when using fair values instead of complex authoritative guidance. Drawing on this finding, our study provides insights into the development of accounting standards moving toward a fair value approach.
In the following sections, we discuss a paradigm for thinking about financial accounting and reporting standards setting. Then, we elaborate on our research questions as well as describe the research processes we employed and the results we obtained. Last, we summarize our
inferences and their implications for theory and practice.
3 Sargut and McGrath (2011) differentiate between complex and complicated in a business context. They argue that
the term complicated denotes multiple components where the combination results in a predictable outcome, while
the term complex denotes an individual component or multiple components in which the outcome is much less
certain. Our definition of complexity is intended to capture both terms.
6 Theoretical Framework and Hypothesis Development
Fundamental Paradigm of Accounting Standard Setting
Since accounting is a human contrived system, accountancy theory and practice are determined by consensus regarding (1) what is to be measured, (2) when it is to be measured (recognized or
derecognized), (3) how it is measured, (4) who is the entity for which the accounting occurs, and
(5) where the element or activity takes place. While the genesis of this paradigm is uncertain,
Wallman (1995, 1996) uses a similar approach in discussing accounting and disclosure issues facing the profession. In essence, accounting and disclosure issues can be considered a question or a combination of questions regarding the following:
Issues of definition. Does the transaction result in an identifiable element that meets the
criteria needed to be an asset, liability, equity, revenue, expense, gain, loss, or income (earnings)?
Issues of timing. When does the transaction or an event result in a cue for recognition,
de-recognition, revaluation, or allocation?
Issues of measurement. If a transaction meets the definition of an element and the timing
cue is met, should the element’s value be measured based on its historical value, current value (including current entry value and current exit value), or expected future value?
Issues of reporting entity. What is the boundary that defines the reporting entity? Does
the transaction take place within the reporting entity boundary or does it span the boundary (such that it is deemed an arm’s-length transaction)? Determining the entity’s external or internal boundary may determine or impact issues of definition, timing, or measurement. For example, consolidation requires the elimination of intra-entity profits and losses (a form of derecognition).
7
Issues of geographical location. In instances where the geographical location attributable
to the transaction is important, the location may need to be determined.
Research Question 1: Transaction and Accounting Complexity
The complexity of a transaction can impact any individual issue or a combination of issues within the paradigm above. We expect that the complexity of a transaction will be manifested in the affiliated financial accounting or reporting pronouncement. To define accounting complexity, we follow the definition from the SEC’s Advisory Committee on Improvements to Financial Reporting (ACIFR), which highlights various causes of accounting complexity. One possible cause is the complex nature of business activities. Another is financial standards that enumerate detailed guidance or lack the use of simple terms (i.e., plain English) due to the challenge in describing sophisticated transactions (SEC 2008).
Based on the ACIFR’s definition, we argue that the readability level of a pronouncement captures the complexity of an underlying transaction that the pronouncement is written to cover.5
A complex transaction requires a more detailed, complex explanation in the affiliated pronouncement, making the descriptions in the pronouncement harder to explain in plain English. In contrast, simple or less complex transactions will result in simpler language for the affiliated pronouncements. Stated formally, our first research question is as follows:
5 Prior work in accounting does not offer a formal definition of accounting complexity. For example, Peterson
(2012) does not distinguish between complex accounting guidance and complex transactions, claiming that it is impossible to differentiate the two. Other studies (see, e.g., Miller 2010; Rennekamp 2012) assert that financial reports have become overly complex and challenging for an average investor to understand, but these studies do not identify or examine the sources of accounting complexity.
8 RQ1: Do accounting standards reflect differences in the complexity of the transactions being recorded? Specifically, does the complexity of a transaction manifest in its affiliated pronouncement?
Research Question 2: Transaction Complexity and Fair Value Accounting
Our contention is that the evolving complexity of transactions will continue and that
authoritative pronouncements will continue to be difficult to read and understand since writing standards to address the what, when, how, who, and where questions will require even higher
levels of readability. However, the use of mark-to-market (fair value) accounting may simplify the authoritative pronouncement, since fair values are the result of a complex process that readily addresses the difficult what, when, how, who, and where questions or issues through the invisible
hand of the market. Market values represent a consensus that spans all attributes of the underlying transactions (at least, all attributes that are known by the market participants) and readily incorporates dealing with issues of definition, timing, and measurement. Reliance on market values may greatly simplify the difficulties of writing standards since the standard will not need to provide explicit authoritative guidance regarding the issues of definition, timing, and measurement.6
To test this conjecture, we will focus our analyses on a specific pronouncement: SFAS No. 157 (Fair Value Measurements). This pronouncement defines three measurement hierarchies to value assets or liabilities. The highest is Level 1, which indicates the existence of active markets for the assets or liabilities to be valued. Accordingly, the assets or liabilities can be
6 Our conjecture is consistent with the ACIFR’s recommendation to reduce financial reporting complexity. The
committee recommends “a judicious approach to expanding the use of fair value” and staying away from the mixed attribute models, whenever possible, since the complexity often arises from using those models (SEC 2008).
9 measured reliably using quoted prices. The second level is Level 2, which indicates the existence of active markets or quoted prices for similar assets or liabilities. Level 3 is the lowest
measurement level. It requires the highest involvement because no active market is available for the specific assets or liabilities. Accordingly, the measurement is more complex than using quoted prices because it requires various assumptions, information, and a measurement approach to be defined and applied.
We expect that Level 1 should be easier to read than that of Levels 2 or 3 because Level 1 measures asset and liability values directly using market prices, avoiding complexity.
RQ2: Does the use of fair value accounting reduce the complexity of standards by relying upon market valuations to capture transaction complexity? Specifically, is the readability of Level 1 described in SFAS 157 lower than the readability of Levels 2 or 3?
Research Question 3: Transaction Complexity and Audit Fees
We argue that complex transactions increase audit fees because they are difficult for auditors to measure and verify.7 In addition, we expect that the use of fair values can mitigate the audit fee premium. Specifically, we argue that it takes less effort to audit assets and liabilities using the Level 1 measurement than to audit assets and liabilities using Level 2 or 3 measurements. This reduced audit effort will be reflected in a lower audit fee. Stated formally, our third question is as follows:
RQ3: Does the reliance upon fair value measurements reduce audit costs for transactions with significant complexity? Specifically, are the audit fees for Level 1 assets and liabilities lower than the audit fees for Level 2 or 3 assets and liabilities?
7 In June 2014, the Financial Accounting Standards Board (FASB) launched the Simplification Initiative, a series of
10 Research Methods
Question 1: Analysis of Readability of Standards and Underlying Transaction Complexity
To investigate our first and second research questions, we start by measuring the readability score of various transactions. We then employ a survey to collect responses from accounting experts. The objective of our survey is to ask experts to categorize selected transactions as either the most or the least complex transaction group. After obtaining two groups of transactions based on their perceived complexity, we analyze whether this classification corresponds to its
readability level.
Readability Scores of Pronouncements
We select 30 accounting transactions prescribed by pronouncements issued by the Financial Accounting Standards Board (FASB) from 1973 through 2009. We believe that our selection covers prevalent transactions that vary widely in the levels of transaction complexity. Then we measure the readability score of each pronouncement using the Flesch-Kincaid Index, a widely known readability measure. The Flesch-Kincaid Index is a function of two variables: average sentence length (in words) and complex words (based on the percentage of words with many syllables). The score generated by this index indicates the minimum school level appropriate for comprehending the text being measured. For example, if the Flesch-Kincaid score of a text is 10, it means that the text is best understood by average students with a 10th grade reading level and above. Table 1 summarizes the readability scores of all the pronouncements we include in our analysis.
11 Table 1: Readability Scores of Selected FASB Pronouncements
Transaction types Affiliated
pronouncement
Flesch-Kincaid
Score
Postretirement benefit obligations other than pensions SFAS 106 17.16
Financial instruments with both debt and equity characteristics SFAS 150 16.30
Compensated absences SFAS 43 15.67
Comprehensive income SFAS 130 15.64
Financial instruments SFAS 105 15.55
Business segments SFAS 14 15.28
Defined benefit pensions SFAS 35 15.27
Contributions made or received SFAS 116 15.13
Mortgage origination, mortgage-backed securities, long-term loan servicing SFAS 65 15.05
Defined benefit pensions, defined contribution pensions SFAS 87 14.98
Liability extinguishment SFAS 125 14.97
Depreciation for not-for-profit entities SFAS 93 14.77
Foreign currency translation SFAS 52 14.75
Derivative instruments SFAS 80 14.64
Business combinations SFAS 141 14.63
Related party transactions SFAS 57 14.42
Derivative instruments, hedging activities SFAS 133 14.27
Long-term obligations SFAS 47 14.18
Accounting changes, error corrections SFAS 154 14.12
Leases SFAS 13 13.89
Income taxes SFAS 96 13.85
Asset impairment, long-lived asset disposal SFAS 144 13.42
Subsequent events SFAS 165 13.37
Research and development costs SFAS 2 13.36
Revenue recognition with right of return SFAS 48 13.21
Prior period adjustments SFAS 16 12.94
Mean readability score 14.65
Table 1 shows that the mean readability score is 14.65, which indicates that accounting standards appear to be difficult to read. The most difficult pronouncement to read in our set is SFAS No. 106 (readability score = 17.16), which guides transactions related to postretirement benefit obligations other than pensions. The easiest pronouncement to read is SFAS No. 16 (readability score = 12.94), the guidance for prior-period adjustments.
12
Survey Design and Delivery
We designed our survey instrument using Qualtrics, a web-based survey tool. We used the preliminary version of our survey to run a pilot test and obtain feedback from eight doctoral students at the University of Kentucky. The purpose of the pilot test was to measure the time required to complete the survey.
Based on the responses from the pilot test, we finalized the survey instrument and invited accounting faculty members at the University of Kentucky and the University of Wisconsin-Madison to participate in our survey. We used email to distribute our survey link to faculty. The survey was administered over the Internet and was anonymous. We emailed the invitation to participate in the survey on August 1, 2016. We received the last response on August 17, 2016.
The survey asked participants to select at least 20 out of 30 transactions that participants believed they had familiarity with or knowledge of. To mitigate order effects, we randomized the order of the selection list. Given their choice sets, participants had to classify transactions into the most and the least complex transaction groups, respectively. Participants were told that each group should contain at least five transactions and that the order of the selection did not matter. We administered brief demographic questions at the end of the survey.
Summary Statistics
We received 10 responses total from both the faculty of the University of Wisconsin-Madison (response rate: 100%) and the University of Kentucky (response rate: 45%). On average, participants spent 6.16 minutes to complete the survey. Table 2 reports the demographic
13 to six years, whereas 30 percent have taught for seven years or more. Panel B of table 2 reports the participants’ self-assessment rating of their familiarity with accounting pronouncements on a scale of 1 to 7, where higher values correspond to higher knowledge and understanding. The mean (median) of rating is 4.2 (4.0), signifying that our participants view themselves to have fairly significant knowledge regarding accounting pronouncements.
Table 2: Demographic Characteristics of Survey Participants
Panel A: Participants’ teaching experience in selected accounting courses Financial accounting Managerial accounting Auditing Accounting information systems Taxation Other None 1 4 4 10 8 8 1–3 years 5 3 1 0 0 0 4–6 years 1 0 2 0 0 0 7–10 years 2 1 1 0 1 1 > 10 years 1 2 2 0 1 1
Panel B: Self-assessment of familiarity with accounting pronouncements (scale of 1 to 7; 7 is the highest)
Mean Median
14 Table 3: Survey Responses to the Question: “Select accounting transactions you are
familiar with”
Transaction % participants (total
possible n = 10)
Research and development costs 100
Asset impairment 100
Subsequent events 100
Prior period adjustments 100
Business segments 90
Long-lived asset disposal 90
Accounting changes 90
Error corrections 90
Long-term obligations 90
Related party transactions 90
Leases 80
Financial instruments 80
Business combinations 80
Post-retirement benefit obligations other than pensions 70
Comprehensive income 70
Defined contribution pensions 70
Contributions made or received 60
Liability extinguishment 60
Hedging activities 60
Revenue recognition with right of return 60
Foreign currency translation 60
Mortgage origination 60
Mortgage-backed securities 60
Income taxes 60
Derivative instruments 50
Financial instruments with both debt and equity characteristics 50
Defined benefit pensions 50
Compensated absences 40
Long-term loan servicing 40
Depreciation for not-for-profit entities 40
Survey Responses: Familiarity with Accounting Transactions
Table 3 presents the percent of participants stating their familiarity with a given accounting transaction. All participants claim that they are familiar with transactions pertaining to (1) research and development costs, (2) asset impairment, (3) subsequent events, and (4)
prior-15 period adjustments. Additionally, 90 percent of participants indicate their understanding of transactions related to (1) business segments, (2) long-lived asset disposal, (3) accounting changes, (4) error corrections, (5) long-term obligations, and (6) related party transactions. Collectively, six or more participants (out of 10 total) are familiar with 24 out of the 30 transactions listed in our survey.
Survey Responses: Transactions with the Highest Complexity
Table 4 reports the percent of participants indicating the complexity levels of a given transaction. Our survey results reveal that the most complex transactions are hedging activities (60%) and business combinations (60%). Following closely behind is financial instruments with both debt and equity characteristics (50%). Furthermore, 40 percent of our participants think that the most complex transactions are related to (1) financial instruments, (2) derivative instruments, (3) asset impairment, (4) defined benefit pensions, and (5) income taxes.
Survey Responses: Transactions with the Lowest Complexity
Seventy percent of our participants decided that the least complex transactions are those
corresponding to prior period adjustments. The results in table 4 also show that the least complex transactions are related to error corrections (60%), subsequent events (50%), and long-term obligations (50%). In addition, 40 percent of our participants believe that transactions concerning (1) research and development costs, (2) contributions made or received, (3) long-lived asset disposal, and (4) accounting changes fall into the least complex transaction group.
16 Table 4: Survey Responses to the Question: “Perceived complexity levels of accounting transactions” Transaction % highest complexity (total possible n = 10) % lowest complexity (total possible n = 10) Readability score Hedging activities 60 0 14.27 Business combinations 60 10 14.63
Financial instruments with both debt and equity characteristics
50 0 16.30
Financial instruments 40 0 15.55
Derivative instruments 40 0 14.64
Defined benefit pensions 40 0 15.27
Income taxes 40 0 13.85
Asset impairment 40 10 13.42
Postretirement benefit obligations other than pensions
30 0 17.16
Leases 20 0 13.89
Revenue recognition with right of return 20 0 13.21
Mortgage-backed securities 20 0 15.05
Foreign currency translation 20 30 14.75
Related party transactions 20 30 14.42
Accounting changes 20 40 14.12
Long-term loan servicing 10 0 15.05
Business segments 10 10 15.28
Subsequent events 10 50 13.37
Prior period adjustments 10 70 12.94
Comprehensive income 0 10 15.64
Liability extinguishment 0 20 14.97
Compensated absences 0 20 15.67
Mortgage origination 0 20 15.05
Depreciation for not-for-profit entities 0 20 14.77
Research and development costs 0 40 13.36
Contributions made or received 0 40 15.13
Long-lived asset disposal 0 40 13.42
Long-term obligations 0 50 14.18
Error corrections 0 60 14.12
Statistical Test of a Difference in Readability Levels for High and Low Transaction Complexity
To test for a difference in the pronouncement complexity of the topic areas identified as being the most complex versus those identified as being the least complex, we first computed the mean
17 of the readability score for the two groups (the most and the least complex). The mean for each group is based on at least 40 percent of the respondents identifying the topic as being the most complex or the least complex. Next, we weight the readability score by the number of
participants identifying the topic as either in their most complex or their least complex grouping. This resulted in a mean readability score of 14.78 for the most complex group and a mean readability score of 13.71 for the least complex group. The difference in means is 1.07.
To test for the statistical significance of this difference, we employ a computer intensive approach (Diaconis and Efron 1983). The use of a resampling method is quite applicable given our small number of observations, and it replaces the necessity of the Gaussian assumptions of classical statistical methods via computation power (Diaconis and Efron 1983). This “allows us to be free of the non-bell-shapeness” that may not exist in our data (Diaconis and Efron 1983, 2). We employ a “hypothesis test for a difference in means” described by Simon (1999, 38– 39). Our null hypothesis is that there is no difference in the readability scores of the transaction-associated pronouncements identified as being the most complex or least complex. In essence, we compute the probability that the observed difference in the mean readability scores for the high complexity and low complexity groups (14.78 – 13.71 = 1.07) would be observed if the two groups are drawn from the same population. We use 10,000 iterations with replacement (a bootstrap procedure) and find that the probability is less than 0.01 percent that a difference of 1.07 would be observed if both groups are drawn from the same underlying distribution. Note that this is, in essence, the type 1 error. Our choice of sampling with replacement is likely to result in a conservative type 1 error since an observation can be chosen more than once in a single iteration.
18 To answer our first question, we find that the readability levels of the accounting
pronouncements associated with the groups of transactions identified as high complexity and low complexity are significantly different, and the underlying transaction complexity is manifested in a higher readability level for the associated pronouncement. In essence, a more complex (higher reading level) pronouncement is needed for transactions that are more complex.
Question 2: Analysis of Readability of SFAS No. 157
To answer our second question, we focus our analysis on SFAS No. 157. The readability score of SFAS No. 157, Fair Value Measurements, is 14.08 for the entire pronouncement (including appendixes). For the main standard discussion, the readability score is 14.76. For the sections related to the Fair Value Hierarchy, Level 1 Inputs, Level 2 Inputs, and Level 3 Inputs, the overall readability score is 16.5. The readability scores for the specific sections regarding Level 1 Inputs, Level 2 Inputs, and Level 3 Inputs are 15.5, 17.5, and 16.7, respectively. These
readability scores significantly exceed the readability scores associated with complex topics identified in the prior section of this study, where the mean is 14.78. The findings show that the readability score of Level 1 is lower than the scores of Level 2 or Level 3.
We interpret this finding to suggest that the transactions underlying SFAS No. 157 are quite complex. This is not surprising, given that the examples discussed in the Implementation Guidance section of the pronouncement contain transactions or situations such as a business combination, in-process research and development in a business combination, asset impairment, software assets, interest rate swap and other types of derivatives, and restricted assets.
19
Question 3: Analysis of Audit Pricing Evidence Where Underlying Complex Transactions Are Accounted for Using Mark-to-Market
Overview of Analyses
We analyze two samples. One is comprised of nonfinancial companies, while the other consists of financial companies. We use two different research models to analyze the effect of fair value measurement on audit fees. First, we use Model 1 to examine the sample of nonfinancial firms following prior literature (Hribar, Kravet, and Wilson 2014; Francis, Reichelt, and Wang 2005; Ghosh and Lustgarten 2006; Bills, Lisic, and Seidel 2016) and include a fair value measure. The resulting model, including industry and year fixed effects, is specified as:
𝐿𝐿𝐿𝐿(𝐴𝐴𝐴𝐴𝐴𝐴𝐴𝐴𝐴𝐴𝐹𝐹𝐹𝐹𝐹𝐹)𝑖𝑖,𝑡𝑡 = 𝛽𝛽0+𝛽𝛽1𝐹𝐹𝐹𝐹𝐹𝐹𝐹𝐹𝑉𝑉𝐹𝐹𝑉𝑉𝑉𝑉𝑉𝑉𝑖𝑖,𝑡𝑡+𝛽𝛽2𝐵𝐵𝐴𝐴𝐵𝐵4𝑖𝑖,𝑡𝑡+𝛽𝛽3𝐹𝐹𝐵𝐵𝐹𝐹𝑖𝑖,𝑡𝑡+
𝛽𝛽4𝐿𝐿𝐿𝐿(𝐴𝐴𝐴𝐴𝐴𝐴𝐹𝐹𝐴𝐴𝐴𝐴)𝑖𝑖,𝑡𝑡+𝛽𝛽5𝐴𝐴𝐹𝐹𝑉𝑉𝑖𝑖,𝑡𝑡+𝛽𝛽6𝑅𝑅𝐹𝐹𝑅𝑅𝑖𝑖,𝑡𝑡+𝛽𝛽7𝑅𝑅𝑅𝑅𝑖𝑖,𝑡𝑡+𝛽𝛽8𝐵𝐵𝐴𝐴𝐵𝐵𝑖𝑖,𝑡𝑡+𝛽𝛽9𝐿𝐿𝐹𝐹𝑉𝑉𝑖𝑖,𝑡𝑡+
𝛽𝛽10𝐹𝐹𝐵𝐵𝐸𝐸𝐿𝐿𝐴𝐴𝑖𝑖,𝑡𝑡+ 𝛽𝛽11𝐵𝐵𝐹𝐹𝑅𝑅𝐵𝐵𝐹𝐹𝑅𝑅𝑖𝑖,𝑡𝑡+𝛽𝛽12𝐹𝐹𝐴𝐴𝐹𝐹𝑅𝑅_𝑌𝑌𝐹𝐹𝑖𝑖,𝑡𝑡+𝛽𝛽13𝑅𝑅𝑅𝑅𝐴𝐴𝑖𝑖,𝑡𝑡+𝛽𝛽14𝐿𝐿𝑅𝑅𝐴𝐴𝐴𝐴𝑖𝑖,𝑡𝑡+
𝛽𝛽15𝐴𝐴𝐴𝐴𝐴𝐴𝑅𝑅𝐸𝐸𝐴𝐴𝐹𝐹𝑖𝑖,𝑡𝑡+𝛽𝛽16𝐿𝐿𝐴𝐴𝐴𝐴𝑅𝑅𝐴𝐴𝐴𝐴𝐿𝐿𝑖𝑖,𝑡𝑡+𝛽𝛽17𝐴𝐴𝐹𝐹𝐵𝐵𝐵𝐵𝐹𝐹𝐹𝐹𝐴𝐴𝑖𝑖,𝑡𝑡+𝜀𝜀𝑡𝑡 (1) The dependent variable is Ln (AUDIT FEE), which is the natural-log-transformed value of audit
fees from the Audit Analytics database. The variables of interests are FV_TT, FV1_TA, FV2_TA,
FV3_TA, and are defined as fair-valued asset and liability amounts measured using Level 1,
Level 2, and Level 3 inputs and deflated by total assets.8
For the control variables, we include Ln(ASSETS), FGN, INV, REC, CR, BTM, LEV,
EMPLS, MERGER, and NDEC_YE to control for audit complexity and resource demands; ROA
8 We use the proportions of fair-valued assets rather than log-transformed amounts of fair-valued assets as test
variables because the correlations with control variables are much lower (Ettredge, Xu, and Yi 2014). We also run the analysis with the proportions of fair-valued assets only. In the untabulated results, we obtain similar results and inferences when we use the proportions of fair-valued assets only.
20 and LOSS control for the inherent risk related to poor performance, which leads to increased
audit effort; and LITIG, an indicator variable for industries with higher litigation risk. 9
We use Model 2 to examine the sample of financial firms specified following Ettredge, Xu, and Yi (2014) and Fields, Fraser, and Wilkins (2004) as:
𝐿𝐿𝐿𝐿(𝐴𝐴𝐴𝐴𝐴𝐴𝐴𝐴𝐴𝐴𝐹𝐹𝐹𝐹𝐹𝐹)𝑖𝑖,𝑡𝑡 = 𝛽𝛽0+𝛽𝛽1𝐹𝐹𝐹𝐹𝐹𝐹𝐹𝐹𝑉𝑉𝐹𝐹𝑉𝑉𝑉𝑉𝑉𝑉𝑖𝑖,𝑡𝑡+𝛽𝛽2𝐿𝐿𝐿𝐿(𝐴𝐴𝐴𝐴𝐴𝐴𝐹𝐹𝐴𝐴𝐴𝐴)𝑖𝑖,𝑡𝑡+𝛽𝛽3𝐹𝐹𝐵𝐵𝐹𝐹𝑖𝑖,𝑡𝑡+
𝛽𝛽4𝐿𝐿𝑅𝑅𝐴𝐴𝐴𝐴𝑖𝑖,𝑡𝑡+𝛽𝛽5𝐴𝐴𝐴𝐴𝐴𝐴𝑅𝑅𝐹𝐹𝐴𝐴𝑖𝑖,𝑡𝑡+𝛽𝛽6𝐴𝐴𝑅𝑅𝐴𝐴𝐹𝐹𝐴𝐴𝐴𝐴𝑅𝑅𝑅𝑅𝐴𝐴𝑖𝑖,𝑡𝑡+𝛽𝛽7𝐴𝐴𝐹𝐹𝑅𝑅𝐴𝐴𝑅𝑅𝐴𝐴𝐴𝐴𝐴𝐴𝐹𝐹𝐴𝐴𝑖𝑖,𝑡𝑡+
𝛽𝛽8𝐹𝐹𝐹𝐹𝐹𝐹𝐴𝐴𝑅𝑅𝐴𝐴𝐹𝐹𝐹𝐹𝑅𝑅𝑌𝑌𝑖𝑖,𝑡𝑡+𝛽𝛽9𝑅𝑅𝑅𝑅𝐵𝐵𝐵𝐵𝐿𝐿𝑅𝑅𝐴𝐴𝐹𝐹𝑖𝑖,𝑡𝑡+𝛽𝛽10𝐹𝐹𝑅𝑅𝐹𝐹𝐸𝐸𝐹𝐹𝑅𝑅𝐹𝐹𝑅𝑅𝑅𝑅𝐵𝐵𝑖𝑖,𝑡𝑡+ 𝛽𝛽11𝑅𝑅𝐶𝐶𝐵𝐵𝑅𝑅𝐹𝐹𝐹𝐹𝑖𝑖,𝑡𝑡+
𝛽𝛽12𝐵𝐵𝐴𝐴𝐵𝐵𝐿𝐿𝑅𝑅𝐴𝐴𝐹𝐹𝑖𝑖,𝑡𝑡+𝛽𝛽13𝑅𝑅𝐴𝐴𝐸𝐸𝑅𝑅𝐴𝐴𝐴𝐴𝐴𝐴𝑅𝑅𝑖𝑖,𝑡𝑡+𝛽𝛽14𝐴𝐴𝐹𝐹𝐴𝐴𝐴𝐴𝐹𝐹𝐵𝐵𝑖𝑖,𝑡𝑡+𝛽𝛽15𝐴𝐴𝐹𝐹𝐹𝐹𝐴𝐴𝐴𝐴𝐴𝐴𝐴𝐴𝑉𝑉𝐹𝐹𝑖𝑖,𝑡𝑡+
𝛽𝛽16𝐴𝐴𝐴𝐴𝑉𝑉𝐴𝐴𝐹𝐹𝐵𝐵𝐴𝐴𝑖𝑖,𝑡𝑡+𝜀𝜀𝑡𝑡 (2)
The dependent variable is Ln(AUDIT FEE), a natural-log-transformed value of audit fees.
The variables of interest are the fair-valued asset and liability amounts deflated by total assets. The control variables are proportion of transaction account (TRANSACCT), proportion of
securities (SECURITIES), efficiency ratio (EFFICIENCY), common loans (COMMLOAN),
nonperforming loans (NONPERFORM), net charge-offs (CHGOFF), capital ratio (CAPRATIO),
intangible assets (INTANG), sensitivity (SENSITIVE), and savings institution (SAVINGS). Fields,
Fraser, and Wilkins (2004) expect all the coefficients except that on SENSITIVE to be positive,
and find that the coefficients on LOGTA, BIGN, TRANSACCT, SECURITIES, EFFICIENCY,
COMMLOAN, NONPERFORM, CHGOFF, CAPRATIO, INTANG, and SAVINGS are positive
and significant at the 0.10 (one-sided) level or better. The details of variables definition are in appendixes A and B.
9 Developed by Francis, Philbrick, and Schipper (1994), this measure controls for four industries with a high
21
Nonfinancial Firms Sample Results
Sample
Table 5 presents the sample selection procedure for our audit fee Model 1, where we extract financial data from Compustat and audit fee data from Audit Analytics. We collect our initial sample of 80,693 firm-year observations from Compustat for the years 2008 to 2015. We exclude all 29,546 firm-year observations from the financial services industries (SIC code 60– 69). Next, we require firm-year observations to have audit fee data available in Audit Analytics; this requirement eliminates 14,564 firm-year observations. Last, we exclude 13,961 firm-year observations that lack the necessary data to calculate control variables. Our final sample comprises 48,795 firm-year observations.
Table 5: Sample Development for Nonfinancial Firms
Number of firm
years Total firm-year observations available in Compustat,
2007– 2015 80,693
Less:
Observations from financial services industries -28,798
Observations without information to calculate audit fee -13,483 Observations with insufficient data to calculate control
variables -19,047
Final sample 19,365
Table 6 reports the descriptive statistics for our sample. We report the mean of our dependent variable Ln(AUDITFEE) as 13.74, which is consistent with Ettredge, Xu, and Yi
(2014). Additionally, the descriptive statistics of the audit fee determinants are consistent with levels reported in prior literature (Simunic 1980; Hribar, Kravet, and Wilson 2014).
22 Table 6: Descriptive Statistics for Nonfinancial Firms
Variable N Mean Median Std Dev 25% 75%
ln_fee 19,365 13.740 13.826 1.417 12.899 14.644 fairlv_tt 19,365 0.221 0.070 0.394 0.012 0.291 fairlv1 19,365 0.100 0.009 0.187 0.000 0.113 fairlv2 19,365 0.069 0.004 0.153 0.000 0.044 fairlv3 19,365 0.038 0.000 0.208 0.000 0.004 dummylv_tt 19,365 0.977 1.000 0.149 1.000 1.000 dummy_lv1 19,365 0.674 1.000 0.469 0.000 1.000 dummy_lv2 19,365 0.681 1.000 0.466 0.000 1.000 dummy_lv3 19,365 0.350 0.000 0.477 0.000 1.000 frass_lv1 19,365 0.094 0.007 0.182 0.000 0.101 frlia_lv1 19,365 0.004 0.000 0.029 0.000 0.000 frass_lv2 19,365 0.051 0.000 0.130 0.000 0.016 frlia_lv2 19,365 0.017 0.000 0.073 0.000 0.003 frass_lv3 19,365 0.006 0.000 0.031 0.000 0.000 frlia_lv3 19,365 0.032 0.000 0.202 0.000 0.000 big4 19,365 0.741 1.000 0.438 0.000 1.000 ln_at 19,365 6.332 6.421 2.476 4.809 8.029 Inv 19,365 0.090 0.043 0.119 0.000 0.139 Rec 19,365 0.133 0.103 0.131 0.044 0.179 Cr 19,365 2.993 1.939 3.698 1.206 3.296 Btm 19,365 0.477 0.444 1.263 0.213 0.764 Lev 19,365 0.333 0.193 0.750 0.010 0.390 Empls 19,365 2.146 1.222 2.584 0.464 2.757 Merger 19,365 0.367 0.000 0.482 0.000 1.000 ndec_ye 19,365 0.265 0.000 0.442 0.000 1.000 Roa 19,365 -0.158 0.058 1.258 -0.040 0.117 Loss 19,365 0.536 1.000 0.499 0.000 1.000 Mao 19,365 0.271 0.000 0.445 0.000 1.000 Litig 19,365 0.377 0.000 0.485 0.000 1.000 Segment 19,365 1.546 1.000 0.960 1.000 2.000
23 Table 7: Fair Value and Audit Fee for Nonfinancial Companies
Variables 1 2 3 4 5 6 7 8 9 10 FairValue_tt 0.100*** (4.86) FairValue-1 0.162* 0.092** (3.59) (2.15) FairValue-2 0.049 0.075 (0.97) (1.48) FairValue-3 0.099*** 0.110*** (2.78) (3.09) Dummy_FV_tt 0.063* (1.74) Dummy_FV1 0.055*** 0.054*** (3.19) (3.39) Dummy_FV2 0.006 0.029* (0.728) (1.79) Dummy_FV3 0.043*** 0.052*** (2.95) (3.60) big4 0.500*** 0.503*** 0.504*** 0.506*** 0.502*** 0.491*** 0.501*** 0.505*** 0.509*** 0.503*** (21.72) (21.8) (21.87) (22.03) (21.71) (20.07) (21.8) (21.95) (22.16) (22.15) ln_at 0.436*** 0.433*** 0.432*** 0.434*** 0.436*** 0.434*** 0.431*** 0.432*** 0.431*** 0.426*** (66.85) (67.04) (67.24) (66.67) (66.39) (62.03) (67.04) (65.30) (67.46) (65.50) inv 0.075 0.048 0.042 0.038 0.064 0.014 0.043 0.032 0.039 0.041 (0.9) (0.57) (0.50) (0.45) (0.76) (0.20) (0.51) (0.38) (0.46) (0.50) rec 0.415*** 0.388*** 0.387*** 0.391*** 0.407*** 0.337*** 0.387*** 0.383*** 0.383*** 0.403*** (6.39) (6.00) (5.98) (6.06) (6.26) (4.96) (6.01) (5.94) (5.93) (6.39) cr -0.023*** -0.022*** -0.021*** -0.021*** -0.022*** -0.019*** -0.022*** -0.021*** -0.021*** -0.021*** (-11.06) (-10.49) (-10.37) (-10.15) (-10.48) (-7.85) (-10.69) (-10.31) (-10.19) (-10.48) btm -0.045*** -0.047*** -0.047*** -0.046*** -0.045*** -0.086*** -0.047*** -0.047*** -0.047*** -0.045*** (-6.87) (-7.10) (-7.10) (-7.03) (-6.92) (-8.91) (-7.16) (-7.14) (-7.10) (-7.16) lev -0.052*** -0.038*** -0.039*** -0.045*** -0.046*** -0.067*** -0.036*** -0.038*** -0.039*** -0.037*** (-4.35) (-3.29) (-3.42) (-3.84) (-3.93) (-5.04) (-3.12) (-3.36) (-3.38) (-3.36)
24 Variables 1 2 3 4 5 6 7 8 9 10 empls 0.062*** 0.062*** 0.062*** 0.061*** 0.062*** 0.056*** 0.062*** 0.062*** 0.062*** 0.064*** (11.37) (11.49) (11.47) (11.26) (11.31) (10.08) (11.35) (11.42) (11.50) (11.80) fgn 0.016 0.012 0.016 0.015 0.015 -0.023 0.016 0.015 0.012 0.026 (0.29) (0.22) (0.28) (0.27) (0.27) (-0.39) (0.28) (0.27) (0.23) (0.46) merger 0.113*** 0.112*** 0.111*** 0.110*** 0.113*** 0.099*** 0.111*** 0.110*** 0.108*** 0.112*** (8.11) (8.01) (7.94) (7.90) (8.08) (6.83) (7.99) (7.90) (7.74) (8.14) ndec_ye 0.008 0.009 0.010 0.005 0.007 0.008 0.006 (0.42) (0.44) (0.47) (0.27) (0.38) (0.40) (0.33) roa -0.031*** -0.036*** -0.036*** -0.033*** -0.032*** -0.051*** -0.036*** -0.036*** -0.035*** -0.035*** (-4.62) (-5.29) (-5.33) (-4.90) (-4.78) (-5.18) (-5.31) (-5.34) (-5.20) (-5.22) loss 0.182*** 0.180*** 0.180*** 0.182*** 0.181*** 0.192*** 0.183*** 0.181*** 0.179*** 0.183*** (11.28) (11.15) (11.17) (11.28) (11.21) (11.51) (11.31) (11.21) (11.11) (11.49) mao 0.094*** 0.097*** 0.096*** 0.092*** 0.094*** 0.073*** 0.097*** 0.095*** 0.091*** 0.094*** (6.53) (6.71) (6.66) (6.39) (6.51) (4.61) (6.76) (6.63) (6.32) (6.58) litig 0.025 0.031 0.033 0.035* 0.027 0.033 0.029 0.035* 0.031 0.023 (1.19) (1.46) (1.55) (1.67) (1.23) (1.50) (1.36) (1.65) (1.47) (1.06) Segment 0.058*** 0.057*** 0.057*** 0.057*** 0.058*** 0.057*** 0.055*** 0.057*** 0.056*** 0.054*** (5.84) (5.82) (5.75) (5.73) (5.83) (5.73) (5.56) (5.73) (5.70) (5.48) Intercept 9.953*** 9.988*** 10.010*** 9.986*** 9.951*** 10.232*** 9.974*** 10.003*** 10.000*** 9.948*** (65.02) (65.59) (66.26) (65.84) (65.15) (60.77) (65.68) (66.11) (66.34) (66.37)
Industry&Year Yes Yes Yes Yes Yes Yes Yes Yes Yes Yes
Number of
observations 19,365 19,365 19,365 19,365 19,365 19,365 19,365 19,365 19,365 19,365
Adjusted R2 0.824 0.824 0.824 0.824 0.824 0.821 0.824 0.824 0.824 0.825
Note: Our audit fee regression model includes fair value measurement variables. The resulting model, including industry and year fixed effects, is specified as:
𝐿𝐿𝐿𝐿(𝐴𝐴𝐴𝐴𝐴𝐴𝐴𝐴𝐴𝐴𝐹𝐹𝐹𝐹𝐹𝐹)𝑖𝑖,𝑡𝑡= 𝛽𝛽0+𝛽𝛽1𝐹𝐹𝐹𝐹𝐹𝐹𝐹𝐹𝑉𝑉𝐹𝐹𝑉𝑉𝑉𝑉𝑉𝑉𝑖𝑖,𝑡𝑡+𝛽𝛽2𝐵𝐵𝐴𝐴𝐵𝐵4𝑖𝑖,𝑡𝑡+𝛽𝛽3𝐹𝐹𝐵𝐵𝐹𝐹𝑖𝑖,𝑡𝑡+𝛽𝛽4𝐿𝐿𝐿𝐿(𝐴𝐴𝐴𝐴𝐴𝐴𝐹𝐹𝐴𝐴𝐴𝐴)𝑖𝑖,𝑡𝑡+𝛽𝛽5𝐴𝐴𝐹𝐹𝑉𝑉𝑖𝑖,𝑡𝑡+𝛽𝛽6𝑅𝑅𝐹𝐹𝑅𝑅𝑖𝑖,𝑡𝑡+𝛽𝛽7𝑅𝑅𝑅𝑅𝑖𝑖,𝑡𝑡+𝛽𝛽8𝐵𝐵𝐴𝐴𝐵𝐵𝑖𝑖,𝑡𝑡+𝛽𝛽9𝐿𝐿𝐹𝐹𝑉𝑉𝑖𝑖,𝑡𝑡+ 𝛽𝛽10𝐹𝐹𝐵𝐵𝐸𝐸𝐿𝐿𝐴𝐴𝑖𝑖,𝑡𝑡+ 𝛽𝛽11𝐵𝐵𝐹𝐹𝑅𝑅𝐵𝐵𝐹𝐹𝑅𝑅𝑖𝑖,𝑡𝑡+𝛽𝛽12𝐹𝐹𝐴𝐴𝐹𝐹𝑅𝑅_𝑌𝑌𝐹𝐹𝑖𝑖,𝑡𝑡+𝛽𝛽13𝑅𝑅𝑅𝑅𝐴𝐴𝑖𝑖,𝑡𝑡+𝛽𝛽14𝐿𝐿𝑅𝑅𝐴𝐴𝐴𝐴𝑖𝑖,𝑡𝑡+𝛽𝛽15𝐴𝐴𝐴𝐴𝐴𝐴𝑅𝑅𝐸𝐸𝐴𝐴𝐹𝐹𝑖𝑖,𝑡𝑡+𝛽𝛽16𝐿𝐿𝐴𝐴𝐴𝐴𝐴𝐴𝐵𝐵𝑖𝑖,𝑡𝑡+𝛽𝛽17𝐴𝐴𝐹𝐹𝐵𝐵𝐵𝐵𝐹𝐹𝐹𝐹𝐴𝐴𝑖𝑖,𝑡𝑡+𝜀𝜀𝑡𝑡
25 Regression Analysis Results
Table 7 reports the results of our regression audit fees, specifically Ln(AUDIT FEE) on our Fair
Value variables along with the control variables. The results show that the total fair value amount (FairValue_tt) is positively and significantly (regression coefficient of 0.100 with a t-statistic of
4.86) associated with audit fees. The results imply that the fair value measurements increase the audit efforts and are reflected in a higher audit fee. We also investigate the fair value amounts by breaking down total fair value amount (FairValue_tt) into Level 1 (FairValue-1),Level 2
(FairValue-2),andLevel 3 (FairValue-3).In most cases, we find that the estimated regression
coefficient on the fair value variable is significantly positive. We also test the hypothesis by using dichotomized variables (Dummy_FV1, Dummy_FV2, Dummy_FV3). The results are
consistent with the results based on amounts rather than the dummy variable approach. We find that our control variables are generally consistent with prior literature. BIG4,
Ln(ASSETS), REC, EMPLS, MERGER, LOSS, and SEGMENTS are positively associated with
audit fees. The variables CR, BTM, and ROA are negatively associated with audit fees. The
adjusted R2 (0.824) is comparable with prior research (Hribar, Kravet, and Wilson 2014).
Financial Firm Sample Results
Table 8 presents the sample selection procedure for our audit fee Model 2, where we extract financial data from the Bank Holding Company dataset and audit fee data from Audit Analytics. We collect our initial sample of 5,126 firm-year observations from the Bank Holding Company for the years 2008 to 2015. We exclude 80 firm-year observations for firms with no information in Compustat and 196 firm-year observations for firms with no information from CRSP. Next, we require firm year observations to have audit fee data available in Audit Analytics; this requirement eliminates 2,170 firm-year observations. Last, we exclude 840 firm-year
26 observations that lack the necessary data to calculate control variables. Our final sample
comprises 1,840 firm-year observations for the financial sample.
Table 8: Sample Development for Financial Firms
Number of firm
years Total firm-year observations available in Bank Holding Company,
2007–2015 5,126
Less:
Firms that do not have CIK or GVKEY information from Compustat and
CRSP -80
Firms that do not have valid data for the standard deviation of returns from
CRSP database -196
Firms that do not have valid and nonzero audit fee disclosure data from
Audit Analytics -2,170
Observations with insufficient data to calculate control variables -840
Final sample 1,840
Descriptive Statistics
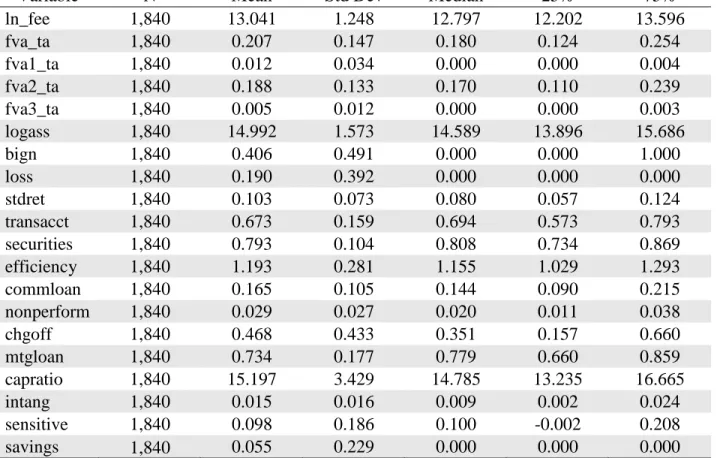
Table 9 reports the descriptive statistics for our sample. We report the mean of our dependent variable Ln(AUDITFEE) as 13.04, which is consistent with Ettredge, Xu, and Yi (2014).
Additionally, the descriptive statistics of the audit fee determinants are consistent with levels reported in prior literature (Ettredge, Xu, and Yi 2014; Francis, Reichelt, and Wang 2005).
27 Table 9: Descriptive Statistics for Financial Firms
Variable N Mean Std Dev Median 25% 75%
ln_fee 1,840 13.041 1.248 12.797 12.202 13.596 fva_ta 1,840 0.207 0.147 0.180 0.124 0.254 fva1_ta 1,840 0.012 0.034 0.000 0.000 0.004 fva2_ta 1,840 0.188 0.133 0.170 0.110 0.239 fva3_ta 1,840 0.005 0.012 0.000 0.000 0.003 logass 1,840 14.992 1.573 14.589 13.896 15.686 bign 1,840 0.406 0.491 0.000 0.000 1.000 loss 1,840 0.190 0.392 0.000 0.000 0.000 stdret 1,840 0.103 0.073 0.080 0.057 0.124 transacct 1,840 0.673 0.159 0.694 0.573 0.793 securities 1,840 0.793 0.104 0.808 0.734 0.869 efficiency 1,840 1.193 0.281 1.155 1.029 1.293 commloan 1,840 0.165 0.105 0.144 0.090 0.215 nonperform 1,840 0.029 0.027 0.020 0.011 0.038 chgoff 1,840 0.468 0.433 0.351 0.157 0.660 mtgloan 1,840 0.734 0.177 0.779 0.660 0.859 capratio 1,840 15.197 3.429 14.785 13.235 16.665 intang 1,840 0.015 0.016 0.009 0.002 0.024 sensitive 1,840 0.098 0.186 0.100 -0.002 0.208 savings 1,840 0.055 0.229 0.000 0.000 0.000
Multiple Regression Results
Table 10 reports the results of our regression of the Fair Value measure on audit fees
(LnAUDITFEE). Model A of table 10 tests whether the coefficient on the proportion of fair value
amount differs from zero. The results show that the total fair value amount (FairValue_tt) is
positively and significantly (regression coefficient of 0.580 with a t-statistic of 4.91) associated with audit fees for the financial firms. We also investigate the fair value amounts by breaking down total fair value amount (FairValue_tt) into level 1 (FairValue-1),level 2 (FairValue-2),
andlevel 3 (FairValue-3). In most cases, we find that the fair value amount is significantly
28 Table 10: Fair Value and Audit Fee for Financial Companies
Variables 1 2 FairValue_tt 0.580*** (4.91) FairValue-1 0.317 (0.81) FairValue-2 0.490*** (3.69) FairValue-3 4.695*** (3.61) logass 0.592*** 0.581*** (31.47) (31.38) bign 0.399*** 0.403*** (9.66) (9.87) loss 0.017 0.015 (0.36) (0.33) stdret 0.588** 0.521* (2.03) (1.82) transacct -0.274* -0.296** (-1.95) (-2.12) securities 0.907*** 0.851*** (4.61) (4.33) efficiency 0.186*** 0.170*** (3.08) (2.79) commloan -0.468** -0.434* (-2.06) (-1.93) nonperform 3.309*** 3.370*** (5.27) (5.47) chgoff -0.011 -0.007 (-0.34) (-0.22) mtgloan -0.864*** -0.842*** (-5.33) (-5.12) capratio 0.031*** 0.030*** (6.28) (6.2) intang 2.173* 2.458** (1.9) (2.16) sensitive 0.129 0.135 (1.4) (1.5) savings 0.046 0.049 (0.86) (0.92) Intercept 3.275*** 3.500*** (8.86) (9.37)
29 Variables 1 2 No. obs. 1840 1840 Adjusted R2 0.9044 0.9056
Notes: Our audit fee model includes fair value measurement variables. The resulting model, including year fixed
effects, is specified as:
𝐿𝐿𝐿𝐿(𝐴𝐴𝐴𝐴𝐴𝐴𝐴𝐴𝐴𝐴𝐹𝐹𝐹𝐹𝐹𝐹)𝑖𝑖,𝑡𝑡= 𝛽𝛽0+𝛽𝛽1𝐹𝐹𝐹𝐹𝐹𝐹𝐹𝐹𝑉𝑉𝐹𝐹𝑉𝑉𝑉𝑉𝑉𝑉𝑖𝑖,𝑡𝑡+𝛽𝛽2𝐿𝐿𝐿𝐿(𝐴𝐴𝐴𝐴𝐴𝐴𝐹𝐹𝐴𝐴𝐴𝐴)𝑖𝑖,𝑡𝑡+𝛽𝛽3𝐹𝐹𝐵𝐵𝐹𝐹𝑖𝑖,𝑡𝑡+𝛽𝛽4𝐿𝐿𝑅𝑅𝐴𝐴𝐴𝐴𝑖𝑖,𝑡𝑡+𝛽𝛽5𝐴𝐴𝐴𝐴𝐴𝐴𝑅𝑅𝐹𝐹𝐴𝐴𝑖𝑖,𝑡𝑡+ 𝛽𝛽6𝐴𝐴𝑅𝑅𝐴𝐴𝐹𝐹𝐴𝐴𝐴𝐴𝑅𝑅𝑅𝑅𝐴𝐴𝑖𝑖,𝑡𝑡+𝛽𝛽7𝐴𝐴𝐹𝐹𝑅𝑅𝐴𝐴𝑅𝑅𝐴𝐴𝐴𝐴𝐴𝐴𝐹𝐹𝐴𝐴𝑖𝑖,𝑡𝑡+𝛽𝛽8𝐹𝐹𝐹𝐹𝐹𝐹𝐴𝐴𝑅𝑅𝐴𝐴𝐹𝐹𝐹𝐹𝑅𝑅𝑌𝑌𝑖𝑖,𝑡𝑡+𝛽𝛽9𝑅𝑅𝑅𝑅𝐵𝐵𝐵𝐵𝐿𝐿𝑅𝑅𝐴𝐴𝐹𝐹𝑖𝑖,𝑡𝑡+𝛽𝛽10𝐹𝐹𝑅𝑅𝐹𝐹𝐸𝐸𝐹𝐹𝑅𝑅𝐹𝐹𝑅𝑅𝑅𝑅𝐵𝐵𝑖𝑖,𝑡𝑡+
𝛽𝛽11𝑅𝑅𝐶𝐶𝐵𝐵𝑅𝑅𝐹𝐹𝐹𝐹𝑖𝑖,𝑡𝑡+𝛽𝛽12𝐵𝐵𝐴𝐴𝐵𝐵𝐿𝐿𝑅𝑅𝐴𝐴𝐹𝐹𝑖𝑖,𝑡𝑡+𝛽𝛽13𝑅𝑅𝐴𝐴𝐸𝐸𝑅𝑅𝐴𝐴𝐴𝐴𝐴𝐴𝑅𝑅𝑖𝑖,𝑡𝑡+𝛽𝛽14𝐴𝐴𝐹𝐹𝐴𝐴𝐴𝐴𝐹𝐹𝐵𝐵𝑖𝑖,𝑡𝑡+𝛽𝛽15𝐴𝐴𝐹𝐹𝐹𝐹𝐴𝐴𝐴𝐴𝐴𝐴𝐴𝐴𝑉𝑉𝐹𝐹𝑖𝑖,𝑡𝑡+𝛽𝛽16𝐴𝐴𝐴𝐴𝑉𝑉𝐴𝐴𝐹𝐹𝐵𝐵𝐴𝐴𝑖𝑖,𝑡𝑡+𝜀𝜀𝑡𝑡
The estimated coefficient on the Level 1 fair value variable is .317, but it is statistically insignificant. This suggests that there is no statistically significant increase in audit fees
associated with Level 1 fair values. To the contrary, the estimated coefficient on the Level 2 fair value variable is .490, and it is statistically significant at the .001 level. This suggests that audit fees are impacted when there are Level 2 fair values. For Level 3 fair values, where reliance on observable market values is not available, the estimated coefficient is 4.695 (t-value of 3.61). The magnitude of this estimated coefficient is almost 10 times larger than the estimated coefficient for Level 2 fair values. This suggests a very substantial increase in the audit fees when nonreliance on observable market values is required.
We find that our control variables are generally consistent with prior literature. BIG4,
Ln(ASSETS), STDRET, SECURITIES, EFFICIENCY, NONPERFORMANCE, CAPRATIO, and
INTANG are positively associated with audit fees. The variables TRANSACACC,
COMMONLOAN, and MTGLOAN are negatively associated with audit fees. The adjusted R2
(0.904) is comparable with prior research (Ettredge, Xu, and Yi 2014). Table 10 (continued)
30 Conclusions and Implications
Our study concludes that the complexity in underlying transactions is reflected in the readability level of the associated authoritative guidance. Our further analysis on a specific pronouncement, SFAS No. 157, finds that fair value accounting simplifies the readability level of complex transactions when the measurement of those transactions can rely on market valuation. We also show that auditing of fair values (which are associated with complex transactions) results in higher audit fees. In addition, nonreliance on market valuation (i.e., transactions measured at Level 3) will greatly exacerbate the audit fee premium.
Our inferences may have implications for future standard setting. We suggest that, in instances where quoted prices and active markets are readily available, standard-setters could simplify the complexity level of the authoritative guidance by relying on market valuation to handle complex issues related to definition, timing, and measurement. We agree with Nobes (2005) that detailed rules may not necessarily improve the accuracy of financial reporting; instead, the reduction of rules could increase clarity.10
While fair value accounting could simplify the recognition and measurement aspects in accounting standards, we recommend this approach with a caveat. Fair value accounting, unlike mixed attribute models, lacks the convergence properties (Fellingham et al. 1998). Essentially, the convergence properties induce “truth telling.” That is, although reported earnings may not agree with cash flows in the short term, the properties would ensure that earnings and cash flows should converge in the long term. The convergence properties are useful for disciplining
10 Edward Trott, a member of the FASB from October 1999 to June 2007, argues that the board tends to make
piecemeal revisions to the standards (Trott 2015). Trott believes that the current standards are already overly detailed and that it would require an overhaul to simplify the standards significantly.
31 alternative information sources that are more timely and relevant, as market participants have an opportunity to verify the information in the near future.
In summary, the results of our study do not imply that fair value accounting is always better than accounting methods that rely on mixed attribute models. Fair value accounting might help to reduce complexity in financial reporting, but this benefit could be outweighed by
deterioration in other accounting properties.11 We believe that standard-setters should examine these trade-offs when promulgating financial reporting standards.
11 See Nobes (2005) and Benston, Bromwich, and Wagenhofer (2006) for more discussions about the strengths and
32 References
Benston, G. J., M. Bromwich, and A. Wagenhofer. 2006. “Principles- Versus Rules-Based Accounting Standards: The FASB’s Standard Setting Strategy.” Abacus 42(2): 165–188.
Bills, K. L., L. L. Lisic, and T. A. Seidel. 2016. “Do CEO Succession and Succession Planning Affect Stakeholders’ Perceptions of Financial Reporting Risk? Evidence from Audit Fees.” The Accounting Review.
Diaconis, P., and B. Efron. 1983. “Computer-Intensive Methods in Statistics.” Scientific American 248(5):116–126, 128, 130, 170.
Ding, R., H. C. Dekker, and T. Groot. 2013. “Risk, Partner Selection and Contractual Control in Interfirm Relationships.” Management Accounting Research 24(2): 140–155.
Dye, R. A., J. C. Glover, and S. Sunder. 2015. “Financial Engineering and the Arms Race between Accounting Standard Setters and Preparers.” Accounting Horizons 29 (2): 265– 295.
Ettredge, M. L., Y. Xu, and H. S. Yi. 2014. “Fair Value Measurements and Audit Fees: Evidence from the Banking Industry.” AUDITING: A Journal of Practice & Theory 33(3): 33–58.
FASB. 2014. FASB Launches Initiative to Simplify Accounting Standards. Available from
http://www.fasb.org/cs/ContentServer?pagename=FASB%2FFASBContent_C%2FNews Page&cid=1176164118378.
Fellingham, J., C. Finger, W. Teets, and D. Ziebart. 1998. “Links between Cash Flow, Accrual Accounting Income and Economic Income: A Theoretical Model with Supporting Evidence.” Working paper.
Fields, L. P., D. R. Fraser, and M. S. Wilkins. 2004. “An Investigation of the Pricing of Audit Services for Financial Institutions.” Journal of Accounting and Public Policy 23(1): 53– 77.
Francis, J., D. Philbrick, and K. Schipper. 1994. “Shareholder Litigation and Corporate Disclosures.” Journal of Accounting Research 32 (2): 137–164.
Francis, J. R., K. Reichelt, and D. Wang. 2005. “The Pricing of National and City‐Specific Reputations for Industry Expertise in the US Audit Market.” Accounting Review 80(1): 113–136.
Ghosh, A., and S. Lustgarten. 2006. “Pricing of Initial Audit Engagements by Large and Small Audit Firms.” Contemporary Accounting Research 23(2): 333–368.
Glode, V., R. C. Green, and R. Lowery. 2012. “Financial Expertise as an Arms Race.” Journal of Finance 67(5): 1723–1759.
Hribar, P., T. Kravet, and R. Wilson. 2014. “A New Measure of Accounting Quality.” Review of Accounting Studies 19(1): 506–538.
33 Ketchen, D. J., T. R. Crook, and C. W. Craighead. 2014. “From Supply Chains to Supply
Ecosystems: Implications for Strategic Sourcing Research and Practice.” Journal of Business Logistics 35(3): 165–171.
Larsen, M. M., S. Manning, and T. Pedersen. 2013. “Uncovering the Hidden Costs of Offshoring: The Interplay of Complexity, Organizational Design, and Experience.”
Strategic Management Journal 34(5): 533–552.
Lev, B., and F. Gu. 2016. The End of Accounting and the Path Forward for Investors and Managers. Hoboken, NJ: John Wiley & Sons.
Lipshaw, J. M. 2005. “Contingency and Contracts: A Philosophy of Complex Business Transactions.” DePaul Law Review 54(4): 1077.
Miller, B. P. 2010. “The Effects of Reporting Complexity on Small and Large Investor Trading.”
Accounting Review 85(6): 2107–2143.
Nobes, C. W. 2005. “Rules-Based Standards and the Lack of Principles in Accounting.”
Accounting Horizons 19(1): 25–34.
Peterson, K. 2012. “Accounting Complexity, Misreporting, and the Consequences of Misreporting.” Review of Accounting Studies 17(1): 72–95.
Rennekamp, K. 2012. “Processing Fluency and Investors’ Reactions to Disclosure Readability.”
Journal of Accounting Research 50(5): 1319–1354.
Sangster, A. 2016. “The Genesis of Double Entry Bookkeeping.” Accounting Review 91(1): 299– 315.
Sargut, G., and R. G. McGrath. 2011. “Learning to Live with Complexity.” Harvard Business Review 89(9): 68–76.
SEC. 2008. Final Report of the Advisory Committee on Improvements to Financial Reporting to the United States Securities and Exchange Commissions. Available from
https://www.sec.gov/about/offices/oca/acifr/acifr-finalreport.pdf.
Simon, J. 1999. Resampling Stats: User’s Guide. Arlington, VA: Resampling Stats, Inc.
Simunic, D. A. 1980. “The Pricing of Audit Services: Theory and Evidence.” Journal of Accounting Research 18(1): 161–190.
Thornton, G. 2016. Complex Accounting Matters. Available from
http://www.grantthornton.ca/services/complex_accounting.
Trott, E. W. 2015. “The Struggle to Simplify Accounting. ” CFO, January 22. Available from
34 Wallman, S. M. H. 1995. “The Future of Accounting and Disclosure in an Evolving World: The
Need for Dramatic Change.” Accounting Horizons 9(3): 81–91.
———. 1996. “The Future of Accounting and Financial Reporting Part II: The Colorized Approach.” Accounting Horizons 10(2): 138–148.
Watts, R. L., and L. Zuo. 2016. “Understanding Practice and Institutions: A Historical Perspective.” Accounting Horizons 30(3): 409–423.
Waymire, G. B., and S. Basu. 2008. “Accounting Is an Evolved Economic Institution.”
Foundations and Trends in Accounting 2(1–2): 1–174.
Zhou, Y. M. 2012. “Designing for Complexity: Using Divisions and Hierarchy to Manage Complex Tasks.” Organization Science 24(2): 339–355.
35 Appendix A: Variable Definitions
Variable Definition
Fair Value Measure
FairValue-1 Fair-valued asset and liability amounts using Level 1 inputs scaled by total
assets.
FairValue-2 Fair-valued asset and liability amounts using Level 2 inputs scaled by total
assets.
FairValue-3 Fair-valued asset and liability amounts using Level 3 inputs scaled by total
assets.
Fairvalue_tt Aggregated value of fair-valued asset and liability amounts using Level 1, 2,
3.
Dummy_FV_tt An indicator variable that equals 1 if Level 1, Level 2, or Level 3 has value,
and 0 otherwise.
Dummy_FV1 An indicator variable that equals 1 if Level 1 has value, and 0 otherwise.
Dummy_FV2 An indicator variable that equals 1 if Level 2 has value, and 0 otherwise.
Dummy_FV3 An indicator variable that equals 1 if Level 3 has value, and 0 otherwise.
Audit Fee Measure
Ln(AUDIT FEE) Natural log of audit fee (AUDIT_FEE). Source: Audit Analytics
Audit Fee Determinants
BIG4
Indicator variable equal to 1 when the client’s auditor is a member of the Big 5 (or Big 4 after the exit of Arthur Andersen) (AUDITOR_FKEY<6) and zero otherwise. Source: Audit Analytics
Ln(ASSETS) Natural logarithm of total assets (AT) at fiscal year-end. Source: Compustat
FGN Indicator variable that equals 1 if the client is involved in Foreign Exchange
Income (FCA), and 0 otherwise. Source: Compustat
INV Inventory (INVT) scaled by lagged total assets (AT). Source: Compustat
REC Receivables (RECT) scaled by lagged total assets (AT). Source: Compustat
CR Current ratio calculated as current assets (ACT) divided by current liabilities
(LCT). Source: Compustat
BTM
Market-to-book ratio at the beginning of the year measured as book value of equity (CEQ) divided by market value of equity (PRCC_F*CSHO). Source: Compustat
LEV Sum of short-term debt (DLC) and long-term debt (DLTT) scaled by lagged
total assets (AT). Source: Compustat
EMPLS Square root of the number of employees (EMP) (measured in thousands)
36
MERGER Indicator variable that equals 1 if the client is involved in mergers or
acquisitions (AQC), and 0 otherwise. Source: Compustat
NDEC_YE Indicator variable equal to 1 if the fiscal year-end (FYR) does not
end in December and 0 otherwise. Source: Compustat
ROA Operating income after depreciation (OIADP) scaled by lagged total assets
(AT). Source: Compustat
LOSS
Indicator variable equal to 1 if income before extraordinary items and discontinued operations (IB) is negative in the current or two previous years and 0 otherwise. Source: Compustat
MAO
Indicator variable equal to 1 if the client receives a modified audit opinion (AUOP) and 0 otherwise, where a modified opinion is defined as anything other than a standard unqualified audit opinion coded as one by Compustat. Source: Compustat
LITRISK
Indicator variable equal to 1 for high litigation risk industries (SIC 2833–2836; 3570–3577; 7370–7374; 3600–3674; 5200–5961; 8731–8734) and 0 otherwise, as defined in Francis, Philbrick, and Schipper (1994). Source: Compustat