UNIVERSITI PUTRA MALAYSIA
ADSORPTION OF BASIC AND ACID DYES USING PALM KERNEL
SHELL-BASED ACTIVATED CARBON
JUMASIAH BINTI ARSYAD.
ADSORPTION OF BASIC AND ACID DYES USING PALM KERNEL SHELL
-
BASED ACTIVATED CARBONBY
JUMASIAH BINTI ARSYAD
Thesis Submitted to the School of Graduate Studies, Universiti Putra Malaysia, in Fulfilment of the Requirements for the Degree of Master of Science
Abstract of thesis presented to the Senate of Universiti Putra Malaysia in fblfilment of the requirement for the degree of Master of Science.
ADSORPTION OF BASIC AND ACID DYES USING PALM KERNEL SHELL
-
BASED ACTIVATED CARBONJUMASIAH BINTI ARSYAD March 2005
Chairman: Chuah Teong Guan, PhD Faculty: Engineering
A series of batch laboratory studies were conducted in order to investigate the practicability of palm kernel shell (PKS)-based activated carbon for removal of basic dye, Basic Blue 9 (BB 9) and acid dye, Acid Orange 52 (A0 52) from their aqueous solutions. Three different particle sizes of PKS were used and categorized as PKS - S, PKS - M and PKS - L. The adsorption capacities of the PKS-based activated carbons were compared with those of commercial grade coal-based activated carbons at the same conditions. All batch experiments were carried out at a constant temperature of 28°C (22°C) using incubator shaker that operated at 150 rpm.
Batch equilibrium study shows that Adsorption of BB 9 and A 0 52 were highly pH dependent. Removal of BB 9 increased with pH with maximum removal observed at pH 7.0, and decreased thereafter with further increase in the initial pH. However, pH effect on A 0 52 removal shows that A 0 52 removal decreased with an increase in initial pH with the optimum initial was observed at 3.5.
Batch equilibrium data also a had good agreement with the Langmuir, Freundlich and Redlich-Peterson isotherm models with correlation coefficients > 0.9. Overall, the Redlich-Peterson isotherm showed the best fit for all adsorbents under investigation in terms of correlation coefficient as well as error analysis of the results. For all the systems in this study, the analysis of isotherm shape factor showed that adsorption was favorable.
For the adsorbents under investigation, PKS-S has the highest adsorption capacity followed by PKS-M. PKS-L and commercial coal based pellet form have almost equally-balanced adsorption capacity. Of all the adsorbents, commercial coal-based in powder form exhibits the lowest adsorption capacity. Obtained results revealed that PKS based activated carbon is a highly potential alternative adsorbent for treatment of dye-containing wastewater. The maximum capacity of the adsorbents for BB 9 were 333.33 mg/g, 322.58 mg/g and 212.77 mglg for PKS - S, PKS - M and PKS - L, respectively, while for powder and pellet commercial grade coal based, the capacities were 204.08 mg/g and 217.39 mg/g, respectively. On the other hand, the maximum capacities of the same adsorbents for A 0 52 were 344.83 mg/g, 333.33 mglg, 263.16 mg/g, 238.09 mg/g and 322.58 mg/g, respectively. Adsorption capacities of the same adsorbents were found to be higher for adsorption of A 0 52 compared to those of BB 9 due to the smaller molecular size of the former.
Batch kinetic studies were also performed to investigate the rate limiting of the adsorption process. Results obtained revealed that the adsorption of both BB 9 and A 0 52 was rapid at the beginning, but approached equilibrium slowly.
Experimental data can be modeled using pseudo-second-order kinetic model as first order kinetic model does not represent the whole range of adsorption process. Other than that, intraparticle diffusion was found to be prominent at a certain stage of adsorption but it would not be the only limiting step that controlled the adsorption dynamic.
Kinetic data also showed that the adsorption rates were a function of initial adsorbate concentration, adsorbent particle size and adsorbent mass. For all systems under consideration, the values of kZ increased significantly as adsorbent dose increases. Nevertheless, the values of k2 were inversely proportional to the initial adsorbate concentration and adsorbent particle size. On the other hand, values of k, were found to be directly proportional to the initial adsorbate concentration but decreased gradually as adsorbent particle size and adsorbent dose increases.
Abstrak tesis yang dikemukakan kepada Senat Universiti Putra Malaysia sebagai memenuhi keperluan untuk ijazah Master Sains
PENJERAPAN PEWARNA JENIS BES DAN ASID PADA KARBON TERAKTIF DARIPADA TEMPURUNG KELAPA SAWIT
Oleh
JUMASIAH BINTI ARSYAD Mac 2005
Pengerusi : Chuah Teong Guan, PhD Fakulti: Kejuruteraan
Satu siri ujikaji telah dijalankan di makmal untuk mengkaji kesesuaian penggunaan karbon teraktif daripada tempurung kelapa sawit (PKS) untuk menjerap bahan pewarna jenis bes, Basic Blue 9 (BB 9) dan jenis asid, Acid Orange 52 ( A 0 52) daripada larutan berair. PKS yang digunakan terdapat dalam tiga saiz dan dikategorikan sebagai PKS
-
S, PKS -M
dan PKS - L. Dua jenis karbon teraktif komersial berasaskan kayu telah dikaji melalui eksperimen yang sama pada kondisi yang serupa bagi menaksir kapasiti penjerapan setiap PKS berbanding karbon teraktif komersial. Semua ujikaji dijalankan pada suhu tetap iaitu28OC
e2"C)menggunakan penggoncang inkubator yang beroperasi pada kelajuan 150 rpm.
Penjerapan BB 9 didapati sangat dipengaruhi oleh pH larutan di mana penjerapan meningkat bila pH meningkat sehingga pH mencapai tahap optimum 7.0. selepas pH optimum, penjerapan menurun bila pH semakin meningkat. A 0 52 pula memerlukan
keadaan larutan yang berasid untuk mencapai tahap penjerapan yang tinggi di mana penjerapan maksimum dicatatkan pada pH 3.5.
Data keseimbangan didapati sesuai dengan model Langmuir, Freundlich dan Redlich-Peterson dengan nilai R2 > 0.9. Secara keseluruhannya, model isoterma Redlich-Peterson adalah paling sesuai untuk semua system yang dikaji berdasarkan nilai R2 yang tinggi serta nilai sisihan yang rendah. Antara semua sistem yang dikaji, didapati PKS - S mempunyai kapasiti penjerapan yang paling tinggi untuk kedua-dua pewarna diikuti oleh PKS - M. PKS - L mencatatkan kapasiti penjerapan yang hampir sama dengan karbon teraktif komersial jenis pellet manakala karbon teraktif komersial jenis debu mempunyai kapasiti penjerapan yang paling rendah. Kapasiti maksium bagi setiap karbon teraktif dalam penjerapan BB 9 ialah masing- masing 333.33 mglg, 322.58 mg/g dan 212.77 mg/g untuk PKS - S, PKS - M dan PKS - L manakala karbon teraktif komersial jenis debu dan pellet masing-masing mencatatkan nilai 204.08 mglg dan 2 17.39 mglg. Sementara itu, kapasiti penjerapan maksimum terhadap A 0 52 bagi setiap penjerap yang dinyatakan mengikut urutan di atas ialah 344.83 mglg, 333.33 mglg, 263.16 mg/g, 238.09 mg/g dan 322.58 mglg.
Kajian kinetik juga dijalankan untuk mengkaji kadar penjerapan dan meneliti faktor- faktor yang menetukan kadar tersebut. Tiga jenis model telah diuji iaitu kinetik order pertama, kedua dan intrapartikel. Data kinetik didapati sesuai dengan model kedua dan model intrapartikel. Sementara itu, faktor kepekatan awal pewarna, saiz serta dos karbon teraktif yang digunakan didapati memberi kesan yang signifikan ke atas kadar penjerapan.
Data kinetik juga menunjukkan bahawa nilai kz bagi semua sistem yang dikaji meningkat bila dos karbon teraktif meningkat tetapi berkadar songsang dengan kepekatan awal pewarna serta saiz karbon teraktif. Sementara itu, nilai kp didapati berkadaran secara terus dengan kepekatan awal pewarna tetapi peningkatan pada saiz dan dos karbon teraktif menyebabkan nilai kp berkurangan.
ACKNOWLEDGEMENTS
Alhamdulillah, at last this thesis has finally completed. I wish to express my deepest appreciation to my supervisor Dr. Chuah Teong Guan and co-supervisors Dr. Thomas Choong Shean Yaw and Prof. Dr. Azni Idris for their guidance, insightful comments and patient supervision of this work. I also owe a special debt of thanks to all technicians in the Department of Chemical and Environmental Engineering and my fellow colleagues for their helping hand. The helpful collaboration of KD Technology Sdn. Bhd. is highly appreciated. I would like to thank my beloved husband for his understanding and support during this study. I am also very grateful to my family and friends for their encouragement and sharing time throughout this two years journey.
I certify that an Examination Committee met on 1 7 ~ March 2005 to conduct the final examination of Jumasiah Binti Arsyad on her Master of Science thesis entitled "Adsorption of Basic and Acid Dyes Using Palm Kernel Shell-based Activated Carbon" in accordance with Universiti Pertanian Malaysia (Higher Degree) Act 1980 and Universiti Pertanian Malaysia (Higher Degree) Regulations 1981. The Committee recommends that the candidate be awarded the relevant degree. Members of the Examination Committee are as follows:
Fakhru'l-Razi Ahmadun, PhD Associate Professor
Faculty of Engineering Universiti Putra Malaysia (Chairman)
Robiah Yunus, PhD Associate Professor Faculty of Engineering Universiti Putra Malaysia (Internal Examiner) Salmiaton Ali, PhD Lecturer
Faculty of Engineering Universiti Putra Malaysia (Internal Examiner)
Mohd. Azraai Kassim, PhD Professor
Faculty of Civil Engineering Universiti Teknologi Malaysia (External Examiner)
This thesis submitted to the Senate of Universiti Putra Malaysia and has been accepted as fulfilment of the requirement for the degree of Master of Science. The members of the Supervisory Committee are as follows:
Chuah Teong Guan, PhD Lecturer
Faculty of Engineering Universiti Putra Malaysia (Chairman)
Thomas Choong Shean Yaw, PhD Lecturer
Faculty of Engineering Universiti Putra Malaysia (Member)
Ami Hj. Idris, PhD Professor
Faculty of Engineering Universiti Putra Malaysia (Member)
AINI IDERIS, PhD ProfessorIDean
School of Graduate Studies Universiti Putra Malaysia
DECLARATION
I hereby declare that the thesis is based on my original work except for quotations and citations which have been duly acknowledged. I also declare that it has not been previously or concurrently submitted for any other degree at UPM or other institutions.
JUMASIAH BINTI ARSYAD Date: June 2005
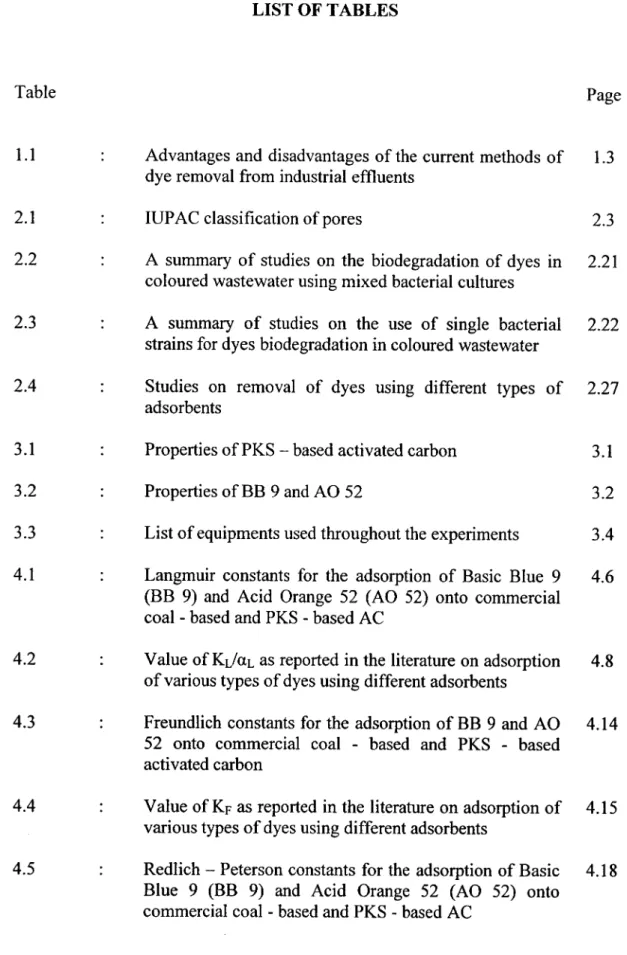
LIST OF TABLES
Table Page
Advantages and disadvantages of the current methods of 1.3 dye removal from industrial effluents
IUPAC classification of pores
A summary of studies on the biodegradation of dyes in 2.21 coloured wastewater using mixed bacterial cultures
A summary of studies on the use of single bacterial 2.22 strains for dyes biodegradation in coloured wastewater
Studies on removal of dyes using different types of 2.27 adsorbents
Properties of PKS - based activated carbon Properties of BB 9 and A 0 52
List of equipments used throughout the experiments
Langmuir constants for the adsorption of Basic Blue 9 4.6 (BB 9) and Acid Orange 52 ( A 0 52) onto commercial
coal
-
based and PKS-
based ACValue of KL/aL as reported in the literature on adsorption 4.8 of various types of dyes using different adsorbents
Freundlich constants for the adsorption of BB 9 and A 0 4.14 52 onto commercial coal
-
based and PKS-
basedactivated carbon
Value of KF as reported in the literature on adsorption of 4.15 various types of dyes using different adsorbents
Redlich - Peterson constants for the adsorption of Basic 4.1 8 Blue 9 (BB 9) and Acid Orange 52 ( A 0 52) onto
commercial coal
-
based and PKS-
based ACComparisons of Sum of Square Errors (SSE) of isotherm 4.21 models for adsorption of BB 9 and A 0 52 onto PKS and
coal
-
based ACEffect of the initial dye concentration on the rate constant 4.37
(kl) for the adsorption of BB 9 and A 0 52 onto PKS
-
based ACEffect of the adsorbent particle size on the rate constant 4.37
(kl) for the adsorption of BB 9 and A 0 52 onto PKS
-
based ACEffect of the adsorbent mass on the rate constant (kl) for 4.37 the adsorption of BB 9 and A 0 52 onto PKS
-
based ACPseudo first-order constant (kl) for adsorption of dyes on 4.39 various adsorbents
Effect of the initial dye concentration on the rate constant 4.44
(k2) for the adsorption of BB 9 and A 0 52 onto PKS
-
based ACEffect of the adsorbent particle size on the rate constant 4.44
(k2) for the adsorption of BB 9 and A 0 52 onto PKS
-
based ACEffect of the adsorbent mass on the rate constant (k2) for 4.44 the adsorption of BB 9 and A 0 52 onto PKS
-
based ACEffect of the initial dye concentration on the rate constant 4.50
(k,) for the adsorption of BB 9 and A 0 52 onto PKS
-
based ACEffect of the adsorbent particle size on the rate constant 4.50
(k,) for the adsorption of BB 9 and A 0 52 onto PKS
-
based ACEffect of the adsorbent mass on the rate constant (k,) for 4.50 the adsorption of BB 9 and A 0 52 onto PKS
-
based ACIntraparticle diffusion rate constant (k,) for adsorption of 4.52 dyes on various adsorbents
. . .
LIST OF FIGURES
Figure Page
: Outline of the study
: The palm oil fruit has a single seed protected by PKS and 2.5 surrounded by a fleshy mesocarp.
: The palm oil fruit without mesocarp
: Unprocessed palm kernel shell (PKS)
: Palm kernel shell activated carbon (PKS AC)
: Molecular structure of C.I. Basic Blue 9
: Molecular structure of C.I. Acid Orange 52
: Adsorption Isotherms
: Stock solution of BB 9 (1000 mg/L)
: Stock solution of BB 9 inside the incubator shaker
: Stock solution of BB 9 was shaken for about 5 hours using 3.4 orbital incubator shaker
: 100 mL of BB 9 solution with the initial concentration of 3.6 200 mg/L
Incubator shaker
Sample solution of BB 9 inside the incubator shaker
: Sample of BB 9 and activated carbon were shaken for 72 3.7 hours to achieve equilibrium using orbital incubator shaker
at 1 50 rpm and 28°C (22°C
: BB 9 solution (initial concentration of 200 mg/L) and 3.8 activated carbon at equilibrium after 72 hours
: Centrifugal separator (IEC Centra CL2, USA)
: BB 9 solutions with the initial concentration of 200 mg/L 3.9 before (left) and after (right) adsorption process,
respectively
.
A 0 52 solutions with the initial concentration of 200 mg/L 3.9 before (left) and after (right) adsorption process,respectively
: UVNIS double beam spectrophotometer (UNIKON 93 3, 3.10 Italy)
: Process flow diagram for batch equilibrium studies
: pH meter model pH- 1000
: 1000 mL of BB 9 solution with the initial concentration of 3.12 150 mg/
: 1 mL sample was withdrawn using a micropipette
: Process flow diagram for batch kinetic studies
: Effect of the initial pH on adsorption of (a) Basic Blue 9 4.4 (b) Acid Orange 52 by commercial and PKS
-
basedactivated carbon at initial concentrations of 400 mg/L and a constant temperature of 28OC (t2OC)
: Linear Langmuir plot for adsorption of BB 9 onto (a) 4.12 commercial coal-based (b) PKS-based activated carbon at
constant temperature of 28OC (+2OC) and pH 7.0
: Linear Langmuir plot for adsorption of A 0 52 onto (a) 4.13 commercial coal-based (b) PKS-based activated carbon at
constant temperature of 28OC (+2OC) and pH 3.57
: Linear Freundlich plots for adsorption of BB 9 onto (a) 4.16 commercial coal
-
based (b) PKS-
based activated carbonat constant temperature of 28OC (k2OC) and pH 7.0
: Linear Freundlich plots for adsorption of A 0 52 onto (a) 4.17 commercial coal
-
based (b) PKS-
based activated carbonat constant temperature of 28OC (+2OC) and pH 3.57
: Linear plots of Redlich-Peterson isotherms for adsorption 4.19 of BB 9 onto (a) commercial coal
-
based (b) PKS-
basedactivated carbon at constant temperature of 28°C (+2OC) and pH 7.0
Linear plots of Redlich-Peterson isotherms for adsorption 4.20 of A 0 52 onto (a) commercial coal
-
based (b) PKS -based activated carbon at constant temperature of 28°C +2"C) and pH 3.5 7
(-
Adsorption isotherms of BB 9 onto commercial coal
-
4.23 based activated carbon: PowderAdsorption isotherms of BB 9 onto commercial coal
-
4.23 based activated carbon: PelletAdsorption isotherms of BB 9 onto PKS
-
based activated 4.24 carbon: PKS-SAdsorption isotherms of BB 9 onto PKS
-
based activated 4.24 carbon: PKS-MAdsorption isotherms of BB 9 onto PKS - based activated 4.25 carbon: PKS-L
Adsorption isotherms of A 0 52 onto commercial coal
-
4.25 based Powder activated carbonAdsorption isotherms of A 0 52 onto commercial coal
-
4.26 based Pellet activated carbonAdsorption isotherms of A 0 52 onto PKS
-
based activated 4.26 carbon (PKS-S)Adsorption isotherms of A 0 52 onto PKS
-
based activated 4.27 carbon (PKS-M)Adsorption isotherms of A 0 52 onto PKS
-
based activated 4.27 carbon (PKS-L)Contact time study of the removal of (a) BB 9 and (b) A 0 4.30 52 from aqueous solutions using PKS
-
based activatedcarbon: Effect of initial dye concentrations
Contact time study of the removal of (a) BB 9 and (b) A 0 4.3 1 52 from aqueous solutions using PKS-based activated
carbon: Effect of adsorbent particle size
Contact time study of the removal of (a) BB 9 and (b) A 0 4.32 52 from aqueous solutions using PKS
-
based activatedcarbon: Effect of adsorbent mass
First-order kinetic model for the removal of (a) BB 9 and 4.34 (b) A 0 52 from aqueous solutions using PKS - based
activated carbon: Effect of initial dye concentration
First-order kinetic model for the removal of (a) BB 9 and 4.35 (b) A 0 52 from aqueous solutions using PKS
-
basedactivated carbon: Effect of adsorbent particle size
First-order kinetic model for the removal of (a) BB 9 and 4.36 (b) A 0 52 from aqueous solution using PKS-based
activated carbon: Effect of adsorbent mass
Pseudo second-order kinetic model for the removal of (a) 4.41 BB 9 and (b) A 0 52 from aqueous solutions using PKS
-
based activated carbon: Effect of initial dye concentration
Pseudo second-order kinetic model for the removal of (a) 4.42 BB 9 and (b) A 0 52 from aqueous solutions using PKS
-
based activated carbon: Effect of adsorbent particle size
Pseudo second-order kinetic model for the removal of (a) 4.43 BB 9 and (b) A 0 52 from aqueous solutions using PKS
-
based activated carbon: Effect of adsorbent mass
Intraparticle diffusion model for the removal of (a) BB 9 4.47 and (b) A 0 52 from aqueous solutions using PKS
-
basedactivated carbon: Effect of initial dye concentration
Intraparticle diffusion model for the removal of (a) BB 9 4.48 and (b) A 0 52 from aqueous solutions using PKS - based
activated carbon: Effect of adsorbent particle size
Intraparticle diffusion model for the removal of (a) BB 9 4.49 and (b) A 0 52 from aqueous solutions using PKS
-
basedactivated carbon: Effect of adsorbent mass
LIST OF NOTATIONS 1 SYMBOLS Notations 1 symbols Length, = 1 0-lo m Energy of adsorption Constant in Equation 2.7 Heterogenity factor Initial concentration Bulk phase concentration
Concentration of the solution at time t Average mesopore diameter
Average micropore diameter Freundlich adsorption capacity Redlich-Peterson constant Langmuir constant Adsorbent mass Surface heterogenity Separation factor time
Solid phase concentration at equilibrium Solid phase concentration at time t BET specific surface of activated carbon Volume of solution
Mesopore volume Micropore volume Total pore volume
minute
AC A 0 52 BET BB 9 IUPAC PKS Activated carbon Acid Orange 52 Brunnauer-Emmet-Teller Basic Blue 9
International Union of Pure and Applied Chemistry Palm Kernel Shell
TABLE OF CONTENTS Page ABSTRACT ABSTRAK ACKNOWLEDGEMENTS APPROVAL DECLARATION LIST OF TABLES LIST OF FIGURES
LIST OF NOTATIONS / SYMBOLS CHAPTER
1 INTRODUCTION 1.1 Background
1.2 Environmental Regulations For Wastewater Generated From Textile Industry
1.3 Treatment Method
1.4 Problem Statement And Objectives Of The Study 2 LITERATURE REVIEW 2.1 Adsorption 2.2 Adsorbents 2.3 Activated carbons 2.4 Dye 2.5 Adsorption Isotherm 2.5.1 Langmuir Isotherm 2.5.2 Freundlich Isotherm 2.5.3 Redlich-Peterson Isotherm 2.6 Kinetics of the Adsorption
2.7 Recent Studies for Removal of Dyes from Wastewater 2.7 Concluding Remarks
3 MATERIALS AND METHODS 3.1 Materials 3. I. 1 Adsorbents 3.1.2 Adsorbates 3.2 Equipments 3.3 Experimentations 3.3.1 Batch EquilibriumsStudies 3.3.2 Effect of Initial pH
3.3.3 Batch Kinetic Studies 3.4 Duplication and Control
.
.
11 v.
..
Vlll ix xi xii xiv xviii4 RESULTS AND DISCUSSION 4.1 Introduction 4.2 Equilibriumstudies 4.2.1 Effect of Initial pH 4.2.2 Adsorption Isotherms 4.3 Kinetic Studies
4.3.1 Kinetics of Adsorption Process 4.3.2 Rate Constant Studies
4.4 Concluding Remarks
5 CONCLUSIONS AND SUGGESTIONS REFERENCES
APPENDICES
BIODATA OF THE AUTHOR
CHAPTER 1
INTRODUCTION
Background
Around the world, chemical industries and manufacturing plants grow at an alarming rate in almost all countries, which released a broad range of harmful industrial wastes to the environment. Textile industries are among the areas that expanded rapidly to fulfil the increasing demand of world population. This industry consumes large volumes of water and chemicals for wet processing and due to inefficiencies in dyeing techniques, some of the dyes maybe discharged into waterways and if reactive dyes are used the dye loss can be up to 50% (Mc Mullan et al., 2001). Considering both volumes discharged and effluent composition, the wastewater generated by the textile industry is rated as the most polluting among all the industrial sectors (Reid and Green, 1996). Wastewater from the textile industry had also been declared as one of the major sources of wastewater in ASEAN countries in the year 2000 (Setamanit et al., 2002).
The effluent discharged from the textile industry mainly contains dyes (organic and inorganic), wax, grease, heavy metals, surfactant and suspended solids (Ahmad et al., 2002). Dye-containing wastewater has been reported to be difficult to treat using conventional wastewater treatment due to its recalcitrant nature. Due to their chemical structure, most dyes are resistant to fading on exposure to light, water and many chemicals (Robinson et al., 2001) and the structural complexity as well as synthetic
origin make it very difficult to be decolourised and decomposed biologically.
Wastewater containing dyes must be properly treated before being discharged to the environment because even when released in small concentrations, it will impart colour that will consequently reduce the aesthetical value to the receiving water. It will also impede light penetration to the water body. These dyes were also found to have a potential chronic health hazard to human beings and other adverse impacts such as toxicity to aquatic life.
1.2 Environmental Regulations For Wastewater Generated From Textile Industry
The Malaysian government gazetted The Environmental Quality Act 1974 and Environmental Quality (Prescribed Premises) (Scheduled Wastes Treatment and Disposal Facilities) Regulations 1979 to inhibit indiscriminate discharge of effluent from textiles industries into the watercourse. Other than that, the effluent from textile industries has to be treated to meet regulatory standards as specified in Environmental Quality (Sewage and Industrial Effluents) Regulations 1979 whilst all factories from textile industries have also to comply with Environmental Quality (Scheduled Wastes) Regulations 1989.
1.3 Treatment Method
Due to more stringent legislation, several studies have been performed to find an effective and economical way for treatment of dye-containing wastewater. Those studies can be categorised into three; physical, chemical and biological methods as shown in Table 1.1.
Table 1.1 Advantages and disadvantages of the current methods of dye removal from industrial effluents (Compiled and modified from Robinson et a]., 2001) Treatment methods Advantages Disadvantages Fentons reagent Ozonation Photochemical NaOCl Cucurbituril Electrochemical destruction Activated carbon Peat Wood chips
Effective decolourisation of both Sludge generation soluble and insoluble dyes
Applied in gaseous state: no alteration of volume
No sludge production
Short half-life (20 minutes) Formation of by-product Initiates and accelerates azo-bond Release of aromatic amines cleavage
Good sorption capacity for various dyes
High cost
Breakdown compounds are non- High cost of electricity hazardous
Good removal of wide variety of Very expensive dyes
Good adsorbent due to cellular structure
Specific surface areas for adsorption are lower than activated carbon
Good sorption capacity for acid Requires long retention
dyes times
Silica gel Effective for basic dye removal Side reactions prevent commercial application