C
HAPTER
9—B
IOMEDICAL
R
ESEARCH
F
ACILITIES
and medical sciences in the Nation’s biomedical research-performing institutions since the inception of the Facilities survey in 1986. These research facilities are not only located at academic institutions, but also in research hospitals and nonprofit research organizations.
This chapter looks at the top 50 academic institutions in science and engineering research expenditures instead of the top 100. In addition, because of their importance in producing black biomedical researchers and physicians, the 29 original HBCUs are pulled out for separate analysis. Colleges and universities with an affiliated medical school are counted as both a college or university and as a medical school in all tables reporting the number of institutions. Their biological and medical science research space—existing, needed, constructed, deferred, and repaired/renovated—and the associated expenditures are divided between the college or university and the medical school categories depending on whether the research space or capital project was designated as inside or outside a medical school. That is, while the institution is counted twice, its research space and associated costs are not.
Several tables present the survey results for the bio-logical and medical sciences separately. The “biobio-logical sciences” includes all institutions with research space inside or outside of medical schools. Similarly, “medical sciences” includes all institutions with research space inside or outside of medical schools.
FINDINGS
A
MOUNTOFB
IOMEDICALR
ESEARCHS
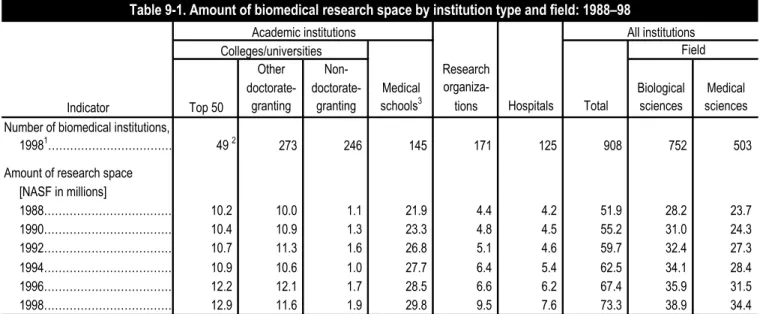
PACEIn 1998, the Nation’s 908 biomedical research-performing institutions had 73.3 million net assignable square feet of biomedical research space. This is 9 percent or 5.9 million NASF more than they had in 1996 and 41 percent or 21.4 million NASF more than they had a decade ago (table 9-1).
Slightly more than half of all the biomedical research space (53 percent or 38.9 million NASF) was in the biological sciences; the other 47 percent or 34.4 million
HIGHLIGHTS
• In 1998, the Nation’s 908 biomedical research-performing institutions had 73.3 million net assignable square feet of biomedical research space. Slightly more than half of all the bio-medical research space (53 percent or 38.9 mil-lion NASF) was in the biological sciences; the other 47 percent or 34.4 million NASF was in the medical sciences (table 9-1).
• Overall, 65 percent of institutions with research space in the biological sciences and 52 percent of institutions with research space in the medical sciences reported that the amount of biomedical research space they had was inadequate to meet their current research commitments (table 9-2). • In fiscal years 1996 and 1997, 172 biomedical research-performing institutions started con-struction on 7.4 million NASF of biomedical research space. They committed $2.2 billion to new construction projects costing over $100,000 (table 9-3).
• In fiscal years 1996 and 1997, 379 biomedical research-performing institutions started repair/ renovation projects on 9.0 million NASF of biomedical research space. They committed $770 million to new repair/renovation projects costing over $100,000 (table 9-4).
• In 1998, biomedical research-performing insti-tutions reported $5.6 billion in combined capital projects (construction and repair renovation) that had to be deferred because of insufficient funds. Construction projects account for 64 per-cent ($3.6 billion) of the total deferred capital project costs (both included and not included in an institutional plan) (table 9-7).
INTRODUCTION
Biomedical research facilities are a critical compo-nent of the Nation’s science and engineering research system. Consequently, NSF and the National Institutes of Health (NIH) have collected data on the amount, quality, and condition of research space in the biological
NASF was in the medical sciences. The amount of research space in each field grew by 10.7 million NASF over the decade, with the biological sciences experiencing a 38-percent increase in research space (from 28.2 million to 38.9 million NASF) and the medical sciences exper-iencing a 45-percent increase (from 23.7 million to 34.4 million NASF).
More than three quarters of all the biomedical research space (77 percent or 56.2 million NASF) was located in academic institutions. Slightly more than half of this space (29.8 million NASF) was located in medical schools, with the remaining 26.4 million NASF located in research-performing colleges and universities. Nonprofit research organizations accounted for 13 percent (9.5 million NASF) of all biomedical research space, while research hospitals accounted for 10 percent (7.6 million NASF).
Between 1988 and 1998, every type of institution, except research hospitals, experienced an appreciable increase in biomedical research space:
• At the top 50 institutions, the amount of biomedical research space increased by 26 percent (from 10.2 million to 12.9 million NASF);
• At other doctorate-granting institutions, the amount of biomedical research space increased by 16 percent (from 10.0 million to 11.6 million NASF);
• At nondoctorate-granting institutions, the amount of biomedical research space increased by 73 per-cent (from 1.1 million to 1.9 million NASF); • At medical schools, the amount of biomedical
research space increased by 36 percent (from 21.9 million to 29.8 million NASF); and • At nonprofit research organizations, the amount
of biomedical research space increased by 116 percent (from 4.4 million to 9.5 million NASF).
Other Non- Research
doctorate- doctorate- Medical organiza- Biological Medical Indicator Top 50 granting granting schools3 tions Hospitals Total sciences sciences
Number of biomedical institutions,
19981 49 2 273 246 145 171 125 908 752 503 Amount of research space
[NASF in millions] 1988 10.2 10.0 1.1 21.9 4.4 4.2 51.9 28.2 23.7 1990 10.4 10.9 1.3 23.3 4.8 4.5 55.2 31.0 24.3 1992 10.7 11.3 1.6 26.8 5.1 4.6 59.7 32.4 27.3 1994 10.9 10.6 1.0 27.7 6.4 5.4 62.5 34.1 28.4 1996 12.2 12.1 1.7 28.5 6.6 6.2 67.4 35.9 31.5 1998 12.9 11.6 1.9 29.8 9.5 7.6 73.3 38.9 34.4
Table 9-1. Amount of biomedical research space by institution type and field: 198898
Field All institutions Academic institutions
Colleges/universities
1 The number of institutions across institution types does not sum to grand totals because many institutions contain both a college/university and a
medical school. In grand totals, medical schools are counted as separate institutions only if they are not affiliated with a college or university.
2 Among the top 50 research-performing institutions, one is a medical school and is included in the count for medical schools.
3 The number of medical schools is based on the sum of the weights of institutions with medical school research space. Medical schools were not an
explicit strata in the sampling scheme. Thus, this number may not reflect the actual number of medical schools in the universe.
KEY: NASF = net assignable square feet.
NOTE: Components may not add to totals due to rounding.
SOURCE: National Science Foundation/Division of Science Resources Studies, 1998 Survey of Scientific and Engineering Research Facilities at Colleges and Universities.
A
DEQUACY OFTHEA
MOUNTOFB
IOMEDICALR
ESEARCHS
PACEANDI
TSC
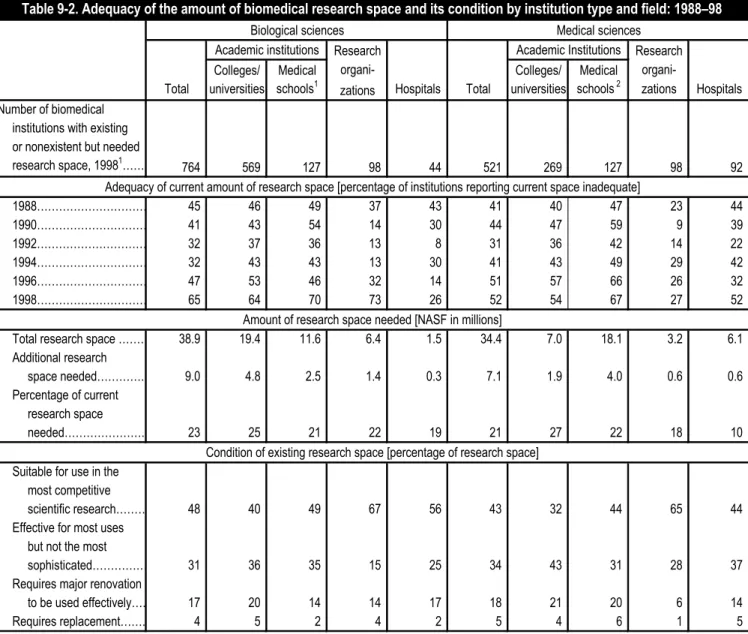
ONDITIONOverall, 65 percent of institutions with research space in the biological sciences and 52 percent of institutions with research space in the medical sciences reported that the amount of biomedical research space they had was inadequate to meet their current research commitments: • Among colleges and universities, 64 percent rated their biological sciences research space as inadequate, while 54 percent rated their medical sciences research space as inadequate;
• Among medical schools, 70 percent rated their biological sciences research space as inadequate, while 67 percent rated their medical sciences research space as inadequate;
• Among nonprofit research organizations, 73 per-cent rated their biological sciences research space as inadequate, while 27 percent rated their medi-cal sciences research space as inadequate; and • Among research hospitals, 26 percent rated their
biological sciences research space as inadequate, while 52 percent rated their medical sciences research space as inadequate (table 9-2). The percentage of institutions with biomedical research space reporting inadequate amounts of research space in the biological sciences increased between 1996 and 1998 from 47 to 65 percent of institutions. During this time period, the percentage of institutions reporting inadequate amounts of research space in the biological sciences increased at three types of institutions: colleges and universities, medical schools, and nonprofit research organizations. By contrast, the percentage of institutions reporting inadequate amounts of research space in the medical sciences remained essentially the same between 1996 (51 percent) and 1998 (52 percent).
Overall, the institutions reported that they needed an additional 9.0 million NASF of research space in the biological sciences or 23 percent more than they had in order to meet their research commitments. At the same time, they reported that they needed an additional 7.1 million NASF of research space in the medical sciences or 21 percent more than they had:
• Colleges and universities reported needing 25 percent more research space in the biological sciences (4.8 million NASF) and 27 percent more research space in the medical sciences (1.9 mil-lion NASF);
• Medical schools reported needing 21 percent more research space in the biological sciences (2.5 million NASF) and 22 percent more research space in the medical sciences (4.0 million NASF); • Nonprofit research organizations reported need-ing 22 percent more research space in the biolog-ical sciences (1.4 million NASF) and 18 percent more research space in the medical sciences (0.6 million NASF); and
• Research hospitals reported needing 19 percent more research space in the biological sciences (0.3 million NASF) and 10 percent more research space in the medical sciences (0.6 million NASF). Less than half (48 percent or 18.7 million NASF) of research space in the biological sciences was rated as “suitable for the most scientifically competitive research,” and less than half (43 percent or 14.8 million NASF) of research space in the medical sciences was rated this way. The percentage of the different types of institutions rating their research space as being in the highest quality con-dition is as follows (see table E9-1 for total NASF by field by institution type):
• Colleges and universities rated 40 percent (7.6 million NASF) of research space in the biological sciences and 32 percent (2.2 million NASF) of research space in the medical sciences as suitable for the most scientifically sophisti-cated research;
• Medical schools rated 49 percent (5.9 million NASF) of research space in the biological sciences and 44 percent (7.7 million NASF) of research space in the medical sciences as being in this condition;
• Nonprofit research organizations rated 67 percent (4.3 million NASF) of research space in the biological sciences and 65 percent (2.1 million NASF) of research space in the medical sciences as being in this condition;
• Research hospitals rated 56 percent (0.8 million NASF) of research space in the biological sciences and 44 percent (2.7 million NASF) of research space in the medical sciences as being in this condition. By contrast, 21 percent (8.2 million NASF) of research space in the biological sciences was rated as needing major renovation or replacement, while 23 percent (7.9 million NASF) of research space in the
medical sciences was rated as being in this condition (see table E9-1 for total NASF by field by institution);
• Colleges and universities rated 25 percent (4.8 million NASF) of research space in the biological sciences and 25 percent (1.8 million NASF) of research space in the medical sciences as needing major renovation or replacement;
Research Research Colleges/ Medical organi- Colleges/ Medical
organi-Total universities schools1
zations Hospitals Total universities schools 2 zations Hospitals
Number of biomedical institutions with existing or nonexistent but needed research space, 19981 764 569 127 98 44 521 269 127 98 92 1988 45 46 49 37 43 41 40 47 23 44 1990 41 43 54 14 30 44 47 59 9 39 1992 32 37 36 13 8 31 36 42 14 22 1994 32 43 43 13 30 41 43 49 29 42 1996 47 53 46 32 14 51 57 66 26 32 1998 65 64 70 73 26 52 54 67 27 52 Total research space 38.9 19.4 11.6 6.4 1.5 34.4 7.0 18.1 3.2 6.1 Additional research
space needed 9.0 4.8 2.5 1.4 0.3 7.1 1.9 4.0 0.6 0.6 Percentage of current
research space
needed 23 25 21 22 19 21 27 22 18 10 Suitable for use in the
most competitive
scientific research 48 40 49 67 56 43 32 44 65 44 Effective for most uses
but not the most
sophisticated 31 36 35 15 25 34 43 31 28 37 Requires major renovation
to be used effectively 17 20 14 14 17 18 21 20 6 14 Requires replacement 4 5 2 4 2 5 4 6 1 5
Condition of existing research space [percentage of research space] Amount of research space needed [NASF in millions]
Adequacy of current amount of research space [percentage of institutions reporting current space inadequate] Academic Institutions
Table 9-2. Adequacy of the amount of biomedical research space and its condition by institution type and field: 198898
Biological sciences Medical sciences Academic institutions
1
The number of institutions across institution types does not sum to grand totals because many institutions contain both a college/university and a medical school. In grand totals, medical schools are counted as separate institutions only if they are not affiliated with a college or university.
2 The number of medical schools is based on the sum of the weights of institutions with medical school research space. Medical schools were not an
explicit strata in the sampling scheme. Thus, this number may not reflect the actual number of medical schools in the universe.
KEY: NASF = net assignable square feet.
NOTE: Components may not add to totals due to rounding.
SOURCE: National Science Foundation/Division of Science Resources Studies, 1998 Survey of Scientific and Engineering Research Facilities at Colleges and Universities.
the different institution types, colleges and universities and medical schools experienced a substantial increase in biomedical research space under construction:
• At colleges and universities, the amount of biomedical research space under construction increased by 38 percent or 0.5 million NASF (from 1.4 million to 1.9 million NASF); and • At medical schools, the amount of biomedical
research space under construction increased by 48 percent or 1.1 million NASF (from 2.3 million to 3.4 million NASF).
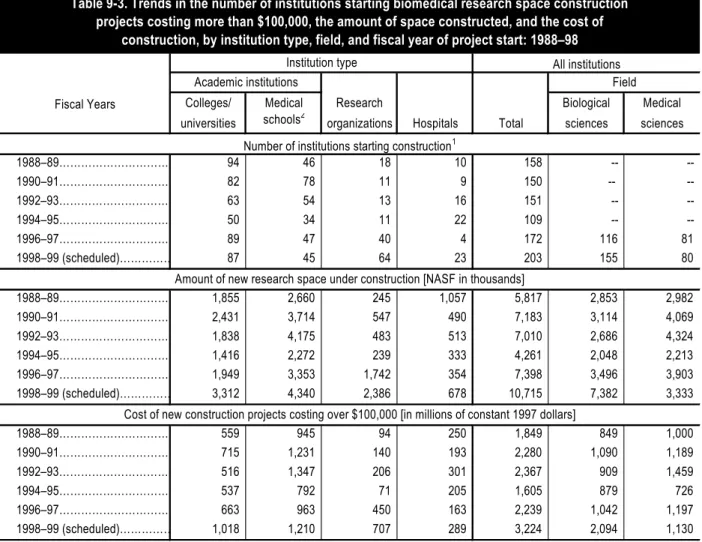
In fiscal years 1998 and 1999, 203 biomedical research-performing institutions were scheduled to start construction on 10.7 million NASF of biomedical research space. During this time period, 155 institutions were scheduled to start construction on 7.4 million NASF of research space in the biological sciences, while 80 institutions were scheduled to start construction on 3.3 million NASF of research space in the medical sciences.
Construction projects were scheduled to start at the different types of biomedical research-performing institutions as follows:
• Among colleges and universities, 87 institutions were scheduled to begin construction on 3.3 mil-lion NASF of biomedical research space; • Among medical schools, 45 institutions were
scheduled to begin construction on 4.3 million NASF of biomedical research space;
• Among nonprofit research organizations, 64 institutions were scheduled to begin construc-tion on 2.4 million NASF of biomedical research space; and
• Among hospitals, 23 institutions were scheduled to being construction on 0.7 million NASF of biomedical research space.
In fiscal years 1996 and 1997, biomedical research-performing institutions committed $2.2 billion to new construction projects costing over $100,000, an increase of 40 percent or $634 million over 1994–95 levels. Slightly more than half of these funds (53 percent or $1.2 billion) were committed to construction projects in the medical sciences, the remaining 47 percent or $1.0 billion were committed to construction projects in the biological sciences.
• Medical schools rated 16 percent (1.9 million NASF) of research space in the biological sci-ences and 26 percent (4.7 million NASF) of research space in the medical sciences as being in this condition;
• Nonprofit research organizations rated 18 percent (1.2 million NASF) of research space in the biological sciences and 7 percent (0.2 million NASF) of research space in the medical sciences as being in this condition; and
• Research hospitals rated 19 percent (0.3 million NASF) of research space in the biological sciences and 19 percent (1.2 million NASF) of research space in the medical sciences as being in this condition.
C
ONSTRUCTIONOFB
IOMEDICALR
ESEARCHS
PACEIn fiscal years 1996 and 1997, 172 biomedical research-performing institutions started construction on 7.4 million NASF of research space. During this time period, 116 institutions started construction on 3.5 million NASF of research space in the biological sciences, while 81 institutions started construction on 3.9 million NASF of research space in the medical sciences (table 9-3). Construction projects were started at the different types of biomedical research-performing institutions as follows: • Among colleges and universities, 89 institutions started construction on 1.9 million NASF of biomedical research space;
• Among medical schools, 47 institutions started construction on 3.4 million NASF of biomedical research space;
• Among nonprofit research organizations, 40 institutions started construction on 1.7 million NASF of biomedical research space; and • Among research hospitals, 4 institutions started
construction on 0.4 million NASF of biomedical research space.
Between 1994–95 and 1996–97, the amount of biomedical research space under construction increased by 74 percent or 3.1 million NASF (from 4.3 million to 7.4 million NASF). During this time period, the medical sciences experienced an appreciable increase of 76 per-cent (1.7 million NASF) of research space under con-struction (from 2.2 million to 3.9 million NASF). Among
Table 9-3. Trends in the number of institutions starting biomedical research space construction projects costing more than $100,000, the amount of space constructed, and the cost of
construction, by institution type, field, and fiscal year of project start: 198898
Colleges/ Medical Research Biological Medical
universities schools2 organizations Hospitals Total sciences sciences
198889 94 46 18 10 158 -- -- 199091 82 78 11 9 150 -- -- 199293 63 54 13 16 151 -- -- 199495 50 34 11 22 109 -- -- 199697 89 47 40 4 172 116 81 199899 (scheduled) 87 45 64 23 203 155 80 198889 1,855 2,660 245 1,057 5,817 2,853 2,982 199091 2,431 3,714 547 490 7,183 3,114 4,069 199293 1,838 4,175 483 513 7,010 2,686 4,324 199495 1,416 2,272 239 333 4,261 2,048 2,213 199697 1,949 3,353 1,742 354 7,398 3,496 3,903 199899 (scheduled) 3,312 4,340 2,386 678 10,715 7,382 3,333 198889 559 945 94 250 1,849 849 1,000 199091 715 1,231 140 193 2,280 1,090 1,189 199293 516 1,347 206 301 2,367 909 1,459 199495 537 792 71 205 1,605 879 726 199697 663 963 450 163 2,239 1,042 1,197 199899 (scheduled) 1,018 1,210 707 289 3,224 2,094 1,130
Number of institutions starting construction1
Amount of new research space under construction [NASF in thousands]
Cost of new construction projects costing over $100,000 [in millions of constant 1997 dollars] Institution type
Fiscal Years
All institutions Field Academic institutions
1 The number of institutions across institution types does not sum to grand totals because many institutions contain both a college/university (exclusive of a medical school) and a medical school. In grand totals, medical schools are counted as separate institutions only if they are not part of larger universities.
2 The number of medical schools is based on the sum of the weights of institutions with medical school research space. Medical schools were not an explicit strata in the sampling scheme. Thus, this number may not reflect the actual number of medical schools in the universe. KEY: -- = data unavailable.
NASF = net assignable square feet.
NOTE: Components may not add to totals due to rounding. Current dollars have been adjusted to constant 1997 dollars using the Bureau of Census Composite Fixed-Weighted Price Index for Construction.
SOURCE: National Science Foundation/Division of Science Resources Studies, 1998 Survey of Scientific and Engineering Research Facilities at Colleges and Universities.
Among the different institution types, only medical schools committed substantially more funds to new construction projects in 1996 and 1997 ($963 million) than they did in fiscal years 1994 and 1995 ($792 million). However, the amount of funds they committed to new construction projects in fiscal years 1996 and 1997 is not substantially different than the amount of funds they committed to these types of projects a decade ago ($945 million).
In fiscal years 1998 and 1999, biomedical research-performing institutions were scheduled to commit $3.2 bil-lion to new construction projects costing over $100,000. This is an increase of 44 percent or $985 million over 1996–97 levels.
Among the different institution types, only colleges and universities are scheduled to commit substantially more funds to new construction projects in fiscal years
37 Sources of funds were not reported by field. Consequently,
the distribution of construction funds across the various sources is for the biomedical fields and all other science and engineering fields (see Chapter 5).
1998 and 1999 ($1.0 billion) than they did in fiscal years 1996 and 1997 ($663 million). This is an increase of 54 percent or $355 million.
REPAIR/RENOVATION OF BIOMEDICAL
R
ESEARCH
S
PACE
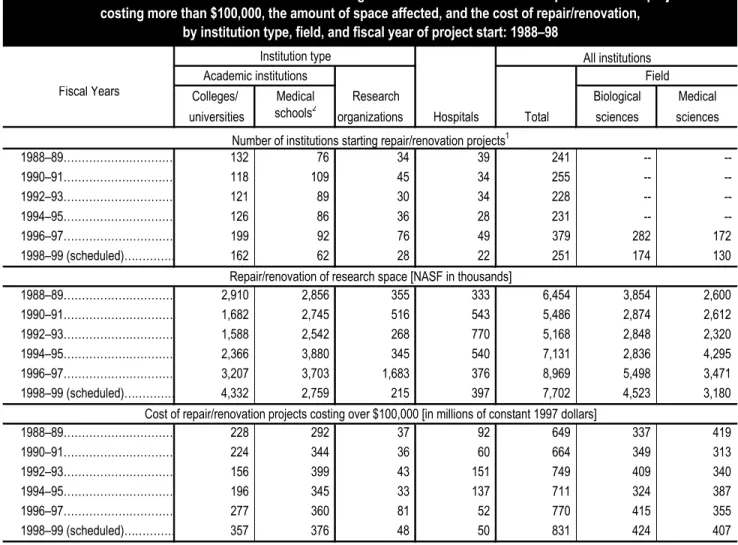
In fiscal years 1996 and 1997, 379 biomedical research-performing institutions started repair/renovation projects on 9.0 million NASF of biomedical research space (table 9-4). This represents 21 percent more space under repair/renovation than under construction (see table 9-3). During this time period, 282 institutions began repair/renovation projects on 5.5 million NASF of research space in the biological sciences, while 172 institutions began repair/renovation projects on 3.5 mil-lion NASF of research space in the medical sciences.
Between 1994–95 and 1996–97, the amount of bio-medical research space repaired or renovated increased by 26 percent or 1.8 million NASF (from 7.1 million to 9.0 million NASF). During this time period, the biological sciences experienced an appreciable increase of 94 per-cent (2.7 million NASF) of research space under repair/ renovation. Among the different institution types, only colleges and universities experienced a substantial increase in the amount of new repair/renovation projects between 1994–95 and 1996–97. The amount of bio-medical research space repaired or renovated at colleges and universities increased by 36 percent or 0.8 million NASF (from 2.4 million to 3.2 million NASF).
In fiscal years 1998 and 1999, 251 biomedical research-performing institutions were scheduled to begin repair/renovation projects on 7.7 million NASF of bio-medical research space. During this time period, 174 institutions were scheduled to start repair/renovation projects on 4.5 million NASF of research space in the biological sciences, while 130 institutions were scheduled to start repair/renovation projects on 3.2 million NASF of research space in the medical sciences.
In fiscal years 1996 and 1997, biomedical research-performing institutions committed $770 million to new repair/renovation projects costing over $100,000. This was 66 percent or $1.5 billion less than they committed to new construction projects in 1996 and 1997 (see table 9-3). Slightly more than half of these funds (54 per-cent or $415 million) were committed to repair/renovation projects in the biological sciences, while the remaining 46 percent or $355 million were committed to repair/ renovation projects in the medical sciences.
Overall, the amount of funds scheduled to be com-mitted to new repair/renovation projects in 1998 and 1999 was not substantially different from the amount of funds they committed to these types of projects in 1996 and 1997.
In fiscal years 1998 and 1999, biomedical research-performing institutions were scheduled to commit $831 million to new repair/renovation projects. This was 74 percent less than they were scheduled to commit to new construction projects (see table 9-3). Slightly more than half of these funds (51 percent or $424 million) were scheduled to be committed to repair/renovation projects in the biological sciences, the remaining 49 percent ($407 million) were scheduled to be committed to repair/ renovation projects in the medical sciences.
S
OURCES OFF
UNDSFOR THEC
ONSTRUCTIONOFR
ESEARCHF
ACILITIES ATB
IOMEDICALR
ESEARCH-P
ERFORMINGI
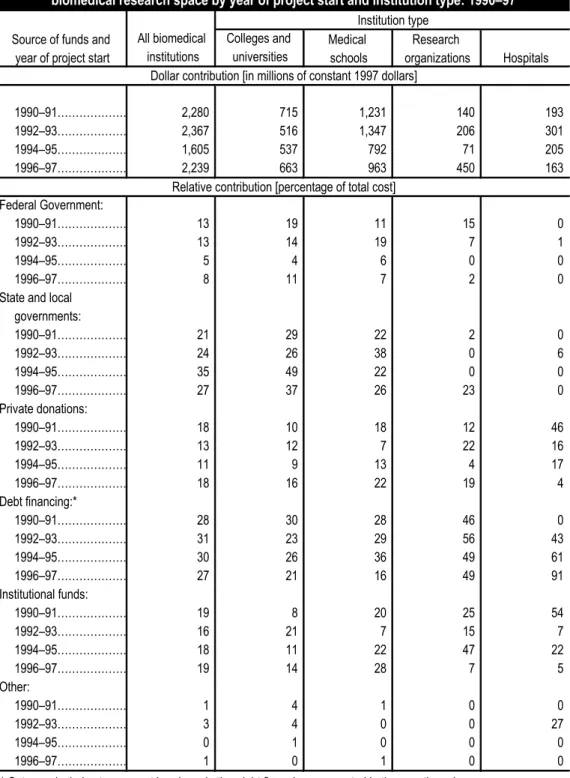
NSTITUTIONSIn fiscal years 1996 and 1997, State and local governments and debt financing each provided 27 percent of funds for all new science and engineering construction projects costing over $100,000 at biomedical research-performing institutions.37 Institutional funds and private donations were the source for 19 and 18 percent, respec-tively, of funds for new construction projects, while the Federal Government contributed 8 percent of all con-struction funds (see table 9-5).
The largest source(s) of funds for new science and engineering construction projects at the different types of institutions was as follows:
• Colleges and universities derived the majority of their science and engineering construction funds from two sources—37 percent from State and local governments and 21 percent of from debt financing;
• Medical schools derived the majority of their construction funds from three sources—28 per-cent from institutional funds, 26 perper-cent from State and local governments, and 22 percent from private donations;
Fiscal Years Colleges/ Medical Research Biological Medical universities schools2 organizations Hospitals Total sciences sciences
198889 132 76 34 39 241 -- -- 199091 118 109 45 34 255 -- -- 199293 121 89 30 34 228 -- -- 199495 126 86 36 28 231 -- -- 199697 199 92 76 49 379 282 172 199899 (scheduled) 162 62 28 22 251 174 130 198889 2,910 2,856 355 333 6,454 3,854 2,600 199091 1,682 2,745 516 543 5,486 2,874 2,612 199293 1,588 2,542 268 770 5,168 2,848 2,320 199495 2,366 3,880 345 540 7,131 2,836 4,295 199697 3,207 3,703 1,683 376 8,969 5,498 3,471 199899 (scheduled) 4,332 2,759 215 397 7,702 4,523 3,180 198889 228 292 37 92 649 337 419 199091 224 344 36 60 664 349 313 199293 156 399 43 151 749 409 340 199495 196 345 33 137 711 324 387 199697 277 360 81 52 770 415 355 199899 (scheduled) 357 376 48 50 831 424 407
Repair/renovation of research space [NASF in thousands]
Cost of repair/renovation projects costing over $100,000 [in millions of constant 1997 dollars]
Academic institutions Field
Table 9-4. Trends in the number of institutions starting biomedical research facilities repair/renovation projects costing more than $100,000, the amount of space affected, and the cost of repair/renovation,
by institution type, field, and fiscal year of project start: 198898
Institution type All institutions
Number of institutions starting repair/renovation projects1
1 The number of institutions across institution types does not sum to grand totals because many institutions contain both a college/university
(exclusive of a medical school) and a medical school. In grand totals, medical schools are counted as separate institutions only if they are not part of larger universities.
2 The number of medical schools is based on the sum of the weights of institutions with medical school research space. Medical schools were
not an explicit strata in the sampling scheme. Thus, this number may not reflect the actual number of medical schools in the universe.
KEY: -- = data unavailable.
NASF = net assignable square feet
NOTE: Components may not add to totals due to rounding. Current dollars have been adjusted to constant 1997 dollars using the Bureau of Census' Composite Fixed-Weighted Price Index for Construction.
SOURCE: National Science Foundation/Division of Science Resources Studies, 1998 Survey of Scientific and Engineering Research Facilities at Colleges and Universities.
• Nonprofit research organizations derived the majority of their construction funds from two sources—49 percent from debt financing and 23 percent from State and local governments; and • Research hospitals derived the majority of their construction funds from one source—91 percent from debt financing.
S
OURCES OFF
UNDSFOR THER
EPAIR/
R
ENOVATIONOFR
ESEARCHF
ACILITIESATB
IOMEDICALR
ESEARCH-P
ERFORMINGI
NSTITUTIONSIn fiscal years 1996 and 1997, institutional funds were the largest source of funds (50 percent) for new science and engineering repair/renovation projects costing over
Source of funds and All biomedical Colleges and Medical Research year of project start institutions universities schools organizations Hospitals 199091 2,280 715 1,231 140 193 199293 2,367 516 1,347 206 301 199495 1,605 537 792 71 205 199697 2,239 663 963 450 163 Federal Government: 199091 13 19 11 15 0 199293 13 14 19 7 1 199495 5 4 6 0 0 199697 8 11 7 2 0
State and local governments: 199091 21 29 22 2 0 199293 24 26 38 0 6 199495 35 49 22 0 0 199697 27 37 26 23 0 Private donations: 199091 18 10 18 12 46 199293 13 12 7 22 16 199495 11 9 13 4 17 199697 18 16 22 19 4 Debt financing:* 199091 28 30 28 46 0 199293 31 23 29 56 43 199495 30 26 36 49 61 199697 27 21 16 49 91 Institutional funds: 199091 19 8 20 25 54 199293 16 21 7 15 7 199495 18 11 22 47 22 199697 19 14 28 7 5 Other: 199091 1 4 1 0 0 199293 3 4 0 0 27 199495 0 1 0 0 0 199697 1 0 1 0 0
Table 9-5. Source of funds for the construction of research facilities at institutions with biomedical research space by year of project start and institution type: 199097
Institution type
Relative contribution [percentage of total cost] Dollar contribution [in millions of constant 1997 dollars]
* Category includes tax-exempt bonds and other debt financing as reported in the questionnaire.
NOTES: Components may not add to totals due to rounding. Sources of funds information is not collected by field. Thus, the percentage of funds from each source is based on all S&E expenditures not just expenditures in biomedical fields. Findings are limited to projects with estimated total costs at completion of $100,000 or more for research space. Current dollars have been adjusted to constant 1997 dollars using the Bureau of Census Composite Fixed-Weighted Price Index for Construction.
SOURCE: National Science Foundation/Division of Science Resources Studies, 1998 Survey of Scientific and Engineering Research Facilities at Colleges and Universities.
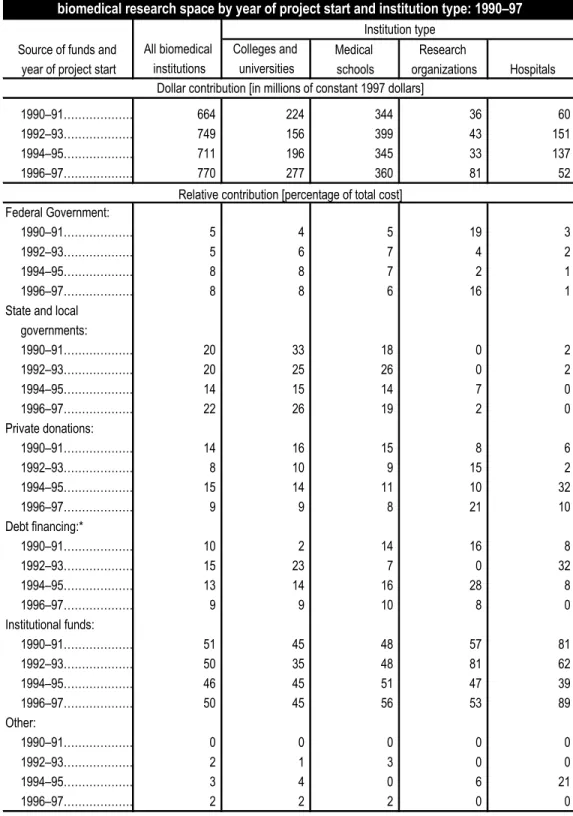
$100,000 at biomedical research-performing institutions.38 State and local governments were the second largest source of funds (22 percent). Private donations and debt financing each accounted for 9 percent of funds for new repair/renovation projects, while the Federal Government contributed 8 percent of all repair/renovation funds (table 9-6).
The largest source(s) of funds for new science and engineering repair/renovation projects at the different types of institutions was as follows:
• Colleges and universities derived the majority of their science and engineering repair/renova-tion funds from two sources—45 percent from institutional funds and 26 percent from State and local governments;
• Medical schools derived the majority of their repair/renovation funds from two sources— 56 percent from institutional funds and 19 per-cent from State and local governments;
• Nonprofit research organizations derived the majority of their repair/renovation funds from two sources—53 percent from institutional funds and 21 percent from private donations; and • Research hospitals derived the majority of their
repair/renovation funds from one source— 89 percent from institutional funds.
B
IOMEDICALR
ESEARCH-P
ERFORMINGI
NSTITUTIONS’ N
EEDFORR
ESEARCHF
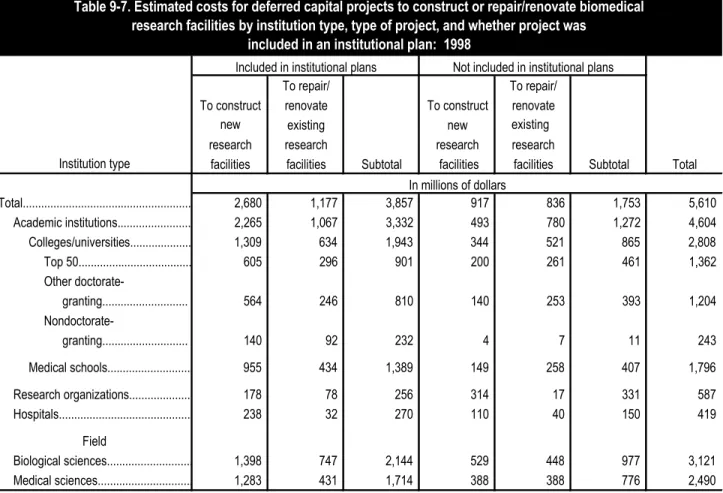
ACILITIESIn 1998, biomedical research-performing institutions reported $5.6 billion in combined capital projects (construction and repair renovation) that had to be deferred because of insufficient funds. Construction projects accounted for 64 percent ($3.6 billion) of the total deferred capital project costs (both included and not included in an institutional plan) (table 9-7).
Academic institutions accounted for 82 percent ($4.6 billion) of the total deferred costs, whereas non-profit research organizations accounted for 10 percent ($587 million) and research hospitals account for 7 percent ($419 million).
More than half (61 percent or $2.8 billion) of the deferred costs in academic institutions was at colleges and universities, while the remaining 39 percent or $1.8 billion was at medical schools. Among colleges and universities, the deferred need was distributed as follows: • The top 50 academic institutions accounted for $1.4 billion or 49 percent of the deferred need at colleges and universities;
• Other doctorate-granting institutions accounted for $1.2 billion or 43 percent of the deferred need; and
• Nondoctorate-granting institutions accounted for $0.2 billion or 9 percent of the deferred need. More than half of the total deferred capital project costs (56 percent or $3.1 billion) were for projects in the biological sciences, while the remaining 44 percent or $2.5 billion in deferred costs were for projects in the medical sciences. Construction projects (both included and not included in an institutional plan) accounted for 62 percent of the deferred costs in the biological sciences ($1.9 billion) and 67 percent of the deferred costs in the medical sciences ($1.7 billion).
B
IOMEDICALR
ESEARCHF
ACILITIESATH
ISTORICALLYB
LACKC
OLLEGESANDU
NIVERSITIESThe Historically Black Colleges and Universities had 1.6 percent (2.34 million NASF) of all the science and engineering research space in the Nation’s research-performing institutions in 1998 (143.3 million NASF) and 1.2 percent (670 thousand NASF) of all the bio-medical sciences research space (56.2 million NASF). Overall, 73 percent (490 thousand NASF) of the HBCUs’ biomedical sciences research space was in the biological sciences, the other 28 percent (190 thousand NASF) was in the medical sciences. The HBCUs’ biomedical sci-ences research space was distributed unequally across institution types. More than half of the HBCUs’ bio-medical research space (60 percent or 400 thousand NASF) was located in colleges and universities, while the other 40 percent or 270 thousand NASF was located in medical schools (table 9-8).
Overall, 71 percent of the HBCUs with existing or needed research space in the biomedical sciences reported that the amount of research space they had was inadequate
Source of funds and All biomedical Colleges and Medical Research year of project start institutions universities schools organizations Hospitals 199091 664 224 344 36 60 199293 749 156 399 43 151 199495 711 196 345 33 137 199697 770 277 360 81 52 Federal Government: 199091 5 4 5 19 3 199293 5 6 7 4 2 199495 8 8 7 2 1 199697 8 8 6 16 1
State and local governments: 199091 20 33 18 0 2 199293 20 25 26 0 2 199495 14 15 14 7 0 199697 22 26 19 2 0 Private donations: 199091 14 16 15 8 6 199293 8 10 9 15 2 199495 15 14 11 10 32 199697 9 9 8 21 10 Debt financing:* 199091 10 2 14 16 8 199293 15 23 7 0 32 199495 13 14 16 28 8 199697 9 9 10 8 0 Institutional funds: 199091 51 45 48 57 81 199293 50 35 48 81 62 199495 46 45 51 47 39 199697 50 45 56 53 89 Other: 199091 0 0 0 0 0 199293 2 1 3 0 0 199495 3 4 0 6 21 199697 2 2 2 0 0 Institution type Dollar contribution [in millions of constant 1997 dollars]
Table 9-6. Source of funds for the repair/renovation of research facilities at institutions with biomedical research space by year of project start and institution type: 199097
Relative contribution [percentage of total cost]
* Category includes tax-exempt bonds and other debt financing as reported in the questionnaire.
NOTES: Components may not add to totals due to rounding. Sources of funds information is not collected by field. Thus, the percentage of funds from each source is based on all S&E expenditures not just expenditures in biomedical fields. Findings are limited to projects with estimated total costs at completion of $100,000 or more for research space. Current dollars have been adjusted to constant 1997 dollars using the Bureau of Census Composite Fixed-Weighted Price Index for Construction.
SOURCE: National Science Foundation/Division of Science Resources Studies, 1998 Survey of Scientific and Engineering Research Facilities at Colleges and Universities.
to meet their current biomedical research commitments. Sixty-seven percent of all academic institutions reported inadequate amounts of biomedical research space.
With respect to the condition of their biomedical research space, the HBCUs rated 47 percent (315 thou-sand NASF) of their biomedical research space as “suitable for the most scientifically sophisticated research,” whereas 45 percent of the biomedical research space at all academic institutions was rated this way. By contrast, the HBCUs rated 8 percent (54 thousand NASF) of their biomedical research space as needing major repair/renovation or replacement, whereas 21 percent of the biomedical research space at all academic institutions was reported as being in this condition.
In fiscal years 1996 and 1997, 6 HBCUs began con-struction on 111 thousand NASF of biomedical research space at an expected completion cost of $31 million. In
1998 and 1999, 8 HBCUs were scheduled to begin con-struction on 139 thousand NASF of biomedical research space at an expected completion cost of $40 million.
Similarly, in fiscal years 1996 and 1997, 8 HBCUs began new repair/renovation projects on 93 thousand NASF of biomedical research space at an expected completion cost of $6.0 million. In 1998 and 1999, 6 HBCUs were scheduled to begin new repair/renovation projects on 223 thousand NASF of biomedical research space at an expected completion cost of $8.9 million.
A
NIMALR
ESEARCHF
ACILITIESATB
IOMEDICALR
ESEARCH-P
ERFORMINGI
NSTITUTIONSIn 1998, 700 of the 908 biomedical research-performing institutions (77 percent) had animal laboratory facilities. While 85 percent of the academic To repair/ To repair/
To construct renovate To construct renovate new existing new existing research research research research
Institution type facilities facilities Subtotal facilities facilities Subtotal Total Total... 2,680 1,177 3,857 917 836 1,753 5,610 Academic institutions... 2,265 1,067 3,332 493 780 1,272 4,604 Colleges/universities... 1,309 634 1,943 344 521 865 2,808 Top 50... 605 296 901 200 261 461 1,362 Other granting... 564 246 810 140 253 393 1,204 granting... 140 92 232 4 7 11 243 Medical schools... 955 434 1,389 149 258 407 1,796 Research organizations... 178 78 256 314 17 331 587 Hospitals... 238 32 270 110 40 150 419 Field Biological sciences... 1,398 747 2,144 529 448 977 3,121 Medical sciences... 1,283 431 1,714 388 388 776 2,490
Table 9-7. Estimated costs for deferred capital projects to construct or repair/renovate biomedical research facilities by institution type, type of project, and whether project was
included in an institutional plan: 1998
Included in institutional plans Not included in institutional plans
In millions of dollars
KEY: NASF = net assignable square feet.
NOTE: Components may not add to totals due to rounding.
SOURCE: National Science Foundation/Division of Science Resources Studies, 1998 Survey of Scientific and Engineering Research Facilities at Colleges and Universities.
All academic Indicator HBCUs institutions* Number of institutions... 57 660 Amount of S&E research space [NASF in millions]
All S&E fields... 2.34 143.3 Biomedical sciences, total... 0.67 56.2 Colleges and universities... 0.40 26.4 Biological sciences... 0.31 19.4 Medical sciences... 0.10 7.0 Medical schools... 0.27 29.8 Biological sciences... 0.18 11.6 Medical sciences 0.09 18.1 Adequacy of current amount of biomedical research space [percentage of institutions]
Sufficient to support needs of current biomedical research program commitments... 29 33 Not sufficient to support needs of current biomedical research program commitments... 71 67 Condition of existing biomedical research space [percentage of space]
Suitable for use in the most sophisticated scientific research... 47 45 Effective for most uses but may need limited repair... 45 33 Requires major repair/renovation to be used effectively... 7 17 Requires replacement... 1 4 Construction projects: fiscal years 199697
Number of institutions with projects >$100,000... 6 128 Biomedical research space to be constructed [NASF in thousands]... 111 5,303 Expected cost [in thousands of dollars]... 31,258 1,625,638 Sources of funds for all construction projects [percentage of total cost]
Federal Government... 7 9 State and local governments... 76 31 Private donations... 5 19 Institutional funds... 2 19 Debt financing... 7 21 Other... 3 1 Scheduled construction projects: fiscal years 199899
Number of institutions planning projects >$100,000... 8 117 Biomedical research space to be constructed [NASF in thousands]... 139 7,652 Expected cost [in thousands of dollars]... 40,195 2,227,605 Repair/renovation projects: fiscal years 199697
Number of institutions with projects >$100,000... 8 244 Biomedical research space to be repaired or renovated [NASF in thousands]... 93 6,897 Expected cost [in thousands of dollars]... 6,042 637,046 Scheduled repair/renovation projects: fiscal years 199899
Number of institutions planning projects >$100,000... 6 189 Biomedical research space to be repaired or renovated [NASF in thousands]... 223 7,927 Expected cost [in thousands of dollars]... 8,850 732,933
Table 9-8. Amount, condition, adequacy, construction, and repair/renovation of biomedical research facilities at Historically Black Colleges and Universities (HBCUs) compared to all academic institutions: 1998
* Includes all academic institutions, with and without biomedical research space.
KEY: NASF = net assignable square feet. S&E = science and engineering
NOTE: Components may not add to totals due to rounding.
SOURCE: National Science Foundation/Division of Science Resources Studies, 1998 Survey of Scientific and Engineering Research Facilities at Colleges and Universities.
institutions and 80 percent of the research hospitals had animal laboratory facilities, less than half (46 percent) of the nonprofit research organizations had such facilities (table 9-9).
The biomedical research-performing institutions reported a total of 14 million NASF of animal research space at biomedical research-performing institutions. Most of that space (83 percent or 12 million NASF) was located in the academic institutions. The nonprofit research organizations accounted for 12 percent of all the animal research space (1.7 million NASF), while the research-performing hospitals account for 5 percent (0.7 million NASF). The majority of animal research space (71 percent or 10 million NASF) was animal housing space, the remaining 29 percent (4 million NASF) was animal research space.
Institutions with animal research space reported that 69 percent (9.8 million NASF) of that space was at Federal biosafety Level 1 (i.e., acceptable for work with microorganisms not known to cause disease in healthy humans). Another 28 percent (4.0 million NASF) of that space was at Level 2 (i.e., acceptable for work with moderate-risk agents present in the community and associated with human disease of varying severity), and 4 percent (0.6 million NASF) was at Level 3 (i.e., acceptable for work with indigenous or exotic agents with a potential for respiratory transmission, and which may cause serious and potentially lethal infection). No biomedical research-performing institution had animal research space at Level 4 (i.e., acceptable for work with biological agents that may cause the transmission of a potentially lethal disease for which there is no readily available cure).
Overall, 88 biomedical research-performing insti-tutions were scheduled to start construction on 1.2 mil-lion NASF of animal research facilities at an estimated cost of $462 million in 1998 and 1999. The scheduled construction projects across institution types were as follows:
• Among academic institutions, 35 institutions were scheduled to start construction on 492 thousand NASF of animal research space at an estimated cost of $162 million in 1998 and 1999;
• Among nonprofit research organizations, 45 institutions were scheduled to start construction on 422 thousand NASF of animal research space at an estimated cost of $143 million 1998 and 1999; and
• Among research hospitals, 8 institutions were scheduled to start construction on 242 thousand NASF of animal research space at an estimated cost of $157 million in 1998 and 1999.
Similarly, 69 biomedical research-performing insti-tutions were scheduled to start repair/renovation projects on 350 thousand NASF of animal research space at an estimated cost of $69 million in 1998 and 1999. The scheduled repair/renovation projects across institutions types were as follows:
• Among academic institutions, 56 institutions were scheduled to start repair/renovation projects on 303 thousand NASF of animal research space at an estimated cost of $45 million in 1998 and 1999;
• Among nonprofit research organizations, 6 insti-tutions were scheduled to start repair/renovation projects on 28 thousand NASF of animal research space at an estimated cost of $7 million 1998 and 1999; and
• Among research hospitals, 7 institutions were scheduled to start repair/renovation projects on 20 thousand NASF of animal research space at an estimated cost of $18 million in 1998 and 1999.
All
biomedical Academic Research
Indicator institutions5 institutions6 organizations Hospitals
Number of biomedical institutions, 1998... 908 612 171 125 Number of biomedical institutions with animal
research facilities, 1998... 700 522 78 100 Total animal research space [NASF in thousands]... 14,227 11,829 1,674 723 Animal housing space... 10,161 8,532 1,149 480 Animal laboratory space... 4,066 3,297 526 243 Percentage of animal research space at each
biological safety level
Level 11 69 75 33 55
Level 22 28 23 61 34
Level 33 4 3 6 11
Level 44 0 0 0 0
Scheduled construction of animal research space: 199899
Number of biomedical institutions
with scheduled construction... 88 35 45 8 Amount of animal research space scheduled
to be constructed [NASF in thousands]... 1,156 492 422 242 Estimated cost of construction of animal
research space [in millions of current dollars]... 462 162 143 157 Scheduled repair/renovation of animal
research space: 199899
Number of biomedical institutions with scheduled repair/renovations
costing over $100,000... 69 56 6 7 Amount of animal research space scheduled
to be repaired or renovated
[NASF in thousands]... 350 303 28 20 Estimated cost of repair/renovation of animal
research space [in millions of current dollars]... 69 45 7 18
Table 9-9. Amount, biosafety level, and scheduled construction and repair/renovation of animal research space at institutions with biomedical research space by institution type: 1998
Institution type
1 Acceptable for work with microorganisms not known to cause disease in healthy humans.
2 Acceptable for work with moderate-risk agents present in the community and associated with human disease of varying severity. 3 Acceptable for work with indigenous or exotic agents with a potential for respiratory transmission, and which may cause serious
and potentially lethal infection.
4 Acceptable for work with biological agents that may cause the transmission of a potentially lethal disease for which there is no
readily available cure.
5 Includes only institutions with biomedical research space. 6 Includes colleges, universities, and medical schools.
KEY: NASF = net assignable square feet.
NOTES: Components may not add to totals due to rounding. Animal research space was reported in total, not separately for each science and engineering field. Therefore, the animal space figures apply to all science and engineering fields, not solely to biomedical fields.
SOURCE: National Science Foundation/Division of Science Resources Studies, 1998 Survey of Scientific and Engineering Research Facilities at Colleges and Universities.