This Note reports an analysis of ultimate control in nearly 3,000 publicly traded companies in Dec-ember 1996—before the financial crisis—in nine East Asian economies: Hong Kong, Indonesia, Japan, the Republic of Korea, Malaysia, the Philip-pines, Singapore, Taiwan (China), and Thailand. The analysis shows that the ten largest families in Indonesia, the Philippines, and Thailand control half the corporate sector (in terms of market cap-italization), while the ten largest in Hong Kong and Korea control about a third (figure 1). More extreme, in Indonesia and the Philippines ulti-mate control of about 17 percent of market capi-talization can be traced to a single family.
While the analysis shows that ownership con-centration in these countries is in keeping with levels in other developing and some industrial countries, its findings shed light on the viability and vulnerability of corporate governance struc-tures in East Asia. The concentration of corpo-rate wealth and the tight links between corporations and government may have impeded legal and regulatory development, directly or indirectly. To create incentives for bet-ter governance, East Asian governments may have to promote more competition, even by breaking up conglomerates, and curtail related-party lending by restricting ownership of banks.
Who Controls East Asian Corporations—
and the Implications for Legal Reform
Stijn Claessens,Simeon Djankov, and Larry H. P. Lang
Note No. 195 September 1999
T h e Wo r l d B a n k G r o u p ▪ F i n a n c e , P r i v a t e S e c t o r, a n d I n f r a s t r u c t u r e N e t w o r k
FIGURE 1 MARKET CAPITALIZATION CONTROLLED BY TOP TEN FAMILIES, 1996
Percentage of total market capitalization
Source: Claessens, Djankov, and Lang 1999.
0 20 40 60 80 100 Indonesia Philippines Thailand Hong Kong Korea, Rep. of Singapore Malaysia Taiwan (China) Japan
P
rivate
sector
Ultimate control
Control is defined as 20 percent of voting rights (as in the methodology developed in La Porta, Lopez-de-Silanes, and Shleifer 1999). Corpo-rations are divided into two categories: those widely held and those with ultimate owners. A widely held corporation is one in which no ers have significant control rights. Ultimate own-ers are of four categories: families (including individuals with large stakes), the state, widely held corporations, and widely held financial insti-tutions such as banks and insurance companies. The results of the analysis show family control in more than half the corporations in East Asia (table 1). But significant cross-country differ-ences exist. In Japan corporations are generally widely held, while in Indonesia and Thailand they are mostly family controlled. And state con-trol is significant in Indonesia, Korea, Malaysia, Singapore, and Thailand.
The analysis shows that in many East Asian economies control is enhanced through
pyra-mid structures and cross-holdings, and voting rights consequently exceed formal cash flow rights (table 2). Pyramid schemes generally involve using control of a publicly held firm to gain control of others (as in figure 2). Management is rarely separated from ownership control, and in two-thirds of firms that are not widely held, the managers are related to the controlling shareholder.
Patterns of controlling ownership stakes differ across countries, with ownership concentration generally diminishing with the level of economic and institutional development. This negative association suggests that companies gravitate toward less concentrated control as their coun-tries become wealthier.
Some of the differences in ownership patterns arise from differences in company and securities laws across countries. Various rules determine the ownership stake needed to exercise effective control, such as the minimum percentage of shareholdings required to block major decisions or to call an extraordinary shareholders meeting. In Korea restrictions on the voting rights of insti-tutional investors in listed companies and high minimum percentages required to file class action suits (30 percent of the vote) imply that relatively small ownership stakes can result in effective control.
A possible factor in the degree to which corpora-tions are widely held is the evolution of capital markets. In Thailand a formal stock market was established only in 1975—and in Indonesia, in 1977—while the stock market in Japan has existed since 1878, and the Stock Exchange of Hong Kong since 1891. Furthermore, in Japan following World War II, the Occupational Forces pursued a delib-erate policy of dispersing ownership (Aoki 1990). Family control
Perhaps a more meaningful focus of analysis, particularly if the concerns are market entry, access to financing, and government policy, is the pattern of control by family groups. To FIGURE 2 A PYRAMID OWNERSHIP
STRUCTURE
Li family
Hutchison Whampoa (third largest firm
in Hong Kong) Cheung Kong (fifth largest firm
in Hong Kong)
35
Note: Numbers refer to percentage ownership shares.
Source: La Porta, Lopez-de-Silanes, and Shleifer 1999.
TABLE 1 CONTROL OF PUBLICLY TRADED COMPANIES IN EAST ASIA, 1996 Percent, except where otherwise specified
Corporations with ultimate owner
Number of Widely Widely held Widely
corporations held financial held
Economy in sample corporations Family State institution corporation
Hong Kong 330 7.0 71.5 4.8 5.9 10.8 Indonesia 178 6.6 67.3 15.2 2.5 8.4 Japan 1,240 85.5 4.1 7.3 1.5 1.6 Korea, Rep. of 345 51.1 24.6 19.9 0.2 4.3 Malaysia 238 16.2 42.6 34.8 1.1 5.3 Philippines 120 28.5 46.4 3.2 8.4 13.7 Singapore 221 7.6 44.8 40.1 2.7 4.8 Taiwan (China) 141 28.0 45.5 3.3 5.4 17.8 Thailand 167 8.2 51.9 24.1 6.3 9.5
Note: Weighted by market capitalization. Source: Claessens, Djankov, and Lang 1999.
TABLE 2 MEANS OF ENHANCING CONTROL IN EAST ASIAN CORPORATIONS, 1996 Percentage of sample
Pyramids with Cross- Controlling
Economy Cap = 20%V ultimate owners holdings owner alone Management
Hong Kong 18.84 25.1 9.3 69.1 53.4 Indonesia 19.17 66.9 1.3 53.4 84.6 Japan 19.89 36.4 11.6 87.2 37.2 Korea, Rep. of 19.64 42.6 9.4 76.7 80.7 Malaysia 18.11 39.3 14.9 40.4 85.0 Philippines 18.71 40.2 7.1 35.8 42.3 Singapore 19.91 55.0 15.7 37.6 69.9 Taiwan (China) 19.61 49.0 8.6 43.3 79.8 Thailand 19.22 12.7 0.8 40.1 67.5 All 19.46 38.7 10.1 67.8 57.1
Note: Cap = 20%Vrefers to the average percentage of book value of common equity required to control 20 percent of the vote. Controlling owner alonemeans that there is no second owner holding at least 10 percent. Managementmeans that the chief execu-tive officer, board chairman, or vice chairman is a member of the controlling family.
capture this, the analysis looked first at the aver-age number of firms in the sample controlled by a single family. That number is largest in Indonesia—more than four—and smallest in Japan—about one (table 3).
These numbers already suggest that in most East Asian economies ultimate control of the corporate sector rests with a small number of families. Further evidence is the number of firms and the market value of assets controlled by the largest family group in each country. The largest family group in a country does not nec-essarily coincide with the largest business group. In Japan the largest keiretsu—the Mitsubishi Group—controls more than 400 affiliated firms, but does not have a single trolling family. In Indonesia the largest con-glomerate is the Salim Group, which is controlled mainly by Soedono Salim but also in part by the Suharto family. The Suharto family has many other holdings—members collec-tively control assets worth US$24 billion in the sample firms—and is considered the largest stockholder in Indonesia (figure 3). The largest family holder in terms of assets across all nine
economies is the Chung Ju-Yung family—which owns Hyundai and its related companies—with holdings worth US$48 billion.
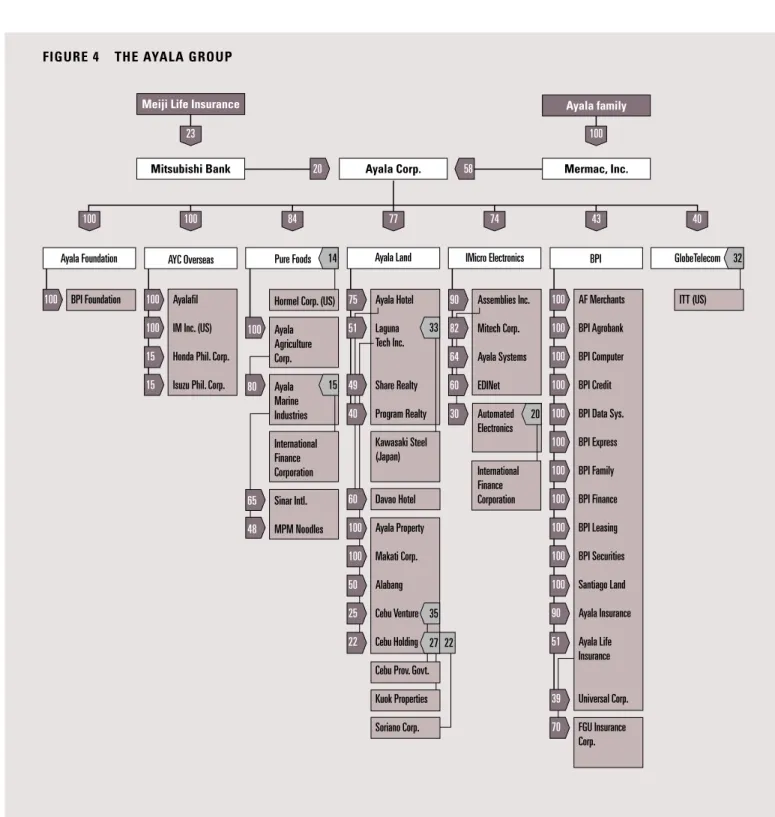
Another measure of wealth concentration is the share of market capitalization held by the top family or by the top ten. In Indonesia 16.6 per-cent of market capitalization can be traced to the ultimate control of the Salims—and in the Philippines, 17.1 percent to the Ayalas (figure 4). The top ten families in Indonesia and the Philippines control more than half the corporate sector (57.7 percent and 52.5 percent). Control is also concentrated in Thailand (46.2 percent) and Hong Kong (32.1 percent). In Korea, Malaysia, and Singapore the top ten families control a quarter of the corporate sector. In Japan family control is insignificant—the top ten own only 2.4 percent of market capitalization.
Concentration, rule of law, and corruption
There are many direct and indirect channels through which business may influence govern-ment, and government may play a role in busi-TABLE 3 HOW CONCENTRATED IS FAMILY CONTROL?
Percentage of total market capitalization controlled
Average number of Top Top ten
Economy firms per family family families
Hong Kong 2.36 6.5 32.1 Indonesia 4.09 16.6 57.7 Japan 1.04 0.5 2.4 Korea, Rep. of 2.07 11.4 26.8 Malaysia 1.97 7.4 24.8 Philippines 2.68 17.1 52.5 Singapore 1.26 6.4 26.6 Taiwan (China) 1.17 4.0 18.4 Thailand 1.68 9.4 46.2
Note: Data refer to 1996.
ness. For example, senior government officials may give preferential treatment to family mem-bers. A case in point is the business empire of the Suharto family in Indonesia. Business groups led by Suharto’s children, relatives, and business partners, many of whom also serve in the gov-ernment, control 417 listed and unlisted compa-nies. The most direct link, of course, is through the large state-controlled companies prevalent in Malaysia and Singapore.
Government and business may also be linked through indirect control of companies by ruling political parties. In Taiwan (China) the main political party, Kuomintang, has a controlling stake in 155 companies, some of them overseas. Kuomintang’s corporate holdings range from
scores of small textile and pharmaceutical busi-nesses to highly protected financial oligopolies with exclusive rights over a wide array of invest-ment transactions. Many companies operate in defense-related industries and are thus exempt from financial and ownership disclosure require-ments, making it difficult to estimate the true size of the party’s corporate portfolio (Baum 1994). The main political parties in Malaysia—Umno and the Malaysian Indian Congress—also have substantial business holdings.
Have the concentration of wealth and the impor-tant links between government and business helped shape the legal system in some East Asian economies? In the wake of the East Asian finan-cial crisis, many analysts have argued that if a few FIGURE 3 THE SUHARTO GROUP
Suharto family Bank Yama Citra Marda Persda Tollroad TPI Tripolyta Andromeda 17 firm s (20% control) Bank Utama 262 firms (20% control) Sempati Air 8 firms (20% control)
Bob Hasan Group
Tirtamas Cemen Cibinong Trias Sentosa 18 firms (20% control) 11 firms (20% control) Kedaung Group Kiani Sakti Kabelindo Murmi 22 firms(20% control) 14 firms (20% control) Kedaung Indah 21 firms (20% control) Gatari Citra Lamtoro Group BimantaraGroup Humpuss Group Salim
Group MuliaUsaha
Group Hanurata Group Mercu Buana Group Bank Central Asia Indomobil
100 BPI Foundation
FIGURE 4 THE AYALA GROUP
Meiji Life Insurance
Mitsubishi Bank Ayala Corp. Mermac, Inc.
AYC Overseas
100 Ayalafil
100 IM Inc. (US)
15 Honda Phil. Corp.
15 Isuzu Phil. Corp.
100 AF Merchants
100 BPI Agrobank
100 BPI Computer
100 BPI Credit
100 BPI Data Sys.
100 BPI Express 100 BPI Family 100 BPI Finance 100 BPI Leasing 100 BPI Securities 100 Santiago Land 90 Ayala Insurance 51 Ayala Life Insurance 39 Universal Corp. 70 FGU Insurance Corp. GlobeTelecom ITT (US)
Pure Foods IMicro Electronics
90 Assemblies Inc. 82 Mitech Corp. 64 Ayala Systems 60 EDINet 30 Automated Electronics International Finance Corporation Ayala Land 75 Ayala Hotel 51 Laguna Tech Inc. 49 Share Realty 40 Program Realty Kawasaki Steel (Japan) 60 Davao Hotel 100 Ayala Property 100 Makati Corp. 50 Alabang 25 Cebu Venture 22 Cebu Holding
Cebu Prov. Govt. Kuok Properties Soriano Corp. 100 100 23 100 84 20 58 77 74 43 40
Note: The numbers refer to percentage ownership shares. BPI is the Bank of the Philippine Islands.
Source: Koike 1993. Ayala Foundation 14 32 33 20 35 BPI Ayala family 27 22 15
Hormel Corp. (US)
100 Ayala Agriculture Corp. 80 Ayala Marine Industries International Finance Corporation 65 Sinar Intl. 48 MPM Noodles
families play a large role in the corporate sector and the government is heavily involved in and influenced by business, the legal system is less likely to evolve in a way that protects minority shareholders and promotes transparent, market-based activities. But little evidence has been col-lected to support this argument.
To test the argument, the analysis compared the concentration of corporate control by families with three indexes of judicial and legal devel-opment: efficiency of the judicial system, rule of law, and degree of corruption (La Porta and Lopez-de-Silanes 1998). The indexes run from 1 to 10, with 10 indicating the most efficient judicial system, strongest rule of law, and least corruption. The correlations between the mar-ket capitalization share of the fifteen largest families and low scores for the three indexes are very strong (table 4). This result suggests that the concentration of corporate control plays a major part in the evolution of the legal system—that there are relationships between
the ownership structure of the corporate sector and the level of institutional development. Moreover, La Porta and others (1998) show a relationship between the ownership structures of individual corporations and judicial and legal development.
Conclusion
In most East Asian economies wealth is concentrated in the hands of a few families and links between government and business are extensive. These features may have directly or indirectly impeded legal and regulatory devel-opment. Thus relationships between patterns of ownership and the characteristics of legal systems are not necessary casual, as has been suggested for some countries. These findings imply that in some East Asian economies suc-cessful legal and regulatory reform may require changes in ownership structures and concen-tration of wealth. Findings also suggest that insider control may have contributed to the TABLE 4 DOES CONCENTRATED FAMILY CONTROL SHAPE LEGAL SYSTEMS?
Concentration of
family controla Judicial Rule of Corruption
Economy (percent) efficiency indexb law index index
Hong Kong 34.4 10.00 8.22 8.52 Indonesia 61.7 2.50 3.98 2.15 Japan 2.8 10.00 8.98 8.52 Korea, Rep. of 38.4 6.00 5.35 5.30 Malaysia 28.3 9.00 6.78 7.38 Philippines 55.1 4.75 2.73 2.92 Singapore 29.9 10.00 8.57 8.22 Taiwan (China) 20.1 6.75 8.52 6.85 Thailand 53.5 3.25 6.25 5.18
Note:Data refer to 1996.
a. Share of total market capitalization controlled by the top fifteen families.
b. Assesses the efficiency and integrity of the legal environment as it affects business, particularly foreign firms. Source: Claessens, Djankov, and Lang 1999.
weak performance and risky investments of many East Asian corporations before the finan-cial crisis.
References
Aoki, Masahiko. 1990. “Toward an Economic Model of the Japanese Firm.”Journal of Economic Literature 28:1–27.
Baum, Julian. 1994. “The Money Machine: Taiwan’s Kuomintang.” Far Eastern Economic Review,August 11, pp. 62–66.
Claessens, Stijn, Simeon Djankov, and Larry H.P. Lang. 1999. “Who Controls East Asian Corporations?” Policy Research Working Paper 2054. World Bank, Financial Sector Practice Department, Washington, D.C.
Koike, Kenji. 1993. “The Ayala Group during the Aquino Period: Diversification along with a Changing Ownership and Management Structure.” Developing Economies31:442–63. La Porta, Rafael, and Florencio Lopez-de-Silanes. 1998. “Capital
Markets and Legal Institutions.” Paper presented at the Fourth Annual Conference on Development in Latin America and the Caribbean, June 28–30.
La Porta, Rafael, Florencio Lopez-de-Silanes, and Andrei Shleifer. 1999. “Corporate Ownership around the World.” Journal of Finance 54:471–518.
La Porta, Rafael, Florencio Lopez-de-Silanes, Andrei Shleifer, and Robert W. Vishny. 1998. “Law and Finance.” Journal of Political Economy 106:1113–55.
W.I. Carr, Banque Indosuez Group. 1997. Indonesian Group Connections.Jakarta.
Stijn Claessens ([email protected]), Lead Economist, Financial Sector Strategy and Policy, Simeon Djankov (sdjankov@ worldbank.org), Financial Economist, Financial Sector Strategy and Policy, and Larry H. P. Lang ([email protected]. cuhk.edu.hk), Professor, Chinese University of Hong Kong Viewpoint is an open forum intended to encourage dissemination of and debate on ideas, innovations, and best practices for expanding the private sector. The views published in this series are those of the authors and should not be attributed to the World Bank or any of its affiliated organizations. Nor do any of the con-clusions represent official policy of the World Bank or of its Executive Directors or the countries they represent. To order additional copies please call 202 458 1111 or contact Suzanne Smith, editor, Room F11K-208, The World Bank, 1818 H Street, NW, Washington, D.C. 20433, or Internet address ssmith7@ worldbank.org. The series is also available on-line (www.worldbank. org/html/fpd/notes/).
Printed on recycled paper.