Theses and Dissertations
August 2014
Thermal Cooling Effects in the Microstructure and
Properties of Cast Cobalt-Base Biomedical Alloys
Vladimir Vega Valer
University of Wisconsin-Milwaukee
Follow this and additional works at:https://dc.uwm.edu/etd
Part of theMaterials Science and Engineering Commons
This Thesis is brought to you for free and open access by UWM Digital Commons. It has been accepted for inclusion in Theses and Dissertations by an authorized administrator of UWM Digital Commons. For more information, please [email protected].
Recommended Citation
Vega Valer, Vladimir, "Thermal Cooling Effects in the Microstructure and Properties of Cast Cobalt-Base Biomedical Alloys" (2014).
Theses and Dissertations. 844.
THERMAL COOLING EFFECTS IN THE
MICROSTRUCTURE AND PROPERTIES OF
CAST COBALT-BASE BIOMEDICAL ALLOYS
by
Vladimir Vega Valer
A Thesis Submitted in
Partial Fulfillment of the
Requirements for the Degree of
Master of Science
in Engineering
at
The University of Wisconsin-Milwaukee
August 2014
ii
ABSTRACT
THERMAL COOLING EFFECTS IN THE
MICROSTRUCTURE AND PROPERTIES OF
CAST COBALT-BASE BIOMEDICAL ALLOYS
by
Vladimir Vega Valer
The University of Wisconsin-Milwaukee, 2014
Under the Supervision of Professor Hugo Lopez
Joint replacement prosthesis is widely used in the biomedical field to provide a solution for dysfunctional human body joints. The demand for orthopedic knee and hip implants motivate scientists and manufacturers to develop novel materials or to increase the life of service and efficiency of current materials. Cobalt-base alloys have been investigated by various researchers for biomedical implantations. When these alloys contain Chromium, Molybdenum, and Carbon, they exhibit good tribological and mechanical properties, as well as excellent biocompatibility and corrosion resistance.
In this study, the microstructure of cast Co-Cr-Mo-C alloy is purposely modified by inducing rapid solidification through fusion welding processes and solution annealing heat treatment (quenched in water at room temperature. In particular the effect of high cooling rates on the athermal phase transformation FCC(Ɣ)↔HCP(ε) on the alloy hardness and corrosion resistance is investigated.
iii
The Co-alloy microstructures were characterized using metallography and microscopy techniques. It was found that the as cast sample typically dendritic with dendritic grain sizes of approximately 150 µm and containing Cr-rich coarse carbide precipitates along the interdendritic boundaries. Solution annealing gives rise to a refined microstructure with grain size of 30 µm, common among Co-Cr-Mo alloys after heat treating.
Alternatively, an ultrafine grain structure (between 2 and 10 µm) was developed in the fusion zone for specimens melted using Laser and TIG welding methods. When laser surface modification treatments were implemented, the developed solidification microstructure shifted from dendritic to a fine cellular morphology, with possible nanoscale carbide precipitates along the cellular boundaries. In turn, the solidified regions exhibited high hardness values (461.5HV), which exceeds by almost 110 points from the alloy in the as-cast condition.
The amount of developed athermal ɛ -martensite phase was determined using X-ray diffractrometry. It was found that the amount of ɛ -martensite
increases significantly from 2% for the Laser surface processing to 13% in the as cast specimen, 24% in the annealed specimen, and 51% for the TIG surface processing. Moreover, the corrosion rate in Ringer solution was calculated by applying the Tafel extrapolation method on each alloy condition. The lowest corrosion rate (0.435 µm/year) was achieved in the Laser treated alloy and it is attributed to the lack of appreciable athermal ɛ -martensite. The highest
iv
corrosion rate (15.5 µm/year) was found to occur in the TIG treated alloy, which possesses the largest amount of ɛ -martensite.
In turn, this suggests that surface modification through melting induces variable amounts of athermal ɛ -martensite in the as-cast Co-Cr-Mo-C alloys. Apparently, rapid solidification of melted surfaces in the Co-alloy is highly effective in modifying the induced amounts of HCP phase, and hence, the exhibited properties.
v
TABLE OF CONTENTS
Page ABSTRACT ii ACKNOWLEDGEMENTS v TABLE OF CONTENTS vi LIST OF FIGURES x LIST OF TABLES xv CHAPTER 1. INTRODUCTION 1 1.1 Problem Statement 11.2 Objectives of Present Study 2
CHAPTER 2. LITERATURE OVERVIEW 4
2.1 Cobalt Base Alloys 4
2.2.1 Cobalt 4
2.2.2 Kinetics Transformation Mechanisms FCC↔HCP 4
vi
2.1.4 Cobalt Chromium Molybdenum Alloys 8
2.1.5 Kinetics Phase Transformation FCC↔HCP in Co-Cr-Mo-C Alloys 9
2.1.6 Athermal Transformation 10
2.1.7 Isothermal Transformation 11
2.1.8 Strain Induced Transformation 11
2.2 Fusion Welding Theory 12
2.2.1 Definition 12
2.2.2 Gas Tungsten Arc Welding 13
2.2.3 Laser Beam Welding 16
2.2.4 Heat Flow 21
2.2.5 Fusion Zone 22
2.2.6 Constitutional Supercooling 24
2.2.7 Weld Grain Structure 25
2.3 Corrosion Theory 26
2.3.1 Definition 26
2.3.2 Passivity 32
2.3.3 Corrosion Rate Measurement 33
2.3.4 Weight Loss Method 33
vii
2.3.7 Polarization Resistance Method 34
CHAPTER 3. EXPERIMENTAL PROCEDURE 36
3.1 Cast Co-Cr-Mo-C alloy Process 36
3.2 Welding Process 37
3.3 Metallographic Sample Preparation 39
3.4 Micro-hardness Test 40
3.5 Optical Microscopy 41
3.6 Scanning Electron Microscopy 41
3.7 X-Ray Diffraction 42
3.8 Corrosion Test 43
CHAPTER 4. RESULTS AND DISCUSSION 45
4.1 Microstructure 45
4.1.1 As Received Cast Cobalt-base Alloy 45
4.1.2 Annealed Specimen 50
4.1.3 TIG Surface Modified Specimen 54
viii
4.2 Micro-hardness 70
4.3 Corrosion 74
CHAPTER 5. CONCLUSION 79
ix
LIST OF FIGURES
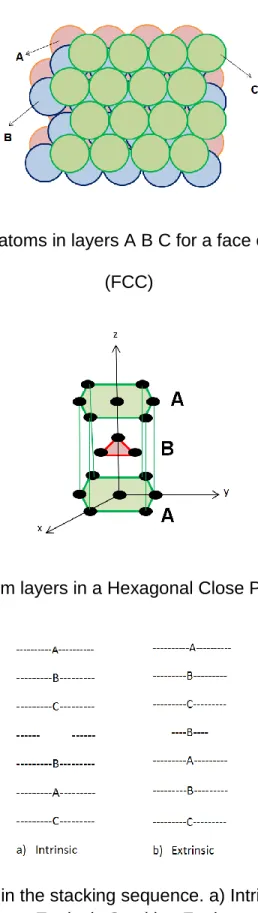
Figure 1. Position of atoms in layers A B C for a face centered cubic crystal….6 Figure 2. Position of atom layers in a Hexagonal Close Packed crystal structure.6 Figure 3. Interruption in the stacking sequence. a) Intrinsic stacking Fault
b) Extrinsic Stacking Fault………...6
Figure 4. Dissociation of Shockley Partial Dislocations………8
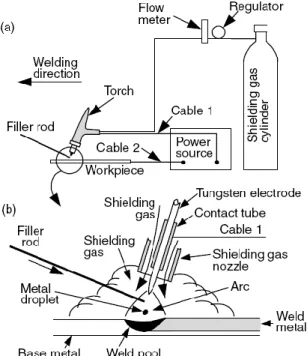
Figure 5. Gas Tungsten Arc Welding process: a) Entire scheme of the welding process. b) Closer view inside the welding area……… 13
Figure 6. Gas Tungsten Arc Welding process: a) Entire scheme of the welding process. b) Closer view inside the welding area……….14
Figure 7. Development of LBW process in the market………16
Figure 8. Development of Laser sources………..17
Figure 9. Weld penetration of CO2 Laser………..17
Figure 10. YAG Four level laser welding system………..18
Figure 11. CO2 Laser diagram……….18
Figure 12. Electron Beam Welding process………..19
Figure 13. Energy released by electron emission in Laser beam welding……...20
Figure 14. Scheme of fusion welding processes according to the heat source and heat input introduced in the workpiece…….………..22
Figure 15. Three different zones produced during welding………22
Figure 16. Development of the solidification mode by the effect of constitutional supercoiling and the temperature gradient and growth rate…………24
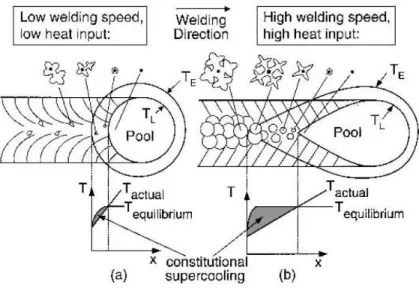
Figure 17. Weld speed and constitutional supercoiling effect on the weld microstructure. a) Low welding speed. b) High welding speed……...25
Figure 18. Schematic diagram of a corrosion cell showing the electrochemical reaction processes……….26
x
Figure 19. Image of electron transfer mechanism of a metal under a corrosive
Environment……….28
Figure 20. Polarization curve between Electrode potential “E” and the Current density “i”……….30
Figure 21. Anodic and cathodic polarization reaction………..31
Figure 22. Corrosion passive film protection………32
Figure 23. Schematic representation of the LSM process on the Co-Cr-Mo alloy disc plates………38
Figure 24. Electroetching equipment Buehler Electromet……….40
Figure 25. Buehler Micromet II digital micro-hardness tester……….40
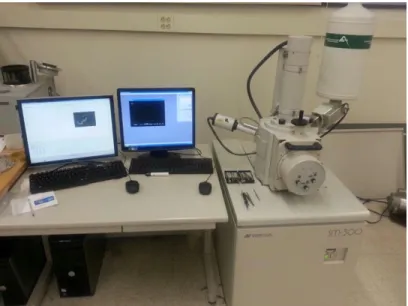
Figure 26. Optical Microscope Zeiss Axio Vert.A1 and Stereo Microscope Zeiss………....41
Figure 27. Topcon SM300 Scanning Electron Microscope equipment with incorporate EDS analysis………42
Figure 28. Extended scheme of the Bruker D8 Discover X-Ray Diffraction equipment and a closer look of the X-Ray source and detector…..43
Figure 29. Isolated system equipment for the corrosion test……….44
Figure 30. Installation of the corrosion cell system………….……….44
Figure 31. VoltaLab PGZ 100 corrosion test equipment……….44
Figure 32. As received cast Co-Cr-Mo-C alloy……….45
Figure 33. Optical image at 200X of the as received cast Co-Cr-Mo-C alloy exhibiting porosity……….46
Figure 34. Optical image of the cast Co-Cr-Mo-C alloy microstructure taken at 200X……….46
Figure 35. SEM image of cast Co-Cr-Mo alloy at 100X magnification………….46
Figure 36. SEM image of alloy microstructure at 2kX magnification……….47
xi
Figure 38. EDS analysis in the carbide precipitate (Co-Cr-Mo 23 C6)………..48
Figure 39. SEM image taken at 1500X confirms the appearance of inclusions inside the matrix alloy………...48
Figure 40. EDS analysis of the inclusion rich in Silicon……….49
Figure 41. XRD image of the as cast Co-base alloy………50
Figure 42. As received Solution annealed specimen and TIG surface melting Specimen………51
Figure 43. SEM image taken at 1500X of the annealed specimen exhibiting approximate 30 µm in grain size………..51
Figure 44. EDS analysis image of a possible carbide precipitate……….52
Figure 45. EDS analysis of an inclusion rich in Silicon………52
Figure 46. XRD patterns of the annealed Co-base alloy at 1230°C……….53
Figure 47. Stereo microscope image of the TIG surface modified specimen…..54
Figure 48. SEM image of the TIGSM specimen at 200X………55
Figure 49. SEM image of the TIGSM specimen at 300X………55
Figure 50. Optical microscope image of the weld pool at 400x in the TIGSM Specimen………56
Figure 51. Optical microscope image of the weld pool at 400X in the TIGSM Specimen………56
Figure 52. Optical microscope image of the weld pool at 400X in the TIGSM Specimen………57
Figure 53. SEM image of weld pool at 1500X in the TIGSM specimen…………58
Figure 54. SEM image of the weld pool at 7kx in the TIGSM specimen………..58
Figure 55. EDS analysis image of the grains inside the weld pool of the TIGSM specimen describes an approximate grain and carbide precipitate sizes of 10µm and 5µm respectively………..………59
xii
Figure 56. EDS analysis image of carbide precipitates found in the weld pool of the TIGSM specimen………59 Figure 57. EDS analysis of the weld pool in the TIGSM specimen containing silicon inclusions along the grain boundaries……….60 Figure 58. SEM image of the HAZ at 300X in the TIGSM specimen………60 Figure 59. SEM image of the HAZ at 2kX in the TIGSM specimen………….….61 Figure 60. XRD pattern image of the TIG weld specimen………..62 Figure 61. Image of the as received Laser surface melting specimen………...63 Figure 62. Optical microscope image of the laser weld beads taken at 200x…63
Figure 63. SEM image of the weld pool taken at 1500X for the LSM specimen.64 Figure 64. SEM image of the weld pool taken at 5kX for the LSM specimen….64 Figure 65. SEM image of the weld pool taken at 10kX for the LSM specimen...64 Figure 66. SEM image of the weld pool taken at 15kX for the LSM specimen...65 Figure 67. EDS analysis image of grains found in the weld pool of the LSM specimen……….66 Figure 68. EDS analysis image of possible carbide precipitates found in the weld pool of the LSM specimen………66 Figure 69. SEM image of the weld pool taken at 500X for the LSM specimen...67 Figure 70. SEM image of the weld pool taken at 500X for the LSM specimen...67 Figure 71. SEM image of the weld pool taken at 500X for the LSM specimen...68 Figure 72. SEM image of the weld pool taken at 1500X for the LSM specimen.68 Figure 73. X-Ray diffraction scheme for the LSM specimen………..69 Figure 74. XRD pattern image of the LSM specimen………..69 Figure 75. Stereo microscope image of the micro-hardness profile in the TIGSM Specimen………71
xiii
Figure 76. Vickers Micro-hardness chart taken from edge surface with direction towards the base metal in the TIGSM specimen……….72 Figure 77. Relationship between grain size for each specimen condition and their respective micro-hardness reading………73 Figure 78. Relationship between carbide size of each alloy condition and their respective micro-hardness reading……….74 Figure 79. Corrosion potentiodynamic curves for each specimen condition…...75 Figure 80. Corrosion resistance for each alloy condition according to the HCP phase developed in the microstructure………...78
xiv
LIST OF TABLES
Table.1 Chemical composition of as cast ASTM F75 alloy……….37
Table 2. Micro-hardness reading of the as cast specimen………..70
Table 3. Micro-hardness reading of the Annealed specimen………..70
Table 4. Micro-hardness reading of the TIGSM specimen... ………..71
Table 5. Micro-hardness reading of the LSM specimen………..72
Table 6. Corrosion rate for each alloy condition calculated by the Tafel extrapolation method………..………76
xv
ACKNOWLEDGEMENTS
First of all, I specially want to dedicate this work thesis to my family. To my mother Silvia who has always supported me throughout my entire life, my brother Ray who has always believed in me without doubting, and my wonderful wife Valerie.
I am deeply grateful to my thesis advisor Dr. Hugo Lopez for being a great mentor and providing me all his expertise during my research.
I would like to thank Dr. Ben Church for all his guidance on academic matter and support during my studies and teaching assistant duties at UW-Milwaukee.
Also, I want to thank Dr. Hardcastle for providing me his time on training and coaching me with much of the equipment at the Advanced Analysis Facility. Finally, I appreciate all the respect and collaboration from my peer teaching assistants and professors in the Materials Department at UW-Milwaukee.
CHAPTER 1. INTRODUCTION
1.1 Problem Statement
Biomedical implant devices became available in the early 1900’s with poor success due to the lack of available biomedical materials at the time. Since then, several studies aimed to improve and develop the most suitable material for surgical implantations. Mechanical properties, corrosion resistance, and
biocompatibility are the main factors for designing and manufacturing biomedical devices to satisfy those needs. However, depending on the attempted replaced part function, the factors may differ to customize and accomplish design
requirements.
Wear debris is the most common problem in hip and knee implants when they replace synovial joint functions in the human body. Limitations in joint movement and movement accompanied by pain lead to new studies to develop more alternatives to fill this gap.
Hip and knee artificial metallic implants were introduced for the first time in the United States by Dr. Austin Moore in the 1940’s[1]. Early available materials at the time, such as Steel and Iron, were mostly employed for artificial joint replacements. These materials generated corrosion between the bone and articulations. In addition, materials like Gold and Nickel were also attempted in surgical implants without success because of poor wear resistance. The addition of Chromium and Molybdenum into the steel produced a newly discovered alloy, 316L Stainless Steel, with improved corrosion and wear resistance. Later in the
middle of the 20th century, Titanium and its alloys were used with better properties than the aforementioned alloys[2].
Nowadays, modern techniques and materials have become more available for total hip and knee replacement, and cast Cobalt-based alloys appear to be the best material for this application. According to the American Orthopedic Surgeon [3], only in 2004, 46,000 hip replacements and 40,000 knee replacements were performed in the United States, which shows a great demand for surgical implants for needed patients.
When cast Cobalt is alloyed with Chromium and Molybdenum (also known as ASTM F-75), the mechanical properties of the alloy improve significantly as well as wear and corrosion resistance. Although Sang-Hak Lee has
demonstrated that wrought Co-Cr-Mo alloys (ASTM F799) have better mechanical properties than as cast [4], it is important to balance the alloy properties by providing adequate heat treatment and cooling rates to the cast alloy.
The as cast Co-Cr-Mo alloy by nature forms carbide blocks with a coarse dendritic microstructure and other defects, which are formed during the
solidification process. Hence, carbide morphology and control in grain refinement are rather important in the final properties of Co-base alloys.
1.2 Objectives of Present Study
The present study provides a deeper understanding of thermal effects in cast Cobalt base alloys and how much the thermally treated alloy differs from its
initial properties. The relationship between the exhibited amount of precipitated hexagonal phase and its corrosion rate under different surface thermal conditions in the alloy were investigated. The goal was to obtain a near 100% FCC matrix with minimal HCP phase under the mentioned conditions. In addition, it was expected to induce grain refinement in the alloy microstructure in order to increase the mechanical strength. In order to obtain the desired microstructure, this study focuses on achieving the following objectives:
a) Provide a grain refinement to the alloy microstructure
b) Promote a near 100% Ɛ-martensitic HCP or FCC phase in the alloy by employing surface fusion techniques, such as Laser and Tungsten Inert Gas (TIG) welding.
c) Understand how the corrosion resistance is affected by the amount of HCP or FCC phase in the alloy.
d) Identify any possible relationships between the generated microstructures and the corrosion resistance of the alloy.
CHAPTER 2. LITERATURE OVERVIEW
2.1 COBALT BASE ALLOYS 2.1.1 Cobalt
Cobalt is an allotropic metal with 2 crystal structures Face Centered Cubic (FCC) and Hexagonal Close Packed (HCP) present in the matrix. In pure Cobalt, the most dominant phase at room temperature is FCC crystal structure and it exhibits a metastable phase above the equilibrium transformation temperature. However, the HCP crystal structure is thermodynamically stable at room
temperatures below 417⁰C, where the allotropic transformation temperature starts by martensitic transformation. This phenomenon may be caused by the relatively rapid cooling rates during the casting process, where the FCC↔HCP kinetics transformation occurs slowly [5] [6] [7].
2.1.2 Kinetics Transformation Mechanisms FCC↔HCP
In order to understand the FCC↔HCP transformation mechanisms, it is necessary to address some primary concepts.
Defects in crystalline materials, such as dislocations, are necessary to be defined to evaluate the mechanical properties of a material. The concept of dislocations comes from plastic deformation in crystalline materials, where the application of a shear stress to a crystal lattice produces an elastic distortion. Further stressing beyond the yield point leads to dislocation slip along slip systems [8].
In a FCC crystal unit cell, usually dislocation glide occurs in the close packed plane (111) in a type direction, and the burgers vector magnitude is 〈 〉. For an HCP unity cell, dislocation glide occurs preferentially along (0001) planes in 〈 〉 direction with a burgers vector magnitud of
〈 〉.
Another component which plays a critical role in the case of Ti and its alloys is the Stacking Fault Energy, γ. It can be considered as a surface defect and it is defined as the surface energy associated with a a local interruption in the stacking sequence of the crystal structure. The local displacement is typically seen in planes with ABCABC sequence, such as FCC crystal structures.
In the example of Figure 1, the first layer of atoms on the bottom is denoted as A, the next layer as B, and the subsequent layer on the top as C. If the top layer C creates a direct contact with layer A by depleting layer B, stacking fault in the sequence of ABAB is formed. As a result, the continued addition of more layers creates the Hexagonal Closed Packed crystal structure HCP.
Extrinsic stacking faults refers to when one atom layer disrupts the plane system and it is introduced between the B or C layer. In contrast, when an atom layer is removed in such a way that it alters the plane sequence, it is called intrinsic stacking fault. (See Figure 3).
Figure 1. Position of atoms in layers A B C for a face centered cubic crystal (FCC)
Figure 2. Position of atom layers in a Hexagonal Close Packed crystal structure
Figure 3. Interruption in the stacking sequence. a) Intrinsic stacking Fault b) Extrinsic Stacking Fault
The energy required to induce a change in the stacking sequence to from FCC to HCP is given by γ. When the magnitude of γ is to large, it is not possible to promote the development of extended dislocations as the energy needed to promote a shift in the stacking sequence is is to large to overcome. A relationship for the conditions needed for a change in stacking sequence can be described by the expression:
Equation 1
γ = Energy of a stacking fault G = Elasctic strain energy
= Scalar product of the Burgers vector d = distance between burgers vector product
2.1.3 Partial Dislocations
In contrast to stacking fault theory, Shockley partial dislocations will provide a force which favors the spliting of dislocations into extended ones. Due to energy considerations in the elastic strain energy (G= elastic strain energy and b= burgers vector), dislocations can split into shorter magnitude burger vectors unit “b.” For some crystals like FCC, this reaction becomes favorable when γ tends to zero, so the energy barriers are significantly reduced favoring the development of dislocation partials according to the following.
Equation 2 The burgers vector in an FCC crystal has a dimmension of and split into 2 burgers vectors of magnitude and glide in the (111) slip plane.
Figure 4. Dissociation of Shockley Partial Dislocations
The scalar product of the partial burgers vectors meets the equation and it becomes energetically favorable to split. The area formed between both partial dislocations is known as the stacking fault energy (SFE).
2.1.4 Cobalt Chromium Molybdenum Alloys
The addition of different chemical elements in Cobalt base alloy, such as Chromium, Molybdenum, and Tungsten help to strengthen the material. Also, small additions of Carbon improve the alloy castability. The Carbon content is essential because it dissolves in the FCC phase providing a solid solution which
together with other alloying elements enhances the strengthening properties of the alloy [9] [10].
Cast Cobalt alloys exhibit a dendritic microstructure with predominant Cobalt FCC-matrix. The dendritic structure is formed with predominant carbides of the type blocky carbides and other carbide phases [11] [12]. These
blocky carbides are formed during the dendritic solidification in the interdendritic regions at temperatures around 1200°C [11].
Chromium, Molybdenum, and Tungsten lower the stacking fault energy in the alloy and thus help to stabilize the HCP structure. The presence of extended dislocations in low stacking fault Co-alloys causes dislocations to move along the slip planes. Hence in the ε-martensite HCP phase the extended dislocation are unable to easily climb or cross slip directly affecting the mechanical deformation in the alloy [8].
2.1.5 Kinetics Phase Transformation FCC↔HCP in Co-Cr-Mo-C Alloys
Rearragement of the crystal structure and the kinetcs of the transformation exhibited in Co-Cr-Mo alloys can be addressed as a martensitic transformation reaction [10 [13]. A martensitic reaction is the lattice deformation of a crystal in the solid state due to a fault in the plane of close packed structures, and it could be induced by athermal transformations, dislocations, and strain induced
nucleation [14].
According to Saldivar and Lopez [15], the FCC↔HCP transformation temperature when the as-cast Cobalt is alloyed with Cr-Mo-C increases in the
range between = 800 to 875°C by isothermal aging. In addition, Saldivar considers that increases to 970°C in wrought Co alloys with low carbon addition (Co-27Cr-5Mo-0.05C) [16]. Therefore when temperatures are induced above the transformation temperatures in the as cast alloy, the interdendritic morphology tends to dissapear and the grains are refined. However, the ∝-FCC phase is retained after the alloy solidifies.
As discussed before, the FCC phase may promote the martensitic HCP phase in Co-Cr-Mo-C alloys if the thermal conditions are met. There are three different methods to induce ɛ-martensitic HCP phasein the alloy: athermal HCP transformation, isothermal HCP transformation, and starin induced HCP
transformation.
2.1.6 Athermal Transformation
In 1976, Vander Sande, Coke, and Wulff [17] proposed that after heat treatment solution annealing in Co-Cr-Mo-C alloys, the FCC phase continue as predominant phase in a metastable state in the alloy microstructure. However, an increment of stacking faults helped to determined the formation of the HCP
phase in the alloy. Later in the 1990s, Rostoker and Dvorak [18]. Demonstrated by characterization techniques the formation HCP in Co-Cr-Mo-C alloys after quenched at room temperature from 1300°C.
2.1.7 Isothermal Transformation
Initial stages of the FCC↔HCP transformation was observed by Vander Sande in Co-Cr-Mo- alloys with low carbon content by annealing solution and rapid quench [17]. The small percentage formation of the HCP phase found in the alloy microstructure (approximately 5%) led to investigate the alloy using isothermal aging heat treatment at 650°C to 750°C. It was observed that after long period of time the formation of the ɛ-martensitic HCP phase was
predominant in the alloy (approximately 95%) due to the increment in stacking fault in the FCC phase. Furthermore, Zangeneh, Lashgari, Saghafi, and
Karshenas confirmed the same results using isothermal aging temperatures of from 850°C to 950°C as well as the increment in the alloy hardness.
2.1.8 Strain Induced Transformation
The formation of ε-materiste in Co-Cr-Mo-C alloys can be achieved by plastic deformation. The development of fine intergranular striations found in the α-phase corresponds to the nucleation of martensitic HCP phase [19]. In
addition, Mani, Salinas and Lopez [20], found that the development of the HCP phase in Co-Cr-Mo-C alloys at room temperature can be induced by applying plastic deformation and it increases by isothermal aging prior elastic straining of the alloy.
2.2 FUSION WELDING THEORY 2.2.1 Definition
Fusion welding is described as a process that joins two metallic materials by involving melting and solidification from both parts. There are three different fusion welding processes in order of heat source increment, and they are classified as the following [21]:
Gas Welding:
Oxyacetylene Welding (OAW) Arc Welding
Shielded Metal Arc Welding (SMAW)
Gas Tungsten Arc Welding (GTAW)
Plasma Arc Welding (PAW)
Gas Metal Arc Welding (GMAW)
Flux Cored Arc Welding (FCAW)
Submerged Arc Welding (SAW)
Electroslag Welding (ESW) High Energy Beam Welding
Electron Beam Welding (EBW)
Laser Beam Welding (LBW)
The two fusion welding processes, which were used in this investigation, were Gas Tungsten Arc Welding and Laser Beam Welding.
2.2.2 Gas Tungsten Arc Welding (GTAW)
GTAW is a fusion welding process that uses a non-consumable Tungsten electrode and melts and joins the metal. The welding process is created by maintaining the electric arc formed by the electrode and the workpiece. Gas Tungsten arc welding is also known as Tungsten Inert Gas (TIG) because the welding process employs a Tungsten electrode to protect the work environment. The Tungsten electrode is connected by a welding cable directly to an electrical terminal and a water coolant system (contact tube)as shown in Figure 5. The environment is shielded or protected by Argon, Helium, or both, and it is fed through the torch. Also, the shielding gas makes contact with the Tungsten electrode to avoid oxidation and contamination from air in the weld.
Figure 5. Gas Tungsten Arc Welding process: a) Entire scheme of the welding process. b) Closer view inside the welding area. [21]
Selection of the electrode in GTAW process is very important. Tungsten possesses a relatively high melting point (approximately ~1980⁰C) and it doesn’t vaporize. Therefore the inconsumable Tungsten electrode will not melt, so it is not used as filler metal during welding as other fusion welding processes do. However, improper operation of the GTAW equipment (wrong current, electrode type, or wrong technique used) may cause melting the electrode and deposition of Tungsten particles in the weld, which creates brittle intermetallic compounds.
Tungsten electrodes may either be pure or alloyed with other elements, such as thorium, zirconium oxide, cerium, or lanthanum. A pure Tungsten
electrode provides good arc stability with either Argon or Helium shielding gases. It is commonly used to weld Aluminum and Magnesium. In order to carry high current capacity in the welding process, thorium is added in the electrode. The addition of thorium will provide a desirable electrode with better electron emission quality [22].
One main factor considered for selecting the proper electrode is the type of welding current. There are 3 types of different polarities used in GTAW process: Direct current electrode negative (DCEN), direct current electrode positive (DCEP), and alternating current (AC).
Direct current electrode negative, also known as straight polarity, is commonly applied to weld almost all metals, except Aluminum and Magnesium. The torch is connected to a negative terminal of the power source and the workpiece is connected to a positive terminal. When the electric arc is created, the electrons will flow from positive to a negative charge. That is why most of the emitted heat (70%) enters to the workpiece and forms a deep penetration in the weld joint.
In contrast, in direct current electrode positive polarity the torch is connected to a positive terminal of the power source and the workpiece is connected to a negative terminal. The electrons will flow in the same manner as DCEN polarity, but now the heat is concentrated in the Tungsten electrode rather than in the workpiece. Because of how the electrons flow, this type of polarity is known as reverse polarity. The weld joint has a small penetration, large fusion zone, and liquid coolant must be employed to avoid melting of the electrode.
Alternating current polarity will change the direction of current flow. The electrode will become positive and the workpiece negative at certain times, and the direction of current flow will alternate to negative at the electrode and positive at the workpiece during another given time. This type of polarity is mostly used to weld Aluminum alloys because it has an intermediate weld penetration and shielding gas protects the workpiece.
The biggest advantage for using the TIG welding process is that it can weld thin sections with limited heat input, and it is widely applied for welding Aluminum, Magnesium, Copper, Stainless steel, etc. Other advantages for
considering TIG process are high weld quality, deep penetration with small HAZ region in the weld joint, control of current and energy input, less distortion, and no smoke or sparks during the welding process. However, increasing the welding current may cause dissolution of the Tungsten electrode and promote brittle intermetallic inclusions in the weld joint.
2.2.3 Laser Beam Welding
Lasers have been developed since the postulation of emission of stimulated electrons and quantum mechanics principles in the 20th century. Lasers
continued the interest in physics until 1970s. In the 1980s, Laser beam welding became available in the solid state and CO2 state for the production of metal working. Since then, the efficiency of LBW for joining metals has become more attractive and interesting to the welding industry.
Figure 7. Development of LBW process in the market from 1980’s to the 2000’s [23].
Figure 8. Development of Laser sources throughout the years [23].
Figure 9. Weld penetration of CO2 Laser at different power sources [23].
Laser Beam Welding is a technique that melts and joins metals by
applying high power density. A scheme in Fig. 9 shows the penetration depth of CO2 Laser welding at different power sources.
LBW can be in solid state laser, gas state laser, and semiconductor or diode laser. The reason for using CO2 laser is based on the quality and speed of welding on some materials like Nitinol.
Figure 10. YAG Four level laser welding system [24].
In solid state laser, the Yttrium Aluminum Garnet (YAG) single crystal is doped with Neodymium. Gas molecules become excited from ground state level (1) to higher energy levels (4) due to high input intensity. The laser transition from state (3) to state (2) occurs once the Neodymium ions decay to level (2) and they quickly relax back to the ground state to begin the process again. The
energy released in the form of photons is called laser.
Similar to the concept in YAG laser, gas state laser follows the same principle with the exception of a gas mixture of N2, CO2, and He that are employed. The difference between YAG and CO2 lasers is that in CO2 state Nitrogen molecules will excite CO2 molecules to emit energy, and finally He atom will stabilize CO2 atoms to lower energy states.
LBW is commonly used in open environments, and the use of gas shielding is highly recommended to protect the weld from oxidation and contamination. If shielding gas is avoided, the laser beam will be ionized and absorbed by the plasma formed during welding. This phenomenon contributes to minimized depth of penetration; therefore removing plasma is necessary to apply shielding gas, such as Helium or Argon. Argon will be chosen for better results in depth of penetration because the ionization of Helium is more achievable than in Argon due to high energy ionization of He (24.5 ev) compared with Ar (1.5 ev) [25].
Figure 13. Energy released by electron emission in Laser beam welding [21].
Some advantages of using LBW are:
Process: High power density, small beam diameter, high welding speed, noncontact between the nozzle and the metal.
Work piece: Minimum thermal stresses, little distortion, materials can be welded at different positions.
Installation: Short cycle times, several operation stations can be possible, simple automatic installation.
However, the surface should be modified by roughening, oxidizing, or coating in the metal in order to avoid high reflectivity of the laser beam, especially if the metal is polished. Also, the equipment is expensive and high skilled operators are needed to obtain high quality results in the weld.
2.2.4 Heat Flow
Once fusion welding process is applied to metallic materials, the power density of the heat source will cause a change in the weld joint. Fast solidification from the liquid to solid state in the weld pool may promote a different phase in the microstructure, as well as different grain size. In order to control or take
advantage of physical properties in the solidified region, it is important to understand the relationship between power density and heat source.
The heat source depends on the welding process that is being used, and it could produce a narrow and deep penetration keyhole (high energy welding process) to a wide and not fully weld penetration (gas welding processes). The difference on both processes is how much heat has been introduced and spread over the workpiece. In Figure 14, the relationship between heat input and power density of the heat source in LBW shows that the gas flame may produce
damage to the workpiece due to the slow conduction of heat to the workpiece. On the other hand, high energy beam welding process conducts the heat and melts a localized area on the workpiece, which results in a high quality weld joint. However, high energy beam welding melts and solidifies the metal so fast that some elements, such as Mg and Pb may vaporize and damage the vacuum system [21].
Figure 14. Scheme of fusion welding processes according to the heat source and heat input introduced in the workpiece [21].
2.2.5 Fusion Zone
The final properties of the weld joint are directly related to how the metal solidifies and promotes the microstructure in the weld pool. The weld
microstructure contains 3 different zones: the fusion zone, the heat affected zone, and the base metal.
The fusion zone is formed when the welding temperatures reach the liquidus phase in the base metal and it solidifies, creating a new localized
microstructure. It is very important to understand the effect of solidification in the weld because it will determine the final microstructure morphology, grain size, solute redistribution, inclusions, etc. Therefore an uncontrolled solidification of the melt in the fusion zone is associated with defects and flaws, such as residual stresses, porosity, cracks, and distortion.
Solidification in metal alloys occurs at the liquid solid interface, and it starts when the freezing temperature reaches a thermodynamic equilibrium, where is the free energy in the liquid and free energy in the solid, and the freezing temperature is defined as “the temperature at which the free energy of the solid phase equals that of the liquid” [26]. Freezing in metal alloys is promoted by nucleation and growth process, where the nuclei forms first and then it leads to grow as a dendrite to finally form grains. The formation of new granular crystals during solidification depends on the S/L interface breakdown process. When the actual liquid temperature is below the liquidus temperature, segregated rich solute builds up and creates a boundary layer at the S/L interface. The difference between both temperatures is called the
freezing range and the thickness of the boundary layer is . If a tangent is drawn across the liquidus temperature at the S/L interface, a
relationship between the freezing range and the growth rate is calculated, which is followed by:
∝ Equation 3 Where:
Actual temperature gradient Growth rate
Freezing range
Diffusion coefficient in the liquid
Figure 16. Development of the solidification mode by the effect of constitutional supercoiling and the temperature gradient and growth rate [21].
2.2.6 Constitutional Supercooling
Constitutional supercooling is given by the ratio G/R and it determines the morphology at the S/L interface after solidification. There 4 modes of
solidification rates lead to a fine microstructure (equiaxed) while slow cooling rates or high G/R promote a planar microstructure.
2.2.7 Weld Grain Structure
As mentioned before, the morphology of the microstructure, grain size, and solute redistribution is controlled by the growth rate and temperature gradient G/R. Grain growth is dominated by the solidification of the weld, and it tends to grow opposite to the heat direction [21]. However, the welding speed is a very important parameter to consider because it provides the cooling time rate
needed for solidification. In other words, as the weld speed increases, the constitutional supercoiling increases as well leading to an epitaxial solidification
mode. On the other hand, if the weld speed is reduced, most likely columnar solidification mode takes place on the weld pool microstructure (See Figure 17).
Figure 17. Weld speed and constitutional supercoiling effect on the weld microstructure. a) Low welding speed. b) High welding speed [21].
2.3 Corrosion Theory 2.3.1 Definition
Corrosion is the electrochemical reaction of a material when it is exposed to a corrosive environment that results in its deterioration. There are four
requirements for a corrosion cell to initiate the electrochemical reaction process:
Anode
Cathode
Ion path
Electron path
Figure 18. Schematic diagram of a corrosion cell showing the electrochemical reaction processes [27].
At the anode metal atoms will change from solution into ions in the form of oxidation reaction, and here is where corrosion will initiate. On the other hand, the cathode, metal atoms are consumed in the form of reduction reaction, and no corrosion takes place.
The following corrosion mechanisms are typically found in deterioration of metallic materials:
Uniform: When a corrosive environment gets access to the entire metallic material and causes general corrosion on the surface of the metal.
Galvanic: Two dissimilar metals are in contact with each other in the presence of a certain environment. One of them will corrode while the other performs resistance to corrosion.
Crevice: Form of corrosion deposited in a crevice created by contact with another metal. The anode is isolated in the crevice surrounded by a passive surface acting as a cathode.
Pitting: Localized corrosion formed by the attack of an electrolyte to the metal surface. It is caused by the breakdown of the metal protective film at isolated sites.
Environmentally Induced Cracking
o Stress Corrosion Cracking: When static load stresses under a corrosive envirnoment cause uniform corrosion.
o Hydrogen Induced Cracking: Decarburization is a typical mechanism of hydrogen attack in carbon steels created by the diffusion of hydrogen ions and may cause embrittlement in the metal alloy.
o Corrosion Fatigue Cracking: It is caused by cycle stresses in a corrosive environment.
Intergranular: When corrosion attacks at the grain boundaries due to depletion of certain alloying elements. A classic example is sencitization in stainless steel, where Chromium is depleted from the matrix and exposes the material to corrosion.
Dealloying and Dezincification: Some examples are the the depletion of Zinc ions from brass.
Erosion: The movement of a corrosive fluid attacks and removes the metal alloy protective film creating erosion corrosion.
Fretting: Is initiated by repeated small movements, usually vibration, in a corrosive environment, and breaks the protective film from the surface of a metal alloy.
The mechanisms of corrosion are a function of kinetics, thermodynamics and difussion mechanisms. The basic process of corrosion in metallic materials involves electron transfer, and it is shown in Figure 19 where a metal is exposed in Hydrochloric solution .
Figure 19. Image of electron transfer mechanism of a metal under a corrosive environment [27]
The anodic oxidation of the reactive metal causes the Chloride atoms to break in a form of cathodic oxidation, the corrosion reaction and it is given by the equation:
anodic reaction
cathodic reaction
corrosion reaction
The corrosion reaction is associated with the change in free energy ∆G and the electrochemical potential E by the following equation:
Equation 4
Where:
Change in free energy number of electrons
Faraday constant 96,500 Coulombs Electrode potential
When the change in free energy is negative, the reacted products have lower energy than the reactants. Therefore there is a spontaneous reaction involving an exchange or transfer of electrons. The electrode potential will be given by the sum of the potentials for each half cell reaction, the anodic potential ( ) reaction plus the cathodic potential reaction ( ).
Equation 5
The reaction rate is caused by the electron transfer during oxidation and reduction reactions, and it is known as the exhange current density . The
exchange current density is an experimental term that cannot be calculated from theoretical principles.
Figure 20. Polarization curve between Electrode potential “E” and the Current density “i” [28].
The relationship between the electrode potential and the exchange current density of both the anodic reaction and cathodic reaction curves are governed by corrosion kinetics, which describe the polarization curves of corrosion reactions.
The interpolated point from the anodic and cathodic polarizations curves represents the corrosion current and the corrosion potential
respectively (Figure 20).
In order to better understand the term polarization, lets assume equation 5 and figure 21, the difference in electrode potential is caused by a deviation from the equilibrium half cell reaction, and it is named polarization ƞ. The
electrons from the metal M are removed in the form of anocid reaction ; as a result there is a positive electrode potential change which is known as anodic polarization . For cathodic polarization , the electrons supplied to the metal surface cause a negative electrode potential change [27].
Figure 21. Anodic and cathodic polarization reactions [27].
Equation 6
Equation 7
The Tafel constant could be positive or negative depending on the half-cell reaction. As mentioned above, the anodic overpotential is positive,
therefore the Tafel constant for the anodic half-cell reaction must be positive, and the Tafel constant for the cathodic half-cell reaction is negative due to the negative value of the cathodic overpotential .
2.3.2 Passivity
The formation of a protective oxidized thin film of metallic materials with high anodic polarization in corrosive environments is called “passivity” [27]. Most metals behave differently as the anodic polarization and electrode potential increase. Figure 22 demonstrates how the passive film and the active, passive, and transpassive regions are formed in the anodic and cathodic polarization curves.
Figure 22. Corrosion passive film protection [27].
The current density increases at very low electrode potentials within the “Active region” to a certain electrode potential , which is known as passivation potential
, and current density where the oxide film becomes stable and the anodic
metal passivation decreases drastically. In the passive region, the stable passive film grows in thickness at anodic potential at rates of 1nm to 3nm V−1 equivalent
to an electric field of 106 to 107 V cm−1 across the film [29] and the corrosion rate decreases . Once the oxidized passive film becomes unstable and the
anodic potential and current increase, the transpassive region is formed again near the oxygen evolution potential.
2.3.3 Corrosion Rate Measurement
There are three methods to measure corrosion rate, a conventional uniform corrosion rate by weight loss, Tafel extrapolation and polarization resistance. The last two methods are measured by electrochemical polarization and take much less time than weight loss uniform corrosion measurement.
2.3.4 Weight Loss Method
Uniform corrosion rate measurement by weight loss method is conducted in a laboratory using specialized equipment to simulate and reduce the time of exposure in corrosive environments. The specimens are exposed to the
corrosive environment for a long time in order to obtain sufficient corrosion product. Then corrosion rate is calculated from the coupon weight loss, followed by metallographic examinations to identify localized forms of corrosion [27]. Corrosion rate formulas are given by:
Equation 8
Equation 9
Corrosion rate in mil per year (1 mil is a thousand of an inch: 0.001in) Corrosion rate in micrometre per year
Corrosion weight loss in milligrams Density in grams per cubic meter Area in square inches
Time in hours
2.3.5 Tafel Extrapolation Method
The Tafel region is obtained by extrapolating the anodic and cathodic polarization currents (see Figure 21), and at this point the extrapolated corrosion potential corresponds to the corrosion rate in terms of current density.
This method is more is accurate under ideal conditions than the weight loss corrosion rate method. Also, Tafel plots have the advantage of measuring very low corrosion rates and help scientists to determine fast corrosion rates using inhibitors.
2.3.7 Polarization Resistance Method
In this method the applied exchange current density is a linear function of the electrode potential. From equations 6 and 7 the polarization resistance can be obtained in terms of corrosion rate ( ).
Equation 10
Equation 12
It is important to mention that the polarization resistance method uses the plot of . Also, it can measure corrosion rates at each reading during the test. In other words, it can be completed in a very short period of time. If the plot is curved, the polarization resistance can be obtained by drawing a tangent line to the curve at the corrosion potential and at zero
CHAPTER 3: EXPERIMENTAL PROCEDURE
3.1 Cast Co-Cr-Mo-C alloy Process
In this investigation, the studied material is cast Cobalt Chromium
Molybdenum alloy, also known as ASTM F-75. It is part of a combined work by the Mexican Corporation for Research in Materials (COMIMSA) in Saltillo, Coahuila, Mexico, the Amirkabir University of Technology in Tehran, Iran, and the University of Wisconsin Milwaukee, United States. The Co-Cr-Mo alloy was processed by using an investment casting technique, thermally treated by fusion welding, and delivered by COMIMSA (Saltillo, Mexico) to understand the thermal effect of the alloy microstructure on its corrosion resistance.
In order to make the investment mold prior to pouring the molten metal, a pattern shape of the component was designed. The desired pattern shape was made of plaster, then layered with liquid wax, and assembled onto a sprue system that creates the final tree or mold required for investment casting. Each desired pattern, which is the exact replica of the component, has dimensions of 2 cm length, 2 cm width, and 0.8 cm thickness. The pattern is covered by liquid wax; once the wax is dried, the pattern will be extracted. This procedure is repeated many times to create several patterns. The feeding and gate system is also made of plaster, and it will be layered with liquid wax and extracted the same as all the other patterns. In order to create the final mold required for investment casting, the wax molds are assembled one by one onto the sprue. The tree is submerged into ceramic slurry and then covered by dry sand for six
times to produce six ceramic layers to then provide the final ceramic mold. The ceramic mold is taken to a furnace to dewax and to add resistance to the final mold. The chemical composition of the as cast Co-Cr-Mo-C alloy is described in table 1 in accordance with ASTM F75/12 standard.
Table.1 Chemical composition of as cast ASTM F75 alloy [30].
3.2 Welding Process
The cast Co-Cr-Mo-C alloy surface was thermally treated by two different fusion welding techniques: Laser Beam Welding (LBW) and Gas Tungsten Arc Welding (GTAW)
Laser surface treated samples were sent by COMIMSA in the following conditions:
a) As cast Co-Cr-Mo-C alloy in accordance with ASTM F75 standard. Table1 b) The as cast Co-based alloy ingot was sectioned in cylindrical disc shapes
using waterjet equipment with dimensions of 3.92 cm in diameter by 0.70 cm in width. The sectioned samples were ground up to 1200 SiC grit paper. To avoid surface reflection, samples were sand abrasive.
c) Laser Beam Welding technique was employed to provide laser melting spots on the surface of the as cast Co-based alloy.
Required Balance >34 27 to 30 5 to 7 0.35 max. 1.5 max.
Experimental Balance 28 5 0.3 1.5
Nd:YAG pulsed laser model HTS LS P-160 with a 1064 nm wavelength.
The welding environment was protected by Argon gas (1.5 L/min) to avoid metal oxidation.
A laser beam spot has a diameter of 0.8 ± 0.05 mm on the work piece.
The pulse frequency for all the tests was fixed at 8 .
Laser beads were overlapped 50% on top of each other. A
schematic representation of the LSM process on the disc plates is shown in Figure 23.
Figure 23. Schematic representation of the LSM process on the Co-Cr-Mo alloy disc plates [42]
Amirkabir University of Technology, Tehran, Iran has supported this
using the GTAW technique. The following solution heat treatment and welding parameters in the alloy were employed:
a) An as cast Co-Cr-Mo-C alloy ingot of similar composition as mentioned in Table 1 after a solution heat treatment at the temperature of 1230 ±5⁰C for 3 hours in a tubular furnace under Argon inert gas atmosphere, followed by quenching in water at room temperature.
b) The heat treated alloy was cut into rectangular plates with dimensions of 100 mm, 25 mm, and 4 mm respectively.
c) GTAW process was employed to promote melt on the heat treated sample surface by using Miller TIG torch with a constant voltage of 15V and 110A of current. A TIG torch speed of 180 mm/min was used on a sample subjected to no mobility, and protected by Argon gas.
3.3 Metallographic Sample Preparation
First, all samples were cross sectioned and mounted in an automatic mounting press Buehler Simplimet 1000. The metallographic samples were prepared by mechanical polishing in Silicon Carbide paper 400, 600, 800, and 1200 followed by cloth polishing in 1µm and 0.5µm of respectively. The sample was electrolytic etched in a solution of 10gr. 5ml. and distilled water at 4 volts for 10 seconds (Figure 24).
Figure 24. Electroetching equipment Buehler Electromet
3.4 Micro-hardness Test
A Micro-hardness test was carried out using a Buehler Micromet II digital micro-hardness tester. The hardness readings were taken from the weld pool surface edge to the core of the sample. Each indentation was separated 0.005 inch from each other, and they crossed through the Heat Affected Zone until the base metal was reached.
3.5 Optical Microscopy
In order to observe the alloy microstructure, Zeiss Axio Vert.A1 Optical Microscope was utilized.
Figure 26. Optical Microscope Zeiss Axio Vert.A1 (left) and Stereo Microscope Zeiss (right)
3.6 Scanning Electron Microscopy
The alloy microstructure and quantitative chemical analysis of all specimens were performed using a Topcon SM300 Scanning Electron Microscope at 20KV of intensity.
Figure 27. Topcon SM300 Scanning Electron Microscope equipment with incorporate EDS analysis
3.7 X-Ray Diffraction
The XRD equipment used for this investigation was a Bruker D8 Discover X-Ray Diffraction using Cu Kα radiation and 40KV primary beam at the 2θ range of 35⁰ to 55⁰ at room temperature. The quantity of phase transformation
FCC↔HCP was determined from the integrated X-Ray diffraction patterns. Quantitative calculations of the developed HCP phase in the alloy
microstructure was proposed by Sage and Guillaud [31],They suggest to take into account only the diffraction patterns corresponding to and the
̅ because they are the only well distinguished and not overlapped diffraction patterns at a given 2θ. The formula to calculate quantitatively the FCC↔HCP phase transformation in Co-Cr-Mo-C alloys is:
Where:
HCP volume in weight percent
Integrated area of the intensity peak for the cubic phase
̅ Integrated area of the intensity peak for the hexagonal phase
Figure 28. Extended scheme of the Bruker D8 Discover X-Ray Diffraction equipment (left). A closer look of the X-Ray source and detector (right).
3.8 Corrosion Test
The corrosion rate in the alloy was measured by interpolating
potentiodynamic curves. The instrument used for test corrosion was VoltaLab PGZ 100. A saturated calomel electrode (SCE) model RE-2B was employed as an electrode reference. The galvanic corrosion cell was protected by Argon gas and the specimens were immersed in Ringer solution (1L distilled water, 8.6 gr. , 0.33 gr. , and 0.30 gr. )
Figure 29. Isolated system equipment for the corrosion test
Figure 30. Installation of the corrosion cell system
CHAPTER 4. RESULTS AND DISCUSSION
4.1 Microstructure
4.1.1 As received Cast Cobalt-base Alloy
Defects, such as porosity, were identified in the as cast microstructure, which are typical of casting structures as shown in Figure 33.
The as cast alloy was found to contain coarse blocky carbide precipitates of approximate 25 µm to 200 µm in size with dominant carbide type at
interdendritic regions in the alloy microstructure. Although Kilner [33] has reported lamellar pearlitic regions containing α-FCC phase and M6C3 carbide type in cast Co-Cr-Mo alloys. EDS analysis demonstrate Co and Cr as dominant elements in the matrix, which are associated to the α-phase (Figure 37). Also, pearlitic-like lamellar regions were found in the carbide morphology, where the content of Cobalt reduces as Molybdenum and Chromium increases significantly (Figure 38).
Figure 33. Optical image at 200X of the as received cast Co-Cr-Mo-C alloy exhibiting porosity
Figure 34. Optical image of the cast Co-Cr-Mo-C alloy microstructure taken at 200X exhibit grain size of approximate 150 µm.
Figure 36. SEM image of alloy microstructure at 2kX magnification
Figure 38. EDS analysis in the carbide precipitae (Co-Cr-Mo 23 C6)
In addition, little black spots found in the alloy microstructure, which were reported by Giacchi as inclusions [33]. EDS analysis confirms the presence of inclusions rich in Silicon found in the as cast matrix (Figure 40).
Figure 39. SEM image taken at 1500X confirms the appearance of inclusions inside the matrix alloy
Figure 40. EDS analysis of the inclusion rich in Silicon
In cast Co-Cr-Mo-C alloys it is expected to find a dominant FCC phase in the alloy microstructure. The X-Ray analysis displays a large intensity peak at the 2θ angle of 50.5°. This pronounced peak corresponds to the crystal FCC phase in the alloy, and a small peak corresponding to the developed HCP phase is located at 2θ angle of 46.5° respectively.
Quantitative calculations of the developed HCP phase using Equation 13 displays 13% ɛ-martensite phase developed in the as cast microstructure. This result can be attributed to the small volumen fraction of HCP remained in the cast microstructure upon relative slow solidification [8].
Figure 41. XRD patterns of the as cast Co-base alloy
4.1.2 Annealed Specimen
As mentioned before in the experimental section, the received annealed heat treated and surface modified using TIG welding Cobalt-base alloy
specimens were delivered by the Amirkabir University of Technology in Tehran, Iran. An image of both as received specimens is shown in Figure 42.
Figure 42. As received Solution annealed specimen (left). As received TIG melted specimen (right)
Solution heat treatment at 1230⁰C promoted carbide dissolution in the alloy microstructure, given rise to increase ductility [34]. A fine distribution of carbides at the interdendritic regions was found in the microstructure with possible M23C6 carbide type formation along the grain boundaries of approximate 7 µm to 15 µm in size (see Figure 43).
EDS analysis displays Cr-rich carbides with Cr content of up to 53 wt%, and silicon rich inclusions (49 wt%) in the FCC-Cobalt matrix were found, similar to the as cast sample (see Figure 44 and 45). Apparently the Si-compounds remained stable during the solution annealing treatment.
Figure 43. SEM image taken at 1500X of the annealed specimen exhibiting approximate 30 µm in grain size.
Figure 44. EDS analysis image of a possible carbide precipitate
The amount of athermal transformation (HCP phase) after solution annealing at 1230°C was calculated quantitatively using the X-Ray diffraction patterns and the Sage and Guillaud method [31].
It was found that approximately 24% HCP phase has been formed after cooling from the solution annealing treatment at 1230⁰C. Apparently, most of the metastable FCC phase was retained after quenching in water at room temperature. Also, intensity peaks demonstrate that heat treatment above 1150°C promotes ε-martensite phase after quenching at room temperature due to the FCC↔HCP kinetics of athermal transformation [35]. Furthermore, it has been reported that the increment of the HCP phase by athermal transformation is a function of the temperature used in solution annealing and the holding time [36].
̅
̅
4.1.3 TIG Surface Modified Specimen (TIGSM)
After solution annealing, the sample surface was cleaned and welded using TIG fusion welding process. Once the melt on the surface metal solidifies, the alloy microstructure rearranges itself into fine grains and dendritic regions. However, the difference in solidification rates promotes inhomogeneous dendrite distribution in the fusion zone as shown in Figure 47.
Figure 47. Stereo microscope image of the TIG surface modified specimen. The fusion zone, the heat affected zone, and the base metal can be identified once
Figure 48. SEM image of the TIGSM specimen at 200X
The weld pool, close to the edge surface, contains uniform solute distribution with homogeneous dendritic and equiaxed regions in the microstructure as can be seen in Figure 49 and 50.
Figure 50 Optical microscope image of the weld pool at 400x in the TIGSM specimen
A reason for presenting a homogeneous microstructure close to the surface is the relative difference in solidification time as compared with the HAZ [21]. On the other hand, large dendritic regions with direction towards the fusion zone can be seen in Figure 51 and 52 as the HAZ is approached.
Figure 51. Optical microscope image of the weld pool at 400X in the TIGSM specimen
Figure 52. Optical microscope image of the weld pool at 400X in the TIGSM specimen
Columnar and equiaxed solidification modes can be distinguished in the weld area with grain refinement from 150 µm presented in the as cast alloy to approximate 10µm in the TIG surface modified specimen respectively.
Moreover, according to Figure 56, possible carbide precipitates along grain boundaries on a nanoscale size and Cr-rich were found in the solidified microstructure. Carbon precipitation in the fusion region may be associated with carbide type formation the same as type M23C6 found in the as cast alloy microstructure. Even though there are no confirmed results in literature of the type of carbides found in welded Co-Cr-Mo-C alloys, based on EDS results, the high cooling rates promoted by the TIG process may follow the same path in the precipitation of carbon. Similar results were found by Zangeneh and Lopez in surface melted Co-Cr-Mo-C alloys by TIG, where carbide precipitates in the form of CoCrMo23C6 were observed [37]. In addition, Silicon was identified by EDS analysis where it precipitated along the grain boundaries (see Figure 57).
Figure 53. SEM image of weld pool at 1500X in the TIGSM specimen
Figure 54. SEM image of the weld pool at 7kx in the TIGSM specimen describes an approximate grain and carbide precipitate sizes of 10µm and 5µm
Figure 55. EDS analysis image of the grains inside the weld pool of the TIGSM specimen
Figure 56. EDS analysis image of carbide precipitates found in the weld pool of the TIGSM specimen
Figure 57. EDS analysis of the weld pool in the TIGSM specimen containing silicon inclusions along the grain boundaries
As the heat affected zone is approached, the solidified HAZ region presents a heterogeneous dendritic columnar solidification mode due to slow growth rate at the solid/liquid interface. As some coarse grains and interdendritic regions are noticed in the HAZ, the weld microstructure returns to its original form of the base metal microstructure.
Figure 59. SEM image of the HAZ at 2kX in the TIGSM specimen
X-Ray diffraction was used to calculate the developed HCP phase in the weld region. The calculation of phase formation in the TIG treated alloy follows the same procedures as mentioned before for the as cast specimen. The TIG
process promoted the development of partial ε-martensite HCP phase in the alloy microstructure (approximately 51%).The kinetics of transformation FCC↔HCP phase above 1100°C suggests that after quenching at room temperature from γ -FCC phase, HCP embryos will start developing and increasing as time and temperature is increased [38].
Figure 60. XRD patterns of the TIGSM specimen
4.1.4 Laser Surface Modified Specimen (LSM)
Figure 61 illustrates how Laser beam process was applied to promote local heat in the as cast Co-Cr-Mo-C alloy in order to calculate the developed ɛ -HCP phase and compare the results with the other specimens.
Figure 61. Image of the as received Co-Cr-Mo-C alloy. Laser surface modified specimen (left) and the laser weld beads profile taken in stereo microscope
(right).
Figure 62. Optical microscope image of the laser weld beads taken at 200x
After promoting melting on the surface alloy by the bombardment of electron beams, it was found that fine homogeneous cellular solidification mode (see Figure 63) takes place in the microstructure with ultrafine grain size of approximately 2µm as it is shown in Figure 66.
Figure 63. SEM image of the weld pool taken at 1500X for the LSM specimen
Figure 64. SEM image of the weld pool taken at 5kX for the LSM specimen
![Figure 7. Development of LBW process in the market from 1980’s to the 2000’s [23].](https://thumb-us.123doks.com/thumbv2/123dok_us/1405761.2688193/32.918.308.659.664.931/figure-development-lbw-process-market-s-s.webp)
![Figure 13. Energy released by electron emission in Laser beam welding [21].](https://thumb-us.123doks.com/thumbv2/123dok_us/1405761.2688193/36.918.389.599.120.486/figure-energy-released-electron-emission-laser-beam-welding.webp)
![Figure 16. Development of the solidification mode by the effect of constitutional supercoiling and the temperature gradient and growth rate [21]](https://thumb-us.123doks.com/thumbv2/123dok_us/1405761.2688193/40.918.324.642.369.715/figure-development-solidification-effect-constitutional-supercoiling-temperature-gradient.webp)
![Figure 19. Image of electron transfer mechanism of a metal under a corrosive environment [27]](https://thumb-us.123doks.com/thumbv2/123dok_us/1405761.2688193/44.918.322.651.709.995/figure-image-electron-transfer-mechanism-metal-corrosive-environment.webp)
![Figure 20. Polarization curve between Electrode potential “E” and the Current density “i” [28]](https://thumb-us.123doks.com/thumbv2/123dok_us/1405761.2688193/46.918.333.624.195.513/figure-polarization-curve-electrode-potential-e-current-density.webp)
![Figure 23. Schematic representation of the LSM process on the Co-Cr-Mo alloy disc plates [42]](https://thumb-us.123doks.com/thumbv2/123dok_us/1405761.2688193/54.918.304.672.543.823/figure-schematic-representation-lsm-process-alloy-disc-plates.webp)