Differentiating plant functional types using reflectance:
which traits make the difference?
Teja Kattenborn , Fabian Ewald Fassnacht & Sebastian Schmidtlein
Institute of Geography and Geoecology (IFGG), Karlsruhe Institute of Technology (KIT), Kaiserstr. 12, 76131 Karlsruhe, Germany
Keywords
Hyperspectral, plant functioning, plant strategies, plant traits, PROSAIL, radiative transfer modelling
Correspondence
Teja Kattenborn, Institute of Geography and Geoecology, Karlsruhe Institute of Technology (KIT), Kaiserstr. 12, 76131 Karlsruhe, Germany. Tel: +49 721 608 43829; Fax: +49 721 608 46927; E-mail: [email protected] Funding Information
The project was funded by the German Aerospace Centre (DLR) on behalf of the Federal Ministry of Economics and Technology (BMWi), FKZ 50 EE 1347. The project is part of the preparation of the EnMAP satellite mission. We acknowledge support by Deutsche Forschungsgemeinschaft and open access publishing fund of Karlsruhe Institute of Technology.
Editor: Harini Nagendra Associate Editor: Kate He
Received: 11 February 2018; Revised: 23 April 2018; Accepted: 4 May 2018 doi: 10.1002/rse2.86
Remote Sensing in Ecology and Conservation2019;5(1):5–19
Abstract
Abiotic ecosystem properties together with plant species interaction create dif-ferences in structural and physiological traits among plant species. Certain plant traits cause a spatial and temporal variation in canopy reflectance that enables the differentiation of plant functional types, using earth observation data. How-ever, it often remains unclear which traits drive the differences in reflectance between plant functional types, since the spectral regions in which electromag-netic radiation is influenced by certain plant traits are often overlapping. The present study aims to assess the relative (statistical) contributions of plant traits to the separability of plant functional groups using their reflectance. We apply the radiative transfer model PROSAIL to simulate optical canopy reflectance of 38 herbaceous plant species based on field-measured traits such as leaf area index, leaf inclination distribution, chlorophyll content, carotenoid content, water and dry matter content. These traits of the selected grassland species were measured in an outdoor plant experiment. The 38 species differed in growth form and strategy types according to Grime0s CSR model and hence represented a broad range of plant functioning. We determined the relative (statistical) con-tribution of each plant trait for separating plant functional groups via reflec-tance. Therein we used a separation into growth forms, that is graminoids and herbs, and into CSR strategy types. Our results show that the relative contribu-tion of plant traits to differentiate between the examined plant funccontribu-tional types (PFT) groups using canopy reflectance depends on the PFT scheme applied. Plant traits describing the canopy structure were more important in this regard than leaf traits. Accordingly, leaf area index (LAI) and leaf inclination showed consistently high importance for separating the examined PFT groups. This indicates that the role of canopy structure for spectrally differentiating PFT might have been underestimated.
Introduction
Structural, physiological and phenological characteristics of a plant (hereafter traits) determine its performance in terms of growth, reproduction and survival. Environmental gradients of climate, topography or soil properties together with species interaction drive the variation in traits among plant species (Grime 1988; Wright et al. 2004; Dıaz et al., 2016). Species can thus be assigned to plant functional
types (PFT) that group species with common functional traits (Lavorel et al. 1997).
Even coarse map products of PFT distributions can be of high value as input for dynamic ecosystem models (Smith et al. 2001; Sitch et al. 2003) and earth system models (Poulter et al. 2011) as they provide a direct link to physiological plant properties. The Group on Earth Observation’s Biodiversity Observation Network (GEO BON) regards functional types as essential for monitoring
biodiversity from space (Paganini et al. 2016). Hyperspec-tral earth observation (EO) data is ascribed a high poten-tial to determine the spapoten-tial distribution of PFT and thus ecosystem properties as multipleplant traits exhibit a trackable this spectral response is driven by the relation-ship of these plant traits and electromagnetic radiation, i.e. absorption and scattering processes within the canopy. Hyperspectral EO-sensors measure the reflected electro-magnetic radiation and hence indirectly optically relevant plant traits. On this basis, previous studies used hyper-spectral EO-data and empirical models to produce
con-tinuous maps of the spatial distribution of PFT
(Schmidtlein et al. 2012; Feilhauer et al. 2016b). However, it often remains unclear, why this actually works, i.e. which traits help us to differentiate between PFT.
Several authors (Asner and Martin 2009; Ustin and Gamon 2010; Jetz et al. 2016) list plant traits (e.g. pig-ment, dry matter, nitrogen or phosphorus content), which are supposedly important to optically differentiate plant functioning. However, knowledge about the physical contribution of these traits for differentiating PFT by reflectance remains limited. One reason for this is that most approaches using hyperspectral data are data-driven and based on complex statistical algorithms to exhaust the information content and to cope with the high data dimensionality. However, the “black-box” nature of such empirical approaches generally cannot show causal rela-tionships between the remotely sensed signal, plant traits and functioning.
Assessing the contribution of individual traits is chal-lenging as the canopy reflectance represents the integrated effects of various optical traits (Kokaly et al. 2009; Ollin-ger 2011). Thus, the reflectance at a given wavelength is driven by multiple plant traits. For instance, chlorophylls, which are fundamental for light harvesting, are known to absorb light in the spectral region between 400 and 700 nm. However, reflectance in these regions is also influenced by other traits such as total leaf area, leaf ori-entation or mesophyll structure (Jacquemoud et al. 2009). Thus, the contribution of a trait to discriminate plant functional types might be optically overshadowed by other traits acting in the same spectral region. Accord-ingly, relationships between multiple plant traits, plant functioning and canopy reflectance might not be traceable using statistical or machine learning models which do not explicitly consider known interactions between individual plant traits. In other words, a high importance of the visual part of the spectrum for separating between two plant functional types found by a data-driven model is not automatically a consequence of differing plant pig-ments compositions.
A possibility to improve our understanding of the spec-tral response of different PFT is given by canopy radiative
transfer models. Canopy radiative transfer models inte-grate established knowledge on how plant traits interact with electromagnetic radiation into a process-based model. They are hence suitable to describe in a mechanis-tically oriented way how traits trigger reflectance. This provides an alternative, disentangled view on the origins of differences in reflectance between PFTs, with a better chance to identify causal links between canopy reflectance, plant traits and PFT.
The currently most established radiative transfer model for vegetation canopies is PROSAIL (Jacquemoud et al. 2009), which couples two models addressing different ori-gins of variability in reflectance: PROSPECT modelling the optical properties of single leaf surfaces and 4SAIL which accounts for variability in canopy reflectance caused by differences in leaf orientation and foliage con-tent of a plant canopy as well as its relation to sun and sensor. PROSAIL can be used to simulate the hyperspec-tral reflectance of plant canopies (e.g. as measured by an airborne or spaceborne spectrometer) as a function of defined plant traits. The incorporated plant traits are restricted to those, which could be implemented with acceptable accuracy during the development of 4SAIL and PROSPECT and are hence likely to be the optically most relevant traits.
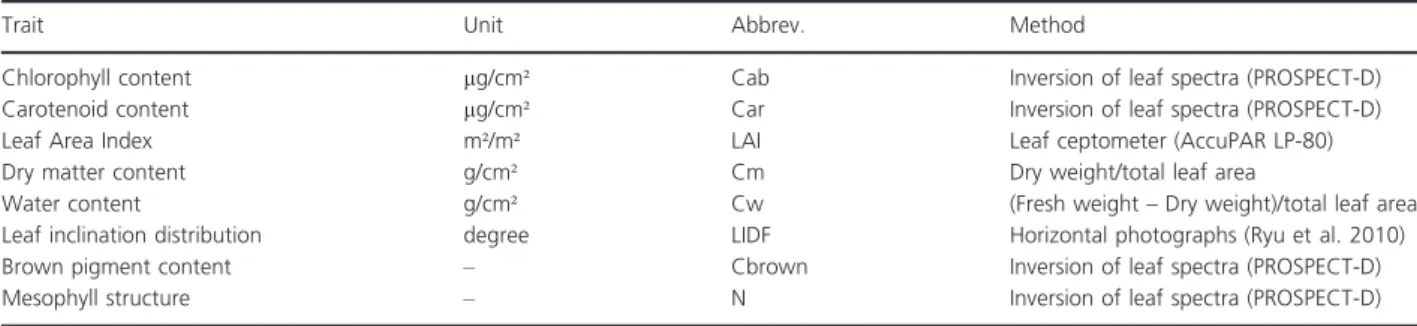
The incorporated plant traits that can be linked to plant functioning include two traits characterizing the canopy architecture. First, the leaf area index (LAI) relat-ing leaf area to the correspondrelat-ing surface area on the ground, which is a proxy for net primary productivity (Bondeau et al. 1999; Asner et al. 2003). Second, the vari-ation of leaf angles, characterized by the leaf inclinvari-ation distribution function (LIDF), controlling inter alia the light harvesting efficiency, leaf temperature and transpira-tion (Niinemets and Valladares 2004; Niinemets 2010). The other traits define foliage properties, such as pig-ments for photosynthesis and photoprotection, i.e. chlorophyll a+b (Cab), carotenoid content (Car) and brown pigment content (Cbrown) which relates to tan-nins and woody debris. Dry matter content per area (Cm) aggregates cellulose, lignin, and other structural car-bohydrates and indicates leaf resource investments and tissue properties. Dry matter content is a frequently used proxy to characterize plant economics and strategies (Grime et al. 1997; Wright et al. 2004). Water content (Cw) per leaf area or equivalent water thickness can indi-cate drought resistance and flammability (Lawlor and Cornic 2002; Zarco-Tejada et al. 2003). The thickness of the spongy mesophyll is characterized by a mesophyll structure coefficient (N).
The knowledge on the optical properties of these traits as formulated within PROSAIL thus allows us to link plant canopy reflectance with plant traits and functioning
in order to address the question: Which traits mechanisti-cally drive the difference in canopy reflectance among PFT (we used types related to growth forms and plant strategies)? That is, what is the relative (statistical) contri-bution of plant traits included in PROSAIL for differenti-ating these PFT using hyperspectral data?
Materials and Methods
The present study assesses how canopy structural and leaf traits affect the differentiation of herbaceous PFT using canopy reflectance. This reflectance was simulated in order to understand in depth how traits contributed to this reflectance. The simulation was accomplished using the radiative transfer model PROSAIL parametrized, using trait data acquired from outdoor cultivated plants.
Selection and cultivation of PFT
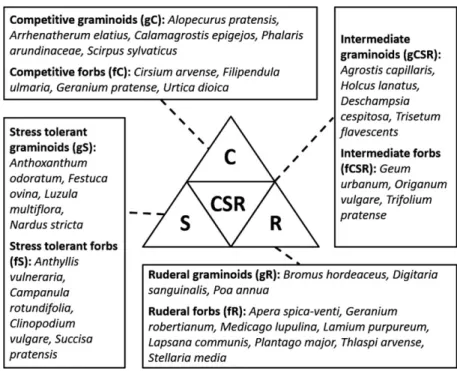
The trait data used to parameterize our models were acquired within an outdoor cultivation in the botanical garden of the Karlsruhe Institute of Technology (KIT). 38 herbaceous species belonging to different PFT were culti-vated. As one scheme for allocating the PFT we used the CSR scheme (Grime 1988), which is one of the most established concepts of plant grouping by function (Hodgson et al. 1999; Pierce et al. 2017). The CSR-model posits the existence of three major dimensions in plant strategies, namely competitiveness (C; characterized by traits that facilitate outcompeting neighbors), stress-toler-ance (S; characterized by traits supporting metabolism in harsh abiotic conditions) and ruderality (R; traits facilitat-ing regeneration of the population in habitats character-ized by frequent destructive disturbance events). The CSR model suggests that plants evolve strategies that optimize allocation between resource capture, resource conserva-tion, space occupancy, longevity and dispersal (Grime et al. 1997). Our selection of species comprised competi-tive, stress tolerant, ruderal and intermediate species of both grasses and herbs that are indigenous to central Eur-ope. Competitive species (C) are typically characterized by higher canopies and large leaves to pre-empt light resources. Stress tolerant (S) species often feature lower canopy heights and fewer but more robust leaves with low pigment concentrations. Ruderals (R) are fast grow-ing species with a short lifespan and thus lower persistent resource investments, i.e. in dry matter (Grime and Pierce 2012). Intermediate species (CSR) have no affinity to the aforementioned strategies and hence feature intermediate trait expressions. In addition to the CSR scheme we clas-sified the species into growth forms, i.e. graminoids (g) and forbs (f). Figure 1 displays the described PFT scheme and the respective species of the experiment.
The discernibility of PFT was hence assessed for three PFT schemes groupings (compare Fig. 1):
(1) growth forms, i.e. forbs and graminoids (f,g)
(2) CSR strategies among graminoids, i.e. competitive, stress tolerant, ruderal and intermediate graminoids (gC, gS, gR, gCSR)
(3) CSR strategies among forbs, i.e. competitive, stress tolerant, ruderal and intermediate forbs (fC, fS, fR, fCSR).
Propagation of the seedlings was performed indoor in March. When the plants reached a sufficient size, they were moved outdoor for a week of acclimatization. After-wards they were planted out in four repetitions in sepa-rate pots with a size of 0.4 m * 0.4 m and 30 l volume filled with a standardized substrate. All pots were fertil-ized, weeded and regularly irrigated.
Acquisition of trait data
To reproduce a representative temporal variability the traits of all species were repeatedly measured on a weekly basis from May to November following a standardized procedure. Whenever leaves had to be sampled, a set of sunlit leaves which best corresponded to the overall state of the plant was selected. The acquisition of leaf samples and leaf spectra was restricted to leaflets and thus did not consider petioles or rachis. The traits and their retrieval are listed in Table 1.
To measuredry matter contentper area andwater con-tentper area approximately 10 g of whole leaves without twig were plucked. To limit the destructive impact, these measurements were performed on a species rather than a pot basis, by extracting leaf material equally from the four repetitions. The extracted leaf samples were immediately weighted on site after extraction and sealed in plastic bags containing a water saturated tissue. Within 24 h, the total leaf area of the extracted samples was derived using a flatbed scanner (Canon LiDE 70). Following the protocol by Perez-Harguindeguy et al. 2013, the samples were oven-dried at 70°C for at least 72 h and subsequently weighted to derive the average leaf dry mass per area [g/cm²]. Water content [g/cm²] was derived by subtracting Leaf dry mass per area from Leaf fresh mass per area.
Chlorophyll content, carotenoid content, mesophyll structure and brown pigment content were derived using an inversion of leaf spectra and the PROSPECT-D model (Feret et al. 2017). Traditional measurement approaches for chlorophyll and carotenoid contents, such as the spectrophotometer method by Lichtenthaler (1987), were not applicable considering the high number of measurements per week (~500) and limited resources. Leaf spectra were acquired using the ASD FieldSpec III (ASD, Inc. Boulder, CO, USA) equipped with a plant
probe and a leaf clip. Five measurements of independent leaves were recorded for each individual pot and thus 20 measurements per species. A special treatment was applied for species with leaves not wide enough for the opening of the plant probe (2 cm diameter). The leaves were seamlessly and without overlapping placed side by side on an adhesive tape, covered with a microscope slide and subsequently scanned. The inversion of PRO-SPECT-D was performed using wavelet transformations and a look-up-table approach (Blackburn 2007; Black-burn and Ferwerda2008; Cheng et al. 2011; Ali et al. 2015; Li et al. 2018). Details on the inversion and its validation are given in Appendix A.
Leaf inclination distributions were derived using leveled digital photographs. For each species not less than 50 Individual leaf angles were measured using leaves ori-ented parallel to the viewing direction using the public domain processing software ImageJ (http://rsbweb.nih. gov/ij/). For more details on the procedure see Ryu et al. (2010). As this procedure is very time- and labor-con-suming the leaf inclination distribution was only mea-sured once (based on photographs of 2–3 different dates).
Leaf Area indexwas measured using an Accu-PAR LP-80 ceptometer and an external reference sensor to account for the current incoming irradiance. In order to ensure that the LAI measurements are performed at ground level the measurements were taken via 2 lateral holes, which were put in each pot. For each pot 18 measurements were recorded and subsequently averaged.
Trait data which correspond to the period of senes-cence were subsequently excluded in the present study. A statistical summary of the sampled trait data is available in Appendix B.
To assess the contribution of each trait to differentiate PFT under possibly varying environmental conditions we aimed at a good coverage of possible combinations of trait expressions. To achieve this, we inflated the number of weekly trait expressions by picking random values around a smoothed time series of measurements. The generated val-ues for the different traits were then combined into 1000 random trait combinations per PFT that entered the simu-lation of spectra. These random trait combinations are likely to represent the full range of possible statuses within the examined PFT across a full growing season. The details of these pre-processing steps are given in Appendix C.
Simulation of species specific reflectance
The resulting combinations of trait expressions were used as input for PROSAIL 5B (Verhoef et al. 2007; Feret et al. 2008) to simulate canopy spectra in the wavelength range of 400–2500 nm. In order to assess the effect of a given trait we compared the spectra calculated based on realistic trait expressions with spectra calculated based on random trait expressions sampled from the total ranges of values covered by all species.
During all PROSAIL simulations the soil brightness parameter (psoil), which determines the moisture content
of the soil, was kept constant at 0.5. The sun angle (tts) was set to 35° and the observer angle (tto) was set to nadir (0°), resulting in a negligible effect of the hotspot size parameter, which was therefore kept constant at 0.01. In order to comply with the quality of spectral acquisi-tions under operational condiacquisi-tions power law noise (1/f
noise) was added (West and Shlesinger 1990) to simulate radiometric uncertainties caused by effects such as band anomalies, calibration errors or residuals of atmospheric and topographic correction algorithms. The randomly generated noise was added with a magnitude (0.2–2% reflectance, details see Appendix D), which corresponds to the standard radiometric uncertainty that is assumed for the hyperspectral satellite EnMAP (Bachmann et al. 2015). This ensures a more realistic view on a spectral separability of PFT as compared to perfectly clear PRO-SAIL spectra, which are likely to be not fully representa-tive for operational data acquisitions. In view of airborne and spaceborne remote sensing data bands located in water absorption regions were removed prior further analysis (1400–1500, 1880–2000, 2450–2500 nm).
Comparing the contribution of plant traits on the discernability of PFT using MRPP
The (statistical) contribution of each considered plant trait for the separation of PFT (according to the three exam-ined PFT schemes) was compared on the basis of the pre-processed in-situ trait data as well as the simulated plant canopy spectra. By this comparison it was possible to assess to what extent the discernibility provided by a plant trait measured in situ is actually preserved in the spectral reflectance of a plant canopy. For both levels, i.e. in situ traits and canopy spectra, the relative contribution of each plant trait was measured using a Multi Response Permuta-tion Procedure (MRPP, Mielke 1991; McCune and Grace 2002). The latter was chosen for its robustness and parsi-mony. The MRPP is a multivariate non-parametric test of whether there is a significant difference between groups. The MRPP provides a change-corrected group agreement (A) and a significance (P). Similar to a coefficient of
determination in a linear model,Aranges from 0 to 1 and maximizes if the discrimination between groups is perfect. Accordingly, a hypotheticalAvalue of 1 would imply that the expression of a trait differs completely among PFT, whereas anAvalue of 0 implies that the trait does not dif-fer between PFT. For the analysis based on in-situ mea-sured traits, the MRPP was directly applied. That is, we tested for each plant trait its differences among the classes of a PFT scheme (e.g. differences in LAI between C, S, R and CSR forbs).
For the analysis of the canopy reflectance level, A was calculated for each band individually using the previ-ously described simulated reflectances derived from PROSAIL. Hence, for each simulated wavelength we conducted two MRPP analyses to test for differences of the reflectances between the PFT groups of a scheme. The first MRPP was conducted based on canopy reflec-tances that were simulated, using the in situ measured traits of each species of the to be classified PFT groups (true variation). In contrast, in the second MRPP we replaced the in situ measurements of one individual trait (e.g. LAI) with random values from the full range of measurements taken across all examined species (ran-domized trait expression). The values of A for a given wavelength derived from the second MRPP applied to the data set with randomized trait expressions were then subtracted from A values obtained from the first MRPP based on the true variation of all traits (ΔA, compare Fig. 2). Resulting positive values for ΔA reveal that the optical discrimination among PFT is enhanced if the variance of that trait (e.g. LAI) was included in the sim-ulation of the canopy spectra. This procedure was repeated for each individual trait and wavelength. This way the band-wise relative contribution of each trait to separate PFT was determined.
As hyperspectral data contain spectrally continuous information across the covered wavelength regions, rele-vant information may be inherited by the reflectance of individual bands as well as by the shape of a spectrum. The MRPP-based analysis of the canopy spectra was hence not only applied on the reflectance values for each
Table 1. Overview of the traits measured in situ and the method used for their retrieval.
Trait Unit Abbrev. Method
Chlorophyll content lg/cm² Cab Inversion of leaf spectra (PROSPECT-D)
Carotenoid content lg/cm² Car Inversion of leaf spectra (PROSPECT-D)
Leaf Area Index m²/m² LAI Leaf ceptometer (AccuPAR LP-80)
Dry matter content g/cm² Cm Dry weight/total leaf area
Water content g/cm² Cw (Fresh weight – Dry weight)/total leaf area
Leaf inclination distribution degree LIDF Horizontal photographs (Ryu et al. 2010)
Brown pigment content – Cbrown Inversion of leaf spectra (PROSPECT-D)
band, but also to the first and second derivative thereof as these depict the shape of a spectrum.
Comparing the contribution of plant traits on the spectral discernability of PFT using machine learning
An aspect which is not fully considered in the band-wise MRPP-based analysis of the simulated canopy spectra are potential synergies among multiple spectral features. Mul-tiple bands in combination can thus potentially carry more information than individual bands. Accordingly, we complemented the MRPP analysis with an additional analysis based on a machine learning algorithm to assess whether the relative contribution of traits for the spectral differentiation of PFT differs if the information content of the whole spectrum is considered. This analysis was performed using the partial least square (PLS) algorithm, which is commonly used in Hyperspectral data analysis. For parameter optimization, the PLS models were trained in a model tuning environment (R-package‘caret0) using the scaled and centered simulated reflectances and a 5-fold cross validation. Analogously to the MRPP-based analysis a PLS model was created for the reflectance data-set with the variation of all traits and one-by-one, with randomized traits. The contribution of each trait to dis-cern the respective PFT scheme was determined by sub-tracting the Kappa value (K) based on the data set with a randomized trait from the Kappa obtained from the
original variation of traits (ΔK, compare Fig. 2). In order to prevent a stochastic bias this procedure was performed for 100 iterations. In each iteration, the input traits (true and randomized variation of traits) were again sampled prior to the simulation of the spectra. The analysis was also carried out using a random forest and a support vec-tor machines algorithm which did not result in notable differences (results not shown).
Results
Relative contribution of in-situ measured traits
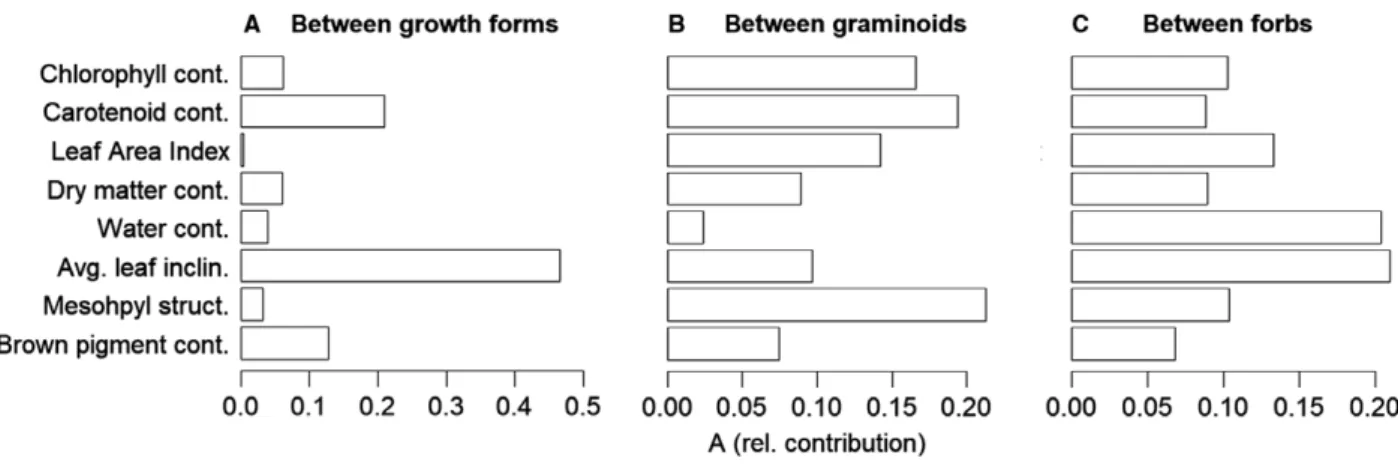
For the separation of growth forms (graminoids vs. forbs) based on in-situ traits, leaf inclination was by far the most important trait, followed by carotenoid and brown pig-ment content (Fig. 3A). Comparably poor differentiation was provided by chlorophyll content, LAI, mesophyll struc-ture, dry matter and water content. Regarding the differen-tiation among graminoid strategies, the traits showed a more diverse contribution, where leaf chlorophyll content, carotenoid content, mesophyll structure coefficient and LAI had a similarly high contribution (Fig. 3B). The by far lowest contribution was given by water content. For the separation of forb strategies the contribution of traits is rel-atively balanced as water content and leaf inclination had the highest contribution, whereas all other traits show a similar modest contribution (Fig. 3C).
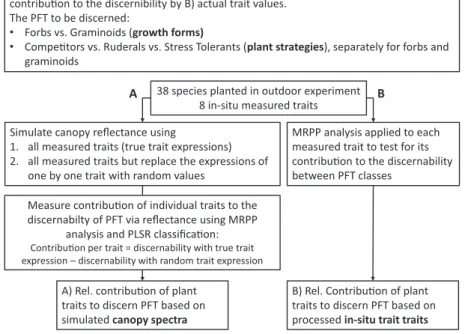
38 species planted in outdoor experiment 8 in-situ measured traits Research objecve
Assess the contribuon of traits to discern PFT via A) canopy reflectance and compare this contribuon to the discernibility by B) actual trait values.
The PFT to be discerned:
• Forbs vs. Graminoids (growth forms)
• Competors vs. Ruderals vs. Stress Tolerants (plant strategies), separately for forbs and graminoids
A B
MRPP analysis applied to each measured trait to test for its contribuon to the discernability between PFT classes
Simulate canopy reflectance using
1. all measured traits (true trait expressions) 2. all measured traits but replace the expressions of
one by one trait with random values
B) Rel. Contribuon of plant traits to discern PFT based on processed in-situ trait traits A) Rel. contribuon of plant
traits to discern PFT based on simulated canopy spectra
Measure contribuon of individual traits to the discernabilty of PFT via reflectance using MRPP
analysis and PLSR classificaon:
Contribuon per trait = discernability with true trait expression – discernability with random trait expression
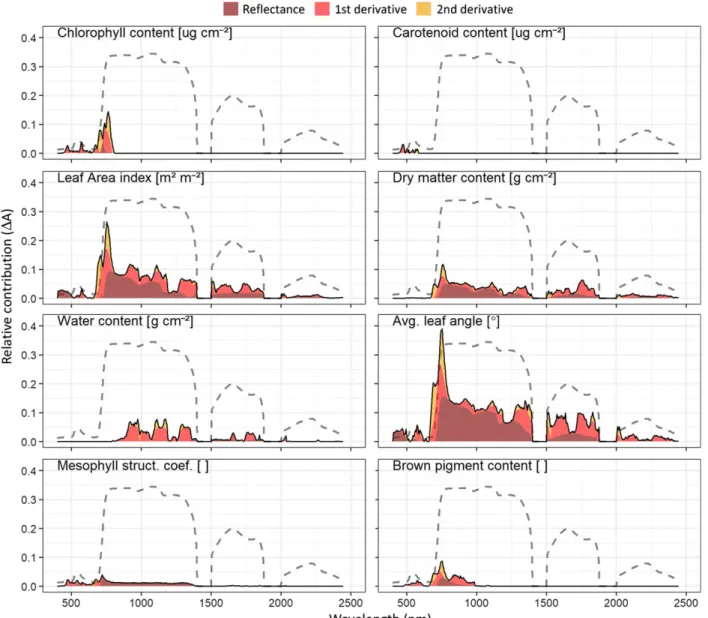
Contribution of traits to the differences between PFT canopy reflectance
Overall, the relative contribution of plant traits to the dif-ferentiation of PFT using canopy reflectance differed notably among the PFT groupings, i.e. the discernibility of growth forms, graminoids strategies and forb strategies. For separating growth forms (Fig. 4), leaf inclination had by far the highest contribution, especially in the red-edge region, followed by LAI and a notably lower contribution of dry matter and chlorophyll content and LAI. Very low contributions for the spectral differentiation between gra-minoids and herbs were found for mesophyll structure, carotenoid, water and brown pigment content. Relative to the other traits, LAI showed a clearly increased contribu-tion compared to the analysis of the in-situ measured trait data (Fig. 3A). Carotenoid content, brown pigment content and mesophyll structure showed higher contribu-tions than LAI when considering in situ traits and con-trarily a lower contribution than LAI for a discrimination when using canopy reflectance.
The spectral discrimination between graminoid strate-gies (Fig. 5) was highest for LAI in the VIS and SWIR followed by dry matter and water content and leaf incli-nation in the SWIR. Moderate to lowΔAwere found for mesophyll structure, brown pigment, chlorophyll content, and carotenoid content.
The spectral separation among forb strategies was dom-inated by water content and LAI in the NIR and SWIR region. Moderate contribution could be observed by dry matter content and leaf inclination chlorophyll content. Brown pigment content, mesophyll structure and carote-noid content did not substantially contribute to separate forb strategies.
The results based on the machine learning algorithm PLS are shown in Figure 7. Overall the observed relative
contribution shows a high correspondence to the results derived from the MRPP-based analysis.
In summary the results of the MRPP (based on indi-vidual bands) and the PLS analysis (based on multiple bands) show that, in contrast to the discrimination by in situ trait data (Fig. 3) carotenoid content, brown pig-ment content and mesophyll thickness did not contribute much to the reflectance-based differentiation of PFT (Figs. 4–7). The variation in chlorophyll content only resulted in moderate contributions. Dry matter content and water content generally showed a moderate to high contribution for the separation of the considered PFT. The variation of either leaf inclination or leaf area index, which both describe aspects of canopy structure, con-tributed a large part for the spectral differentiation of the considered PFT schemes.
Discussion
As expected, different plant functions led to different trait expressions which in turn resulted in different optical properties. Depending on the PFT scheme at hand, i.e. the differentiation of growth forms, forb strategies or gra-minoid strategies, the relative discriminative power of the traits changed considerably. Yet, we could observe some clear trends:
Our results show that the contribution of in situ leaf traits to the differentiation of PFT does not necessarily correspond to their discriminative power if it comes to differentiating herbaceous PFT through canopy reflec-tance, which indicates that not all variation in plant traits can be retrieved using canopy reflectance. Despite the comparatively high contribution of in situ carotenoid content for discriminating plant strategies and growth forms (Fig. 3), the contribution observed at the canopy reflectance level was comparably low (Figs. 4–7).
Figure 3. Relative contributionAof in situ traits to separate/classify three PFT schemes, i.e. (A) growth forms, (B) graminoid CSR-strategies and (C) forbs CSR-strategies.Ais the chance-corrected within group agreement as measured by a multi-response permutation procedure (MRPP).
Mesophyll structure, which showed a comparably high contribution to separate plant strategies on the in-situ level (Fig. 3B and C), showed only a negligible discrimi-native power at the spectral level (Figs. 4–7). The only leaf traits which markedly contributed to the spectral sep-aration of the PFT were water and dry matter content. This is well in line with previous studies, which evidenced that water and dry matter content or its inverse SLA is strongly correlated with plant functioning and strategies (Grime et al. 1997; Weiher et al. 1999; Wright et al. 2004).
Traits describing the canopy structure, i.e. LAI and leaf inclination, showed for both the in-situ traits and the simulated canopy spectra a strong discriminative power.
This is consistent with established knowledge in vegeta-tion ecology regarding linkages between canopy architec-ture and plant functioning (Givnish 1984; Craine et al. 2001; Poorter et al. 2006; Niinemets 2010). For the simu-lated canopy spectra, the contribution of canopy structure was more pronounced, while leaf traits (e.g. pigments) were less important than expected based on earlier studies from the remote sensing community. For instance, Jetz et al. 2016 list six ‘key functional plant traits’ for remote sensing of functional biodiversity, of which all are leaf traits. Similarly, Asner and Martin (2009) state that the optical reflectance of plant canopies is primarily driven by the leaf biochemistry and propose to utilize EO-data and spectrally derived ‘chemical fingerprints’ to map plant
Figure 4. Relative contribution (ΔA) of plant traits to the band-wise separation ofgrowth forms. For guidance a common vegetation spectrum was added to each panel (dashed line).
functioning. The latter study is referring to tropical forest ecosystems and may hence not be directly comparable to our results obtained with herbaceous species. However, it could be assumed that within forest ecosystems, structural traits may play an even more pronounced role as the structural diversity of forests canopies is higher than the one of herbaceous plant canopies. One key-problem of earlier studies conducted in forests may be that accurately measuring structural traits in the field is very challenging and hence earlier studies might have had limited capabili-ties to adequately disentangle structural and biochemical traits in their analysis (Homolova et al. 2013). Our results suggest that for spectrally differentiating PFT the role of traits describing the canopy architecture might be
underestimated in the community. The overall lower con-tribution of leaf traits at the canopy reflectance level can to a large extent be explained by the confounding effects of canopy architecture (LAI, leaf inclination) affecting the same wavelength regions. This is in line with Knyazikhin et al. (2013), who physically deduce that canopy structure largely affects the retrievability of leaf properties. These authors evinced that canopy structure is the dominant determinant of the plant spectral response. A direct mea-surement of absorption through leaf constitutes by means of canopy reflectance is elementarily hampered as a frac-tion of the non-reflected light is scattered as a funcfrac-tion of various canopy structural attributes which hence blur these absorption processes (Curran 1989).
Figure 5. Relative contribution (ΔA) of plant traits to the bandwise separation ofCSR strategies among graminoids. For guidance a common vegetation spectrum was added to each panel (dashed line).
On the other hand, processes taking place at the leaf level, such as photosynthesis or photoprotection are not independent from the leaf arrangement but are tailored concertedly to the overall structure of the canopy (Niine-mets 2010). For instance, investments in pigment contents per leaf area are adjusted to the exposure of foliage, which is inter alia governed by the total amount of foliage (LAI) and its inclination (leaf inclination distribution) directed to the beam path of the solar radiation. Accord-ingly, plant functional gradients of canopy physiology such as fraction of absorbed photosynthetic active radia-tion (fAPAR) or net primary productivity cannot solely be explained by leaf properties but strongly depend on
canopy architecture (Middleton et al. 2009; Huemmrich 2013).
In view of our findings, future studies should include the linkage between plant functioning and structural canopy variables. For example, as LAI is a dimension-less quantity it complies with the spatial constraints of EO-data and can be mapped across a range of spatial scales with relatively high accuracy (Garrigues et al. 2008; Zheng and Moskal 2009). The correlation of LAI with plant strategies has already been indicated (Katten-born et al. 2017) and LAI was observed to closely cor-relate to primary production and thus strongly cor-relates to nutrient supply (Asner et al. 2003). With respect to
Figure 6. Relative contribution (ΔA) of plant traits to the bandwise separation ofCSR strategies among forbs. For guidance a common vegetation spectrum was added to each panel (dashed line).
growth forms such as shrubs and trees the crown shape and foliage clumping, which describes the aggregation of foliage within a canopy, might be important addi-tional structural canopy properties relating to plant functioning (Niinemets 2010; Ollinger 2011). The pre-sent study did not account for canopy structural
attri-butes such crown shape or arrangement, since
PROSAIL assumes a turbid medium and thus homoge-neous vegetation canopies. These conditions match fairly well with herbaceous canopies but do not apply
for complex forests canopies. Yet, the presented
approach can also be transferred to radiative transfer models adapted to forest canopies; e.g. INFORM (Atz-berger 2000) which is a modification of PROSAIL and includes further structural traits such as stem density, crown width or canopy height; or FLIGHT (North 1996) which is a more complex 3D radiative transfer model based on Monte Carlo ray tracing.
The relative contribution of the traits derived from the machine learning procedure (PLS) showed an over-all high correspondence to the results of the MRPP-based procedure. Minor divergences exist as the MRPP analysis is based on single bands, whereas the PLS approach accounts for interactions among bands, which is more likely to compensate for effects as scattering by the canopy structure or noise. The advantage of the MRPP-based analysis is an increased parsimony and the opportunity to identify the contributing spectral features across the reflectance spectrum. As such the MRPP-based analysis of the individual bands for separating PFTs showed that all three spectral regions, i.e. VIS, NIR and SWIR contribute for the differentiation of PFT (Figs. 4–6). Although reflectance in the VIS region is to a large extent shaped by the absorption properties
of leaf pigments (Ustin and Gamon 2010) we found that a high proportion of the class separability in the VIS region can be attributed to the canopy structural traits LAI and LIDF (Figs. 4–6). This emphasizes that the variation at certain wavelengths cannot be explicitly linked to single traits, since the optical reflectance of plant canopies is a product of both biochemical and structural traits. Thus, caution should be used when interpreting trait–reflectance relationship, such as feature or band selection metrics.
Essential information is often confined in narrow spec-tral segments across the simulated wavelength range (Figs. 4–6, 400–2500 nm). The jagged pattern of the bandwise relative contribution (ΔA) varies greatly accord-ing to the PFT scheme at hand and shows several local maxima across the spectrum. These findings indicate that optical EO-sensors should ideally meet two criteria for mapping plant functioning; firstly, cover the VIS, NIR and SWIR regions and secondly, feature a high spectral resolution. Future hyperspectral missions such as Hypsiri (Roberts et al. 2012) and EnMAP (Stuffler et al. 2007) meet these criteria and are therefore expected to be of high value for mapping plant functioning.
The fact that canopy architecture features a high con-tribution to differentiate plant functioning emphasizes the
potential of multi-angular remote sensing, which
enhances the retrieval of canopy structural characteristics (Widlowski et al. 2004). Similarly, the results encourage a combination of optical with LIDAR or RADAR (e.g. Sen-tinel-1) data, as the latter two are suitable to retrieve structural information of plant canopies (Disney et al. 2006; Latifi et al. 2012).
Our results largely depend on the functionality and validity of PROSAIL. The latter is a simplification of
Figure 7. Relative contribution (ΔKappa) of plant traits to spectrally separate the three PFT schemes, i.e. (A) growth forms, (B) graminoid CSR-strategies and (C) forbs CSR-CSR-strategies based on PLS models.
radiative transfers in natural plant canopies and does not account for all optically relevant plant properties, such as flowers, which also have a substantial influence on the on canopy reflectance (Feilhauer et al. 2016a). Some parame-ters used in PROSAIL serve as proxies for traits with similar optical response. For instance, dry matter content repre-sents constituents as starch, sugar, cellulose or lignin, whereas chlorophyll content combines chlorophyll a+b. Yet, as these traits have very similar absorption features, it may be unlikely that a separation of these aggregated traits enhances the optical separation of PFT.
The leaf angle distribution was only assessed once, as the applied procedure using digital photographs and manual delineation of leaf angles was time- and labor-consuming. A recently published methodology presented by M€ uller-Linow et al. (2015) allows for a more efficient estimation of leaf angle distributions using a semi-automatic workflow based on photogammetric 3D reconstruction and close-range RGB images and could be applied in future studies.
The direct transferability of the results to other PFT schemes or ecosystems may be limited. Yet, the presented workflow can be transferred and as such might present a useful blueprint for assessing the relevant optical traits of other PFT schemes. The presented methodology can also be transferred to assess relationships of the electromag-netic spectrum and plant traits which are not strictly related to PFT, but for instance to assess the relevance of traits to map plant species or essential biodiversity vari-ables (Pettorelli et al. 2016).
Conclusion and Outlook
So what makes the difference between the canopy reflec-tance of growth forms and plant strategies? The contribu-tion of a trait to spectrally separate PFT does not necessarily correspond to the role that a trait could play to differentiate PFT in the field. The reason is that canopy reflectance is a complex response to multiple traits and these responses are not easy to disentangle with statistical methods. Instead, radiative transfer models (RTM) pro-vide a possibility to untangle the reflectance of a PFT and trace it back to individual traits. RTM provide a transfer-able scheme to assess the mechanistic interrelationships between optically relevant plant functional traits and their spectral response. Clearly, the relative contributions of the traits vary by PFT scheme. However, canopy structural traits contribute a large part when it comes to spectrally separating the herbaceous PFT addressed in our study. This indicates that the role of canopy structure might have been undervalued when differentiating PFT using canopy reflectance. It can be assumed that in more com-plex canopies additional structural traits, such as crown shape or leaf clumping, further contribute to the
mappability of plant functioning. A better understanding of these interrelationships requires a systematic assess-ment of optically relevant plant functional traits across environmental gradients and taxonomic lines.
Our results indicate that for mapping plant functioning an optical sensor ideally covers the VIS, NIR and SWIR regions having relatively narrow bands (hyperspectral). Refining our knowledge about plant functioning and its optical properties can improve our capabilities to config-ure futconfig-ure EO-systems and harness EO-data.
Acknowledgments
The project was funded by the German Aerospace Centre (DLR) on behalf of the Federal Ministry of Economics and Technology (BMWi), FKZ 50 EE 1347. The project is part of the preparation of the EnMAP satellite mission. We acknowledge support by Deutsche Forschungsgemein-schaft and open access publishing fund of Karlsruhe Insti-tute of Technology.
We would like to thank all employees of the botanical garden of the Karlsruher Institute for Technology (KIT), especially Peter Nick and Christine Beier, for their gener-ous support.
References
Ali, A., R. Darvishzadeh, A. K. Skidmore, I.-V. Duren, U. Heiden, and M. Heurich. (2015). Prospect inversion for indirect estimation of leaf dry matter content and specific
leaf area.Proceedings of the 36th International Symposium on
Remote Sensing and Environment, 11–15 May 2015, Berlin, Germany. ISPRS Archives, Vol XL-7/W3, XL-7/W3(May),
277–284.
https://doi.org/10.5194/isprsarchives-xl-7-w3-277-2015.
Asner, G. P., and R. E. Martin. 2009. Airborne spectranomics: mapping canopy chemical and taxonomic diversity in
tropical forests.Front. Ecol. Environ.7, 269–276.
Asner, G. P., J. M. O. Scurlock, and J. A. Hicke. 2003. Global
synthesis of leaf area index observation.Glob. Ecol. Biogeogr.12,
191–205. https://doi.org/10.1046/j.1466-822X.2003.00026.x.
Atzberger, C. 2000: Development of an invertible forest reflectance model: the INFOR-Model. In: Buchroithner (Ed.): A decade of trans-european remote sensing cooperation. Proceedings of the 20th EARSeL Symposium
Dresden, Germany, 14–16. June 2000: 39-44.
Bachmann, M., A. Makarau, K. Segl, and R. Richter. 2015. Estimating the influence of spectral and radiometric calibration uncertainties on EnMAP data products-examples for ground reflectance retrieval and vegetation indices. Remote Sens.7, 10689–10714. https://doi.org/10.3390/ rs70810689.
Blackburn, G. A. 2007. Wavelet decomposition of hyperspectral data: a novel approach to quantifying
pigment concentrations in vegetation. Int. J. Remote Sens.
28, 2831–2855.
Blackburn, G. A., and J. G. Ferwerda. 2008. Retrieval of chlorophyll concentration from leaf reflectance spectra using
wavelet analysis.Remote Sens. Environ.112, 1614–1632.
Bondeau, A., D. W. Kicklighter, and J. Kaduk. 1999. Comparing global models of terrestrial net primary productivity (NPP): importance of vegetation structure on
seasonal NPP estimates.Glob. Change Biol.5, 35–45.
Cheng, T., B. Rivard, and A. Sanchez-Azofeifa. 2011. Spectroscopic determination of leaf water content using
continuous wavelet analysis.Remote Sens. Environ.115, 659–
670.
Craine, J. M., J. Froehle, D. G. Tilman, D. A. Wedin, F. S. Chapin, I. Craine, et al. 2001. The relationships among root and leaf traits of 76 grassland species and relative abundance
along fertility and disturbance gradients.Oikos93, 274–285.
https://doi.org/10.1034/j.1600-0706.2001.930210.x.
Curran, P. J. 1989. Remote sensing of foliar chemistry.Remote
Sens. Environ.29, 271–278.
Dıaz, S., J. Kattge, J. H. Cornelissen, I. J. Wright, S. Lavorel, S.
Dray, et al. 2016. The global spectrum of plant form and
function.Nature529, 1–17. https://doi.org/10.1038/nature
16489.
Disney, M., P. Lewis, and P. Saich. 2006. 3D modelling of forest canopy structure for remote sensing simulations in
the optical and microwave domains.Remote Sens. Environ.
100, 114–132.
Feilhauer, H., D. Doktor, S. Schmidtlein, and A. K. Skidmore.
2016a. Mapping pollination types with remote sensing.J.
Veg. Sci.27, 999–1011.
Feilhauer, H., B. Somers, and S. van der Linden. 2016b. Optical trait indicators for remote sensing of plant species
composition: predictive power and seasonal variability.Ecol.
Ind.73, 825–833. https://doi.org/10.1016/j.ecolind.2016.11.
003.
Feret, J. B., C. Francßois, G. P. Asner, A. A. Gitelson, R. E.
Martin, L. P. Bidel, et al. 2008. PROSPECT-4 and 5: advances in the leaf optical properties model separating
photosynthetic pigments.Remote Sens. Environ.112, 3030–
3043.
Feret, J.-B., A. A. Gitelson, S. D. Noble, and S. Jacquemoud.
2017. PROSPECT-D: towards modeling leaf optical
properties through a complete lifecycle.Remote Sens.
Environ.193, 204–215. https://doi.org/10.1016/j.rse.2017.03. 004.
Garrigues, S., N. V. Shabanov, K. Swanson, J. T. Morisette, F. Baret, and R. B. Myneni. 2008. Intercomparison and sensitivity analysis of Leaf Area Index retrievals from LAI-2000, AccuPAR, and digital hemispherical photography over
croplands.Agric. For. Meteorol.148, 1193–1209.
Givnish, T. J. (1984). Leaf and canopy adaptations in tropical
forests. Pp. 51–84 in H. Lieth, ed.Physiological ecology of
plants of the wet tropics. Springer, Netherlands.
Grime, J. P. (1988). The CSR model of primary plant
strategies—origins, implications and tests. Pp. 371–393 in L.
D. Gottlieb, S. K. Jain, eds.Plant evolutionary biology.
Springer, Netherlands.
Grime, J. P., and S. Pierce. 2012.The evolutionary strategies
that shape ecosystems. Wiley-Blackwell, Chichester, UK. Grime, J. P., K. Thompson, R. Hunt, J. G. Hodgson, J. H. C.
Cornelissen, I. H. Rorison, et al. 1997. Integrated screening
validates primary axes of specialisation in plants.Oikos79,
259–281.
Hodgson, J. G., P. J. Wilson, R. Hunt, J. P. Grime, and K. Thompson. 1999. Allocating CSR plant functional types: a
soft approach to a hard problem.Oikos85, 282–294.
Homolova, L., Z. Malenovsky, J. G. P. W. Clevers, G. Garc
ıa-Santos, and M. E. Schaepman. 2013. Review of optical-based
remote sensing for plant trait mapping.Ecol. Complex.15,
1–16. https://doi.org/10.1016/j.ecocom.2013.06.003.
Huemmrich, K. F. 2013. Simulations of seasonal and latitudinal variations in leaf inclination angle distribution:
implications for remote sensing.Adv. Remote Sens.2, 93.
Jacquemoud, S., W. Verhoef, F. Baret, C. Bacour, P. J.
Zarco-Tejada, G. P. Asner, et al. 2009. PROSPECT+SAIL models:
a review of use for vegetation characterization.Remote Sens.
Environ.113, S56–S66.
Jetz, W., J. Cavender-Bares, R. Pavlick, D. Schimel, F. W. Davis, G. P. Asner, et al. 2016. Monitoring plant functional
diversity from space.Nat. Plants2, 193. https://doi.org/10.
1038/nplants.2016.24
Kattenborn, T., F. E. Fassnacht, S. Pierce, J. Lopatin, J. P. Grime, and S. Schmidtlein. 2017. Linking plant strategies
and plant traits derived by radiative transfer modelling.J.
Veg. Sci.28, 717–727. https://doi.org/10.1111/jvs.12525.
Knyazikhin, Y., M. A. Schull, P. Stenberg, M. M~ottus, M.
Rautiainen, Y. Yang, et al. 2013. Hyperspectral remote
sensing of foliar nitrogen content.Proc. Natl Acad. Sci.110,
E185–E192. https://doi.org/10.1073/pnas.1210196109
Kokaly, R. F., G. P. Asner, S. V. Ollinger, M. E. Martin, and C. A. Wessman. 2009. Characterizing canopy biochemistry from imaging spectroscopy and its application to ecosystem
studies.Remote Sens. Environ.113, 78–91. https://doi.org/10.
1016/j.rse.2008.10.018.
Latifi, H., F. Fassnacht, and B. Koch. 2012. Forest structure modeling with combined airborne hyperspectral and LiDAR
data.Remote Sens. Environ.121, 10–25.
Lavorel, S., S. McIntyre, J. Landsberg, and T. D. A. Forbes. 1997. Plant functional classifications: from general groups to
specific groups based on response to disturbance.Trends
Ecol. Evol.12, 474–478. https://doi.org/10.1016/S0169-5347 (97)01219-6.
Lawlor, D. W., and G. Cornic. 2002. Photosynthetic carbon assimilation and associated metabolism in relation to water
deficits in higher plants.Plant, Cell Environ.25, 275–294.
Li, D., T. Cheng, M. Jia, K. Zhou, N. Lu, X. Yao, et al. 2018. PROCWT: coupling PROSPECT with continuous wavelet
transform to improve the retrieval of foliar chemistry from
leaf bidirectional reflectance spectra.Remote Sens. Environ.
206, 1–14. https://doi.org/10.1016/j.rse.2017.12.013
Lichtenthaler, H. K. 1987. Chlorophylls and carotenoids:
pigments of photosynthetic membranes.Methods Enzymol.
149, 350–382.
McCune, B., and J. B. Grace. (2002). Analysis of ecological communities. MjM Software Design, Gleneden Beach, Oregon, USA.
Middleton, E. M., Y. Ben Cheng, T. Hilker, T. A. Black, P. Krishnan, N. C. Coops, et al. 2009. Linking foliage spectral responses to canopy-level ecosystem photosynthetic light-use
efficiency at a douglas-fir forest in canada.Can. J. Remote.
Sens.35, 166–188. https://doi.org/10.5589/m09-008. Mielke, P. W. 1991. The application of multivariate
permutation methods based on distance functions in the
earth-sciences.Earth Sci. Rev.31, 55–71. https://doi.org/10.
1016/0012-8252(91)90042-E.
M€uller-Linow, M., F. Pinto-Espinosa, H. Scharr, and U.
Rascher. 2015. The leaf angle distribution of natural plant populations: assessing the canopy with a novel software tool. Plant Methods11, 11.
Niinemets,U. 2010. A review of light interception in plant€
stands from leaf to canopy in different plant functional
types and in species with varying shade tolerance.Ecol. Res.
25, 693–714. https://doi.org/10.1007/s11284-010-0712-4.
Niinemets,U., and F. Valladares. 2004. Photosynthetic€
acclimation to simultaneous and interactingenvironmental stresses along natural light gradients: optimality and
constraints.Plant Biol.6, 254–268.
North, P. R. J. 1996. Three-dimensional forest light interaction
model using a Monte Carlo method.IEEE Trans. Geosci.
Remote Sens.34, 946–956.
Ollinger, S. V. 2011. Sources of variability in canopy
reflectance and the convergent properties of plants.New
Phytol.189, 375–394. https://doi.org/10.1111/j.1469-8137. 2010.03536.x.
Paganini, M., A. K. Leidner, G. Geller, W. Turner, and M. Wegmann. 2016. The role of space agencies in remotely
sensed essential biodiversity variables.Remote Sens. Ecol.
Conserv.2, 132–140.
Perez-Harguindeguy, N., S. Diaz, E. Garnier, S. Lavorel, H. Poorter, P. Jaureguiberry, et al. 2013. New handbook for standardised measurement of plant functional traits
worldwide.Aust. J. Bot.61, 167–234. http://doi.org/http://
dx.doi.org/10.1071/BT12225
Pettorelli, N., M. Wegmann, A. Skidmore, S. Mucher, T. P.€
Dawson, M. Fernandez, et al. 2016. Framing the concept of satellite remote sensing essential biodiversity variables:
challenges and future directions.Remote Sens. Ecol. Conserv.
2, 122–131. https://doi.org/10.1002/rse2.15
Pierce, S., D. Negreiros, B. E. Cerabolini, J. Kattge, S. Dıaz, M.
Kleyer, et al. 2017. A global method for calculating plant CSR ecological strategies applied across biomes world-wide.
Funct. Ecol.31, 444–457. https://doi.org/10.1111/1365-2435. 12722
Poorter, L., L. Bongers, and F. Bongers. 2006. Architecture of 54 moist forest tree species: traits, trade-offs, and functional
groups.Ecology87, 1289–1301.
https://doi.org/10.1890/07-0207.1.
Poulter, B., P. Ciais, E. Hodson, H. Lischke, F. Maignan, S. Plummer, et al. 2011. Plant functional type mapping for
earth system models.Geosci. Model Dev.4, 2081–2121.
https://doi.org/10.5194/gmdd-4-2081-2011.
Roberts, D. A., D. A. Quattrochi, G. C. Hulley, S. J. Hook, and R. O. Green. 2012. Synergies between VSWIR and TIR data for the urban environment: an evaluation of the potential for the Hyperspectral Infrared Imager (HyspIRI)
Decadal Survey mission. Remote Sens. Environ.117, 83–
101.
Ryu, Y., O. Sonnentag, T. Nilson, R. Vargas, H. Kobayashi, R. Wenk, et al. 2010. Agricultural and forest meteorology how to quantify tree leaf area index in an open savanna ecosystem: a multi-instrument and multi-model approach. Agric. For. Meteorol.150, 63–76. https://doi.org/10.1016/j.a grformet.2009.08.007.
Schmidtlein, S., H. Feilhauer, and H. Bruelheide. 2012.
Mapping plant strategy types using remote sensing.J. Veg.
Sci.23, 395–405. https://doi.org/10.1111/j.1654-1103.2011.
01370.x.
Sitch, S., B. Smith, I. C. Prentice, A. Arneth, A. Bondeau, W. Cramer, et al. 2003. Evaluation of ecosystem dynamics, plant geography and terrestrial carbon cycling in the LPJ
dynamic global vegetationmodel.Glob. Change Biol.9, 161–
185.
Smith, B., I. C. Prentice, and M. T. Skyes. 2001.
Representation of vegetation dynamics in the modeling of terrestrial ecosystems: comparing two contrasting
approaches within European Climate space.Glob. Ecol.
Biogeogr.10, 621–637.
Stuffler, T., C. Kaufmann, S. Hofer, K. P. F€orster, G. Schreier,
A. M€uller, et al. 2007. The EnMAP hyperspectral imager—
an advanced optical payload for future applications
in Earth observation programmes.Acta Astronaut.61,
115–120.
Ustin, S. L., and J. A. Gamon. 2010. Remote sensing of plant
functional types.New Phytol.186, 795–816. https://doi.org/
10.1111/j.1469-8137.2010.03284.x.
Verhoef, W., L. Jia, Q. Xiao, and Z. Su. 2007. Unified optical-thermal four-stream radiative transfer theory for
homogeneous vegetation canopies.IEEE Trans. Geosci.
Remote Sens.45, 1808–1822.
Weiher, E., A. van der Werf, K. Thompson, M. Roderick, E. Garnier, and O. Eriksson. 1999. Challenging theophrastus: a
common core list of plant traits for functional ecology.J.
Veg. Sci.10, 609–620. https://doi.org/10.2307/3237076. West, B. J., and M. Shlesinger. 1990. The noise in natural
Widlowski, J. L., B. Pinty, N. Gobron, M. M. Verstraete, D. J. Diner, and A. B. Davis. 2004. Canopy structure parameters derived from multi-angular remote sensing data for
terrestrial carbon studies.Clim. Change.67, 403–415.
Wright, I. J., P. B. Reich, M. Westoby, D. D. Ackerly, Z. Baruch, F. Bongers, et al. 2004. The worldwide leaf
economics spectrum.Nature428, 821. https://doi.org/10.
1038/nature02403
Zarco-Tejada, P. J., C. A. Rueda, and S. L. Ustin. 2003. Water content estimation in vegetation with MODIS reflectance
data and model inversion methods.Remote Sens. Environ.
85, 109–124.
Zheng, G., and L. M. Moskal. 2009. Retrieving leaf area index (LAI) using remote sensing: theories, methods and sensors. Sensors9, 2719–2745.
Supporting Information
Additional supporting information may be found online in the supporting information tab for this article.
Appendix A. Inversion of PROSPECT-D for the retrieval of chlorophyll content, carotenoid content, brown pig-ment content and the mesophyll structure coefficient.
Appendix B. Statistical summary of the sampled plant traits.
Appendix C.Pre-processing of the trait data