On Integrating Visualization Techniques for
Effective Software Exploration
M.-A.D. Storey
K. Wong
F.D. Fracchia
H.A. M¨uller
School of Computing Science
Department of Computer Science
Simon Fraser University
University of Victoria
Burnaby, BC, Canada
Victoria, BC, Canada
Abstract
This paper describes the SHriMP visualization technique for seamlessly exploring software structure and browsing source code, with a focus on effectively assisting hybrid pro-gram comprehension strategies. The technique integrates both pan+zoom and fisheye-view visualization approaches for exploring a nested graph view of software structure. The fisheye-view approach handles multiple focal points, which are necessary when examining several subsystems and their mutual interconnections. Source code is presented by embedding code fragments within the nodes of the nested graph. Finer connections among these fragments are rep-resented by a network that is navigated using a hypertext link-following metaphor. SHriMP combines this hypertext metaphor with animated panning and zooming motions over the nested graph to provide continuous orientation and con-textual cues for the user. The SHriMP tool is currently be-ing evaluated in several user studies. Observations of users performing program understanding tasks with the tool are discussed.
1
Introduction
Understanding a software system is often a difficult pro-cess because of missing, inconsistent, or even too much in-formation. Software visualizations are often provided in an effort to ease understanding [17]. Some visualization tools show animations of algorithms and data structures, often for educational purposes. Others show the run-time behavior of a program to aid debugging, testing, or performance opti-mization tasks. Some tools focus on “pretty printing” list-ings of the source code to increase readability and under-standing. Another class of tools, the subject of this paper, presents views of static structures in the software linked to textual source code views to enhance program understand-ing durunderstand-ing software maintenance.
In many maintenance situations, program code may be
the only source of information. Higher-level, structural in-formation may be recovered from the code using various reverse engineering approaches [4]. Effectively structur-ing this information for future exploration is critical to pro-gram understanding [29]. Unfortunately, it is not always clear how to visually present this higher-level information for subsequent navigation and analysis.
Many researchers have conducted experiments to ob-serve how programmers explore program information. This research has resulted in several cognitive theories to de-scribe the program comprehension process. Some theories propose that programs are understood “top-down”, by re-constructing knowledge about the application domain and mapping that to the low-level source code [2]. Other the-ories suggest that understanding is built “bottom-up”, by reading source code and then mentally chunking the state-ments into higher-level abstractions. These abstractions are grouped until a high-level understanding of the program is attained [22]. More recent studies show that programmers use a hybrid approach and frequently switch between vari-ous comprehension strategies [30].
The diversity of these cognitive models is not surprising, when one considers the varied characteristics of maintain-ers, programs to be understood, and the goals driving the comprehension tasks [26]. Nevertheless, all the cognitive models agree that understanding is achieved by exploring program information, such as code or documentation, and assimilating that information into existing knowledge about the program.
For many programmers, the source code of the soft-ware system is the most trusted form of documentation. Many software visualization tools provide access to the code, but in many cases the program code is not well in-tegrated with higher-level architectural views. According to the integrated model of comprehension [30], program-mers frequently switch between top-down and bottom-up approaches. Therefore, a programmer should be able to rapidly switch between a high-level view of the software and lower-level source code as they strive to understand the
pro-gram. Hence, to effectively aid program comprehension, a tool must support a wide variety of comprehension strate-gies through its visualization and navigation approaches.
For software exploration, graphs are often used for repre-senting and documenting software structures where nodes in the graph correspond to software artifacts such as functions, data types, and subsystems, and directed arcs correspond to function calls, data dependencies, and containment relation-ships. However, as the complexity of software systems in-crease, so too do their presentations as graphs. The use-ful information conveyed by these graphs can be increased through a variety of techniques. Filtering non-essential nodes and arcs can reduce the amount of visual clutter and consequently improve the readability of the graph. Graph abstraction reduces complexity by collapsing subgraphs of related nodes and arcs into single nodes. The layout of a graph (the relative sizes and positions of nodes and arcs) also strongly affects readability.
Additional techniques are needed to help programmers visualize and explore the larger, more complex graphs typ-ical of legacy software systems. Some tools use a multiple window approach, where each window displays a portion of the graph. Other tools use a pan+zoom metaphor for brows-ing the graph at various levels of detail. Some visualiza-tion tools employ a fisheye-view or context+detail approach, where critical information is displayed larger than less rele-vant information. All of these techniques have been applied to the task of visualizing software [24].
For exploring software, the Simple Hierarchical
Multi-Perspective (SHriMP) visualization technique proposes that
an integrated approach which combines both pan+zoom and fisheye-view approaches is preferable for supporting a vari-ety of comprehension strategies. Filtering, abstraction, and layout algorithms are used to better convey important struc-tural information in the graph. Nested graphs display hi-erarchical structures such as containment relationships and graph abstractions. For example, related software artifacts may be collapsed into a single subsystem node, with nesting to show a containment relationship between this node and the original artifacts.
Moreover in SHriMP, the source code is directly acces-sible and tightly integrated within the visual presentation. A programmer can browse the code by magnifying a node of interest until the corresponding code is visible within the node. This approach presents the detailed code simultane-ously within the additional context of the overall, structural diagram. The program code can be further explored by fol-lowing hypertext links in the code or by navigating within the diagram using various pan+zoom techniques.
The rest of this paper is organized as follows. Section 2 briefly reviews techniques for visually presenting complex information spaces and discusses their suitability for vi-sualizing static software structures. Section 3 describes
the extended interface for SHriMP, an integrated visualiza-tion technique applied to exploring software structures and browsing source code. Section 4 highlights important issues addressed by this visualization technique and outlines areas for future research. The final section concludes the paper.
2
Dealing with Large Graphs
This section discusses the suitability of several tech-niques for representing graphs of large, complex software systems.
2.1 Multiple Views
For a large software system, the corresponding graph may contain many thousands of nodes and arcs. Some tools partition the graph into pieces and display each piece in a separate window [24]. These windows may be cascaded or arranged so that the user can selectively choose which part of the graph to examine further. Frequently, an overview or map is provided to show a less detailed, global view of the entire graph. For many applications, this multiple view ap-proach is less than satisfactory since the user has the diffi-cult task of accurately conceptualizing and integrating the implicit relationships among the contents of the individual windows.
2.2 Single View: Pan+Zoom
Several approaches display large graphs using a single, unified view. In a pan+zoom view, the user may pan the view using scroll bars or by dragging the mouse over the view. Also, the user may explore the graph in varying de-tail by zooming in (enlarging) or zooming out (shrinking) the view. Pad++ [1] uses highly optimized graphics to achieve smooth panning and zooming, making out-of-view parts of the graph quickly accessible. A pan+zoom web browser was recently developed within Pad++ [7]. One problem with the pan+zoom technique is that a user can only enlarge one area of interest at a time in a given view. For program under-standing, it is often necessary to look at several disjoint parts of the software in detail at the same time, since the code re-lating to a particular algorithm is often fragmented [23]. 2.3 Single View: Context+Detail
Several approaches have been devised to present detailed information while also providing the user with important contextual cues. The term fisheye view, coined by Furnas [10], is commonly used to describe views that simultane-ously display both context and detail. A fisheye lens has the distorting optical effect that objects closer to the center of
the view appear increasingly larger. Furnas’ original tech-nique applied a degree of interest function to two measures for each object: its a priori relevance to the user and its dis-tance from a focal point. When applied, this function pro-duces a set of priority values. Objects with priorities below a certain threshold are filtered from the view. Furnas applied these ideas to display program source code and to display calendars.
The Treemap [13], Interactive Graph Layout [12] and Layout Independent Fisheye View [15] systems use a static, context+detail display technique. There is no stability in the graph layouts generated by these systems. A reissued lay-out might change dramatically due to a small change in re-quested node sizes. For software visualization, the graph layout is often designed to assist the programmer in build-ing a mental map of the program. Drastically changbuild-ing the whole layout due to a change of focus would disturb the pro-grammer’s mental map.
Dynamic context+detail display techniques allow the user to change the area(s) of interest interactively and in-crementally. For example, SemNet was developed for ex-ploring and modifying large information spaces [8]. Sem-Net uses three-point perspective to create 3-D fisheye views. An advantage of 3-D drawing is that the view can be rotated until arcs of interest do not overlap. However, these graph displays tend to be cluttered and unfortunately impede the understanding of the structure [19].
Sarkar and Brown extended Furnas’ technique to create interactive fisheye views of graphs [21]. Points of greater interest are magnified and points of lesser interest are de-magnified by distorting the space around the focal point. Nodes further away from the focal point appear increasingly smaller. For software visualization, however, this use of dis-tance to derive interest or impordis-tance may not be entirely suitable. A related, more sophisticated approach (3DPS) is described in [3].
The Continuous Zoom algorithm by Dill et al. [6], is suit-able for interactively displaying hierarchically-organized, two-dimensional networks. This approach allows users to view and navigate nested graphs by expanding and shrink-ing nodes. The underlying algorithm uniformly resizes nodes to provide space for focal points and uses a budgeting process to distribute space among the nodes in the network. However, this algorithm adversely distorts certain layouts useful for visualizing software structures, such as spring [9] and tree [18] layouts. The SHriMP fisheye algorithm, first presented in [25], can adjust an existing layout while pre-serving various constraints.
The next section describes the SHriMP technique, which integrates pan+zoom and context+detail approaches for browsing nested graphs.
3
SHriMP
This section presents some background on the implemen-tation of the SHriMP visualization technique and describes its user interface features for navigating and browsing soft-ware.
3.1 Nested graphs
The SHriMP visualization technique employs a nested-graph formalism [11] to present the structure of a soft-ware system. A nested graph has composite nodes that contain other nodes, thus forming a hierarchical structure. These composite nodes typically represent software subsys-tems (perhaps discovered during reverse engineering). In a nested graph, a composite arc represents one or more arcs between lower-level nodes in the hierarchy. Composite arcs can be selected and opened to display the lower-level, con-stituent arcs they represent.
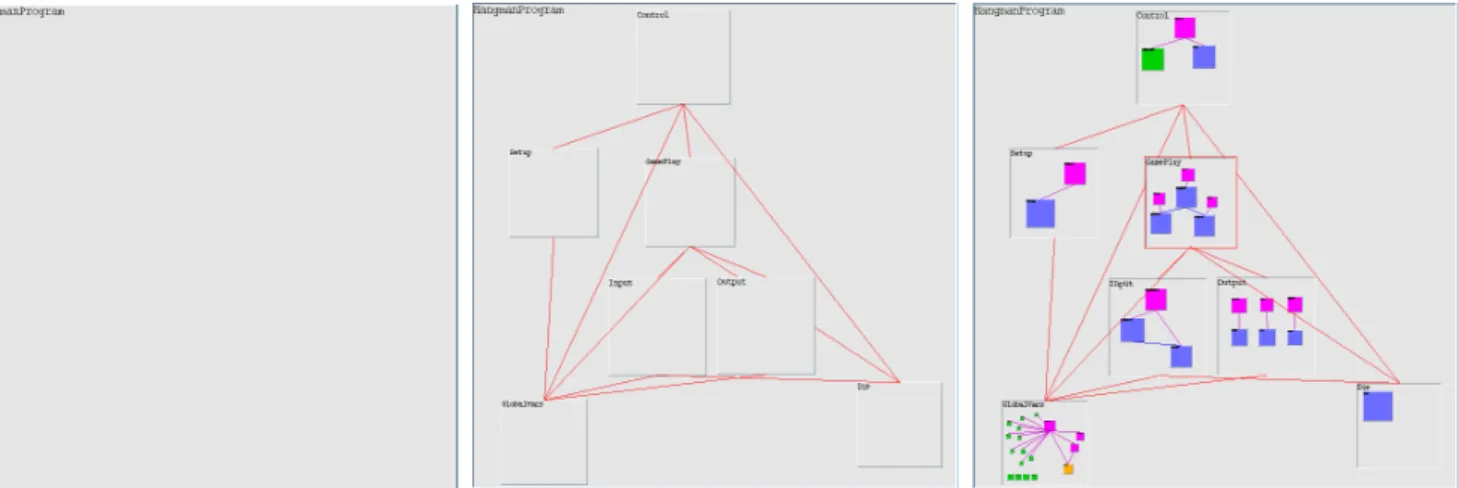
Figure 1 shows a series of views at various levels of de-tail in a C program that implements aHangmangame. In Fig. 1(a), a single node is displayed. This node is an ab-stract representation of the entireHangmanprogram. In Fig. 1(b), this node is opened to reveal the next level in the software hierarchy. Further detail is exposed by opening ad-ditional nodes in Fig. 1(c).
Composite nodes are drawn in grey and have a sunken or raised effect to indicate if they are open or closed, re-spectively. Leaf nodes are colored according to the type of software artifact represented (e.g., functions (blue), data types (orange), variables (green) and files (pink)). A node may be manually positioned in the canvas, constrained by the boundaries of its parent node. Automatic layout algo-rithms can alternatively be applied to each of the subgraphs, including: grid (nodes are positioned in a rectangular ma-trix), spring [9], tree [18], and Sugiyama [28] (see Fig. 2). 3.2 Magnifying nodes of interest
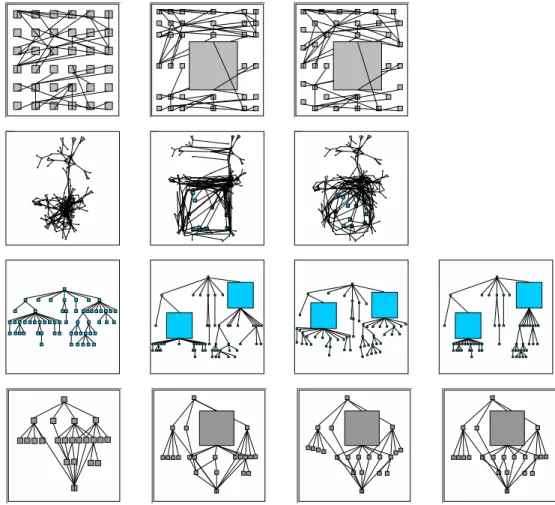
SHriMP integrates context+detail and pan+zoom ap-proaches for magnifying nodes of interest. The con-text+detail approach uses the SHriMP fisheye-view algo-rithm [25], which preserves constraints such as orthogonal-ity and proximorthogonal-ity among nodes as they are individually re-sized. The SHriMP fisheye view algorithm is unique in that it supports various layout adjustment strategies for nested graphs so that a distorted graph will preserve specific con-straints and thus the user’s mental map of the original layout [14]. The first column in Fig. 2 shows several undistorted graph layouts. The second column shows the effects of en-larging nodes using a strategy of this fisheye-view algorithm which preserves orthogonal relationships among nodes in the graph. This method is well suited to the grid layout, but
(a) (b) (c)
Figure 1. (a) This figure shows a single node representing theHangmanprogram. (b) The user hasopenedthe root node of the program to display the next level in the program hierarchy. (c) Further detail is exposed by opening additional nodes.
badly distorts the other layouts. The third column shows a different strategy which preserves clusters in the graph lay-out. This strategy is more suited to the spring layout which groups related nodes. The final column shows some hybrid strategies which are suitable for tree layouts.
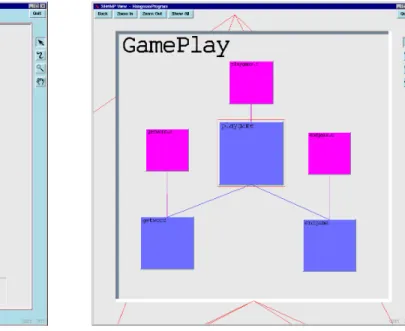
In Fig. 3(a) theGamePlaysubsystem in theHangman
program is magnified to show more detail while the rest of the graph is shrunk to allocate more space to theGamePlay
node. Several nodes of interest can be selected and magni-fied by shrinking the remainder of the graph to allocate more space to these nodes.
The pan+zoom approach allows the user to pan and zoom around a single view. To show more detail for a node of interest, the user selects the node and zooms in until the required level of detail is visible. Figure 3(b) shows the
GamePlaysubsystem after zooming in until the node fills the available screen area.
The SHriMP fisheye-view approach has the advantage of showing both context and detail, but depending on the given task and required information, contextual cues may not always be needed. The pan+zoom approach, however, only supports one focal point. A programmer often needs to browse several interacting subsystems concurrently in a sin-gle view. Here, the SHriMP fisheye-view approach would be more suitable for magnifying several focal points.
A user browsing a software hierarchy might combine these two approaches to magnify nodes of interest. For example, in Fig. 3(b) the GamePlay subsystem node is magnified by zooming in (without context) but three of its children nodes are sized larger than their siblings using the SHriMP fisheye algorithm.
3.3 Browsing source code
With SHriMP, the user can easily access the source code for a program. Each leaf node directly corresponds to a chunk of code in the program. A user can browse this code using any of three methods. In the first method, a sepa-rate text editor window may be opened to display the corre-sponding source file and code for a selected node. The other two methods represent the code as hypertext [5] with func-tion calls, data type references, and variable references rep-resented as hyperlinks. The second method uses the user’s preferred web browser, such as Netscape Navigator, for ex-ploring the hypertext code. The third method embeds the hypertext code inside the nodes so that the source code can then be browsed within the context of the software structure view.
In addition to embedding the code inside nodes, SHriMP integrates the hypertext link-following metaphor (at the code level) with animated panning and zooming motions over the nested graph (at the structural level). Consequently, following a link to another function pans and zooms the view so that this function’s code is presented within its node. By seamlessly combining code and structural brows-ing, the SHriMP interface supports and encourages switch-ing among various comprehension strategies. The hyper-links also provide complementary pathways for navigation beyond following the nested graph structure.
Color Plate 2 displays theplaygamefunction as a focal point with its code visible. Theplaygamefunction calls
endgame(see the last line in the body ofplaygame). If the user clicks on theendgamehyperlink, the tool animates the view so that both nodes are visible in Color Plate 3. This
Original Layout Preserving Orthogonalities Preserving Proximities Hybrid Strategies Grid elementcreate elementnext listnext elementinfo listcreate elementsetnext element mylistprint elementsetnext elementcreate mylistprint elementinfo elementnext elementinfo elementnext element elementcreate element listcreate elementsetnext listinsert elementnext
elementinfo elementsetnextmylistprint element
listinit main listid listfirst list
listfirst listinit listid list main
listcreate main elementsetnext elementnext listid listinit listfirst element elementinfo element elementcreate elementinfo elementsetnext elementnext listcreate element listnext elementcreate elementinfo elementsetnext listinsert listfirst listid mylistprint main elementnext listinit elementnext mylistprint elementsetnext elementinfo elementcreate element mylistprint list
list elementnext elementsetnext main listcreate listid listinit listfirst element elementinfo element elementcreate elementinfo elementsetnext elementnext listcreate element listnext elementcreate elementinfo elementsetnext listinsert listfirst listid mylistprint main elementnext listinit elementnext mylistprint elementsetnext elementinfo elementcreate element mylistprint list list Spring
BaseSystem BaseSystem BaseSystem
Tree
collapse collapse collapse collapse
Sugiyama mylistprint listid listinit elementsetnext elementsetnext elementinfo element listfirst elementnext elementsetnext main listnext elementcreate listcreate listinsert new new new new new new src list listid listinit elementsetnext elementsetnext elementinfo element listfirst elementnext elementsetnext main listnext elementcreate listcreate listinsert new new new new new new mylistprint src list listid listinit elementsetnext elementsetnext elementinfo element listfirst elementnext elementsetnext main listnext elementcreate listcreate listinsert
new new new new newnew mylistprint src list listid listinit elementsetnext elementsetnext elementinfo element listfirst elementnext elementsetnext main listnext elementcreate listcreate listinsert new new new new newnew mylistprint src list
Figure 2. This figure demonstrates how the SHriMP fisheye view algorithm has different strategies to adjust graph layouts while preserving the user’s mental map.
intermediate step is important to avoid disorienting the user as the view is panned and zoomed from one node to an-other. SHriMP then animates the view so that the code for
endgameis fully visible, as in Color Plate 4. To see the code more clearly, the user can fully zoom theendgame
node as shown in Color Plate 5. Displaying the code inside the nodes and animating the view as the focus is changed should reduce lost in space effects often encountered by pro-grammers when browsing the code of complex software sys-tems.
3.4 Implementation
The first prototype of the SHriMP interface [27] was im-plemented in Tcl/Tk [16]. Tcl/Tk is a scripting language and user interface library useful for rapidly prototyping graphi-cal interfaces. However, its graphics capabilities are not
op-timized for efficiently displaying the large graphs typical of software systems.
The second prototype has been
im-plemented using Pad++ [1], a graphics extension for Tcl/Tk. Pad++ is a substrate for building multiscale, dynamic user interfaces. Also, Pad++ is highly optimized for efficiently displaying large numbers of objects and smoothly animat-ing the motions of pannanimat-ing and zoomanimat-ing. For SHriMP, the nested graph views and fisheye-view algorithm are imple-mented in Tcl/Tk using the Pad++ widgets. Pad++ also sup-ports HTML items in its canvas. This feature was used to display source code inside the nodes. The Pad++ panning and zooming features are used extensively in SHriMP.
Several user studies have been conducted to evaluate the strengths and weaknesses of the SHriMP interface. Some pertinent observations from these studies are dis-cussed next.
(a) (b)
Figure 3. (a) The GamePlaysubsystem in the Hangman program hierarchy has been magnified using the SHriMP fisheye view algorithm. (See color plate 1.) (b)GamePlayhas been magnified further, removing most of the context from the view.
4
Discussion
The SHriMP technique was developed as an alternative visualization method for Rigi, a tool for reverse engineering developed at the University of Victoria [27]. Rigi displays software hierarchies as graphs using a multiple window ap-proach. We are currently conducting some user experiments to compare the SHriMP interface with the multiple-window interface provided by Rigi.
In a recent experiment, 30 subjects (graduate and un-dergraduate students in computer science at the Univer-sity of Victoria) were observed while solving some real-istic software maintenance tasks. The studied tools were Rigi, SHriMP, and SNiFF+ (an integrated development en-vironment from TakeFive Software). This experiment is de-scribed in more detail in [26].
Each of the 30 subjects (of a particular level of computing experience) was randomly assigned to only one interface, al-lowing time for adequate training and practice tasks before the formal tasks. Test programs of increasing complexity were used for the three sets of tasks, culminating with a 1700 lineMonopolygame program for the formal tasks. A typi-cal formal task asked the subject to determine the appropri-ate changes needed to implement a new Monopoly rule.
To prepare the experiment, a parser was used to extract low-level software artifacts and relationships from the test programs. Using the Rigi graph editor, one of the authors looked for meaningful abstractions and composed a layered,
subsystem hierarchy. To effectively assist program under-standing, it was critical that an easily understood set of sub-systems be built, that the hierarchy be organized to support navigation, and that meaningful, easy-to-recognize subsys-tem names be defined. For example, in Monopoly, three subsystem nodes were calledPlay,MortgageandBuying & Selling. The creation of meaningful subsystems greatly depends on the use of application and programming domain knowledge. In the experiment, the same hierarchies were used for both Rigi and SHriMP. The presentations offered by these tools helped convey a mental map of the program design. Hypertext files of code fragments were also gener-ated.
In this experiment, we hypothesized that a given inter-face would affect the comprehension strategy undertaken by a subject to complete an assigned task. For SNiFF+, we expected that its predominantly textual interface would encourage a bottom-up comprehension strategy, where the code is read in some detail before drawing any conclusions about the global program structure. For Rigi, we expected that it would promote a top-down strategy, where the global subsystem structure would be understood before browsing the code in detail. Finally, we expected that the SHriMP in-terface would support frequent switching between top-down and bottom-up approaches due to the seamless integration of source code and high-level graphical views. Our observa-tions do seem to support this hypothesis, but a detailed anal-ysis of the videotaped sessions is needed.
In the experiment, we also wanted to compare the fisheye-view (context+detail) and pan+zoom techniques used in SHriMP. The fisheye-view technique was not used as much as pan+zoom, probably because of implementa-tion problems in the interface. At the time of this exper-iment, the SHriMP interface did not support applying the fisheye-view algorithm to multiple focal points. Some sub-jects mentioned (in a post study interview) that they would have liked to use this feature to magnify multiple subsystem nodes to examine their interactions. Several subjects did use the fisheye-view technique on a single subsystem node to further explore the interactions between it and the rest of the software.
We provided one-way access from a SHriMP view to Netscape Navigator for browsing hypertext source code, but Navigator was seldom used even though it was a more fa-miliar and robust tool than the SHriMP code browser. This may have been due to the lack of a tight, two-way integration between Navigator and SHriMP. Many subjects mentioned that they liked the contextual feedback from seeing the code embedded within the nodes as it helped them relate the code to the graphical view of the subsystem hierarchy. This feed-back helped them build a mental map of the structure of the program as they browsed the code.
Also of interest was that previously opened subsystems no longer in focus acted as thumbnail images to provide re-trieval cues (as a kind of history and/or path-marking fea-ture). Several subjects relied on these visual cues to help re-trieve previously explored subsystems.
The biggest problem observed with SHriMP was in man-aging complexity in the view, especially when composite arcs were opened. Figure 4 shows the visual complexity that arose after opening several composite arcs. Some sub-jects commented that arcs should be hidden by default and be shown only upon request. Others suggested that filtering mechanisms would have been helpful, so that irrelevant arcs could be hidden. The SHriMP implementation is currently being enhanced to allow the user to display or hide arcs for a set of selected nodes. This poses an interesting problem in general, with many user interface issues to be considered. Some algorithms have been devised for automatically com-puting layouts of nested graphs with composite arcs [20], but few tools have addressed the issue of interactively browsing these graphs.
Of key importance for program comprehension is the ability to search for keywords in the code and documen-tation. Observational studies of programmers have clearly shown that making hypotheses and searching for cues to ver-ify or reject these hypotheses are the main activities in pro-gram comprehension [23]. Integrating an effective search engine into SHriMP will also raise some interesting design issues.
In general, the SHriMP interface was used quite
effec-Figure 4. Information overload impeded the use of SHriMP due to a lack of filtering mechanisms.
tively, although further analysis of the experimental data is needed.
5
Conclusion
This paper described an integrated approach for pre-senting software structure and code that combines both pan+zoom and fisheye-view visualization metaphors in a single view. The SHriMP approach displays software archi-tectural diagrams using nested graphs, conveying contain-ment relationships and graph abstractions. High-level views of the software structure provide a guide through which the user can directly manipulate the view to access pertinent de-tails. The SHriMP interface embeds source code directly in-side the nodes and integrates the hypertext link-following metaphor (at the code level) with animated panning and zooming motions over the nested graph (at the structural level). By seamlessly combining code and structural brows-ing, the SHriMP interface supports and encourages switch-ing between bottom-up and top-down program comprehen-sion strategies.
The SHriMP tool is currently being evaluated in several user studies. Early observations from these studies were dis-cussed in this paper. As the interface of SHriMP evolves, future experiments will evaluate its effectiveness. Through this iterative cycle of design, implementation and testing, we are working towards a more effective tool for software ex-ploration.
Acknowledgements
We wish to thank Jim McDaniel for writing a tool to gen-erate HTML’ized code fragments from C source code. We are also grateful to Ben Bederson for suggesting how to use Pad++ within SHriMP more efficiently.
References
[1] B. Bederson and J. Hollan. Pad++: A zooming graphical in-terface for exploring alternate inin-terface physics. In Proceed-ings of ACM UIST’94, (Marina del Rey, California), pages 17–26, November, 1994.
[2] R. Brooks. Towards a theory of the comprehension of
com-puter programs. International Journal of Man-Machine
Studies, 18:543–554, 1983.
[3] M. S. T. Carpendale, D. J. Cowperthwaite, and F. D. Frac-chia. 3-dimensional pliable surfaces: For effective presenta-tion of visual informapresenta-tion. In Proceedings of ACM UIST’95, pages 217–227, 1995.
[4] E. Chikofsky and J. C. II. Reverse engineering and design re-covery: A taxonomy. IEEE Software, pages 13–17, January 1990.
[5] J. Conklin. Hypertext: An introduction and survey. IEEE Computer, 20(9):17–41, September 1987.
[6] J. Dill, L. Bartram, A. Ho, and F. Henigman. A continuously variable zoom for navigating large hierarchical networks. In Proceedings of the 1994 IEEE Conference on Systems, Man and Cybernetics, pages 386–390, October 1994.
[7] B. B. et al. A zooming web browser. In Human Factors in Web Development. To appear. 1997.
[8] K. Fairchild, S. Poltrock, and G. Furnas. SemNet: Three-dimensional graphic representations of large knowledge bases. In R. Guindon, editor, Cognitive Science and its Appli-cations for Human-Computer Interaction, pages 201–233. Lawrence Erlbaum Associates, Publishers, 1988.
[9] T. Fruchtermann and E. Reingold. Graph drawing by
force-directed placement. Technical Report UIUC
CDS-R-90-1609, Department of Computer Science, University of Illi-nois at Urbana-Champaign, 1990.
[10] G. Furnas. Generalized fisheye views. In Proceedings of ACM CHI’86, (Boston, MA), pages 16–23, April 1986. [11] D. Harel. On visual formalisms. Communications of the
ACM, 31(5):514–530, May 1988.
[12] T. Henry and S. Hudson. Interactive graph layout. In Pro-ceedings of UIST ’91, Hilton Head, South Carolina, pages 55–64, November 1991.
[13] B. Johnson and B. Shneiderman. Tree-maps: A
space-filling approach to the visualization of hierarchical informa-tion structures. In Proceedings of Visualizainforma-tion ’91, (San Diego, California), pages 284–291, October 1991.
[14] K. Misue, P. Eades, W. Lai, and K. Sugiyama. Layout ad-justment and the mental map. Journal of Visual Languages and Comput., 6(2):183–210, 1995.
[15] E. Noik. Layout-independent fisheye views of nested graphs. In VL’93: IEEE Symposium on Visual Languages, (Bergen, Norway, pages 336–341, August 1993.
[16] J. K. Ousterhout. Tcl and the Tk Toolkit. Addison-Wesley, 1994.
[17] B. A. Price, R. M. Baecker, and I. S. Small. A principled taxonomy of software visualization. Journal of Visual Lan-guages and Computing, June 1993.
[18] E. Reingold and J. Tilford. Tidier drawing of trees. IEEE Transactions on Software Engineering, SE-7(2):223–228, March 1981.
[19] G. Robertson, J. Mackinlay, and S. Card. Cone trees: Ani-mated 3d visualizations of hierarchical information. In Pro-ceedings of ACM CHI’91, (New Orleans,Louisiana), pages 189–194, April 1991.
[20] G. Sander. Graph layout for applications in compiler con-struction. Technical Report A/01/96, Universit¨at des Saar-landes, February 27, 1996.
[21] M. Sarkar and M. Brown. Graphical fisheye views. Commu-nications of the ACM, 37(12):73–84, December, 1994. [22] B. Shneiderman. Software Psychology: Human Factors in
Computer and Information Systems. Winthrop Publishers, Inc., 1980.
[23] E. Soloway, J. Pinto, S. Letovsky, D. Littman, and R. Lam-pert. Designing documentation to compensate for delocal-ized plans. Communications of the ACM, 31(11):1259–1267, 1988.
[24] M.-A. Storey, F. Fracchia, and H. M¨uller. Cognitive design elements to support the construction of a mental model dur-ing software visualization. In Proceeddur-ings of the 5th Inter-national Workshop on Program Comprehension (IWPC’97), Dearborn, Michigan, pages 17–28, May 1997.
[25] M.-A. Storey and H. M¨uller. Graph layout adjustment
strate-gies. In Proceedings of Graph Drawing 1995, (Passau,
Germany, pages 487–499. Springer Verlag, September 1995. Lecture Notes in Computer Science.
[26] M.-A. Storey, K. Wong, and H. M¨uller. How do program un-derstanding tools affect how programmers understand
pro-grams. To appear in the Proceedings of the 4th
Work-ing Conference on Reverse EngineerWork-ing (WCRE97), Amster-dam, Holland, 1997.
[27] M.-A. D. Storey, H. M¨uller, and K. Wong. Manipulating and documenting software structures. In P. Eades and K. Zhang, editors, Software Visualization, pages 244–263. World Sci-entific Publishing Co., 1996.
[28] K. Sugiyama, S. Tagawa, and M. Toda. Methods for visual understanding of hierarchical systems. IEEE Transactions on Systems, Man, and Cybernetics, 11(4):109–125, 1981. [29] S. Tilley, S. Paul, and D. Smith. Towards a framework for
program understanding. In Proceedings of the 4th
Inter-national Workshop on Program Comprehension (IWPC’96), Berlin, Germany, pages 19–28, March 1996.
[30] A. von Mayrhauser and A. Vans. Program comprehension
during software maintenance and evolution. IEEE