Physics Procedia 33 ( 2012 ) 743 – 750
1875-3892 © 2012 Published by Elsevier B.V. Selection and/or peer review under responsibility of ICMPBE International Committee. doi: 10.1016/j.phpro.2012.05.130
2012 International Conference on Medical Physics and Biomedical Engineering
Study on the Methods of Detecting Cucumber Downy Mildew
Using Hyperspectral Imaging Technology
Youwen Tian ,Lin Zhang
College of Electric and Information Engineering Shenyang Agricultural University
Shenyang, China
[email protected],[email protected]
Abstract
Hyperspectral imaging technology, which can integrate the advantages of spectral detection and image detection, meets the need of detecting the cucumber diseases fast and nondestructively. In this paper, hyperspectral imaging technology is adopted to detect the cucumber downy mildew fast and nondestructively. Firstly, hyperspectral images of cucumber leaves infected downy mildew are acquired by the hyperspectral image acquisition system. And optimum wavelengths are collected by the principal component analysis to get the featured images. Then the image fusion technology is adopted to combine collected images with the featured images to form new images by pixel-level image fusion. Finally, the methods of the image enhancement, binarization, corrosion and dilatation treatments are carried out, so the cucumber downy mildew is detected. The result shows that the accuracy rate of the algorithm for detecting cucumber disease can reach nearly 90%. Studies have shown that hyperspectral imaging technology can be used to detect cucumber downy mildew.
© 2011 Published by Elsevier Ltd. Selection and/or peer-review under responsibility of [name organizer]
Index Terms—hyperspectral imaging technology, principal component analysis, image fusion, cucumber downy mildew, disease detection
Introduction
Cucumber is the largest greenhouse vegetable crops in China, and plays an important role in our daily meals. However, the cucumbers often suffer from the invasion of pests and diseases that affect the output and quality of cucumber in the reproductive process. Traditional methods for diagnosing cucumber diseases are slow, high cost, and bad real-time, that will delay the optimal opportunity for prevention and treatment.
In recent years, with the development of the computer image processing technology, some scholars have begun to study on the crops disease identification based on the visible images at home and abroad. A.
© 2012 Published by Elsevier B.V. Selection and/or peer review under responsibility of ICMPBE International Committee.
Open access under CC BY-NC-ND license.
Camargo (2009) [1] described an image-processing method that identified the visual symptoms of plant diseases from an analysis of coloured images. Tian Youwen (2006) [2] introduced the cucumber diseases recognition method in sunlight greenhouse using Support Vector Machine and chromaticity. Some other scholars have begun to study on the crops disease identification based on multi-spectral images. Cedric Bravo (2003) [3] investigated the difference in spectral reflectance between healthy and infected with yellow rust wheat plants. H.R.Xu (2007) [4] studied the reflectance spectra of tomato leaves to determine the most effective wavelengths for characterizing the plant diseases caused by pests. Due to both the visible images and spectral images for detecting the crops diseases have some limitations, the precision and stability of the test results are affected inevitably.
At present, one new technology called hyperspectral imaging technology [5] can integrate the advantages of spectral detection and image detection. Hyperspectral imaging technology has the merits of computer images technology and spectra technology, so visual analysis can be done for the internal and external features of the objects. Although the external characteristics of spotted and normal regions on the cucumber leaves show a great similarity when the state of the disease is slight, the internal organization of the spotted regions have some changes, which can be shown through a specific wavelength of the spectrum. In this wavelength, the gray scale between the spotted and normal regions not only has some differences, but also immunes to lights. Therefore, hyperspectral imaging technology meets needs of detecting the cucumber diseases fast and nondestructively.
Hyperspectral imaging technology has been widely applied in the quality nondestructive detection of the agricultural and livestock products, such as Park [6], Mahesh [7] and Chen Quansheng [8] et.al use hyperspectral imaging technology for testing the contaminant classification of poultry, differentiating wheat classes, and estimation of tea quality level respectively. But the use of hyperspectral imaging technology for detection of cucumber diseases has not been reported. In this paper, hyperspectral images of the cucumber leaves infected downy mildew are acquired by the hyperspectral image acquisition system, and then optimum wavelengths are collected by the principal component analysis to get the featured images. Finally, the featured images are made fusion, filtered, done the opening and so on, to detect the cucumber downy mildew.
The Basic Principles of Hyperspectral Images
Hyperspectral images are three-dimensional data block that is composed by optical images in a series of wavelengths in a specific wavelength range. Fig.1 is a three-dimensional data block of a hyperspectral image. The x and y stand for two-dimensional plane pixel information coordinate axes, stands for the wavelength information coordinate axis. Hyperspectral images have both the image informationa in a specific wavelength and spectral information of different wavelengths in a particular pixel. Spectral information [9] can reflect the internal characteristics of the effective constituent for cucumber infected leaves sufficiently, image information can reflect the external quality characteristics of cucumber infected leaves adequately. Therefore, hyperspectral imaging technology can detect internal and external comprehensive quality on cucumber infected leaves.
Materials and Methods
A. Experimental Materials
The research object of the experiment is cucumber downy mildew in greenhouse. Some infected leaves were collected in cucumber greenhouse in Shenyang Agricultural University. We collected 10 pieces of infected leaves and 10 pieces of normal ones.
Cucumber downy mildew can occur at all growing stages, and the mature cucumbers often suffer from downy mildew heavier. In the early stage, leaves will have water-soaked light green spots. Soon the leaves will have polygonal water-soaked spots after extending. In the later period, the water-soaked spots become brown gradually, at the back of the spotted leaves will appear the layer of gray-black mold in high humidity. When the disease is serious, the spots are contiguous with each other on leaves.
B. Hyperspectral Imaging System
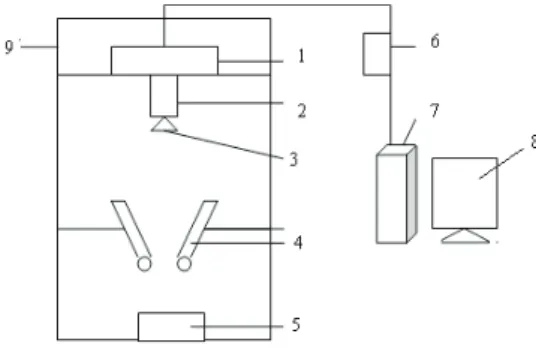
Hyperspectral image data is collected by the hyperspectral imaging system based on the spectrometer shown in Fig 2. It is made of a high-spectral camera (ImSpector, V10E, Finland) based on spectrometer, a fiber halogen light of 150w (DC-950A, Dolan-JennerCo., USA), a set of high-precision delivery device (Beijing Zhuoli Hanguang Instrument Co., Ltd.), a high-performance computers and so on. The fiber halogen light provides two symmetrical light sources through a Y-shaped fiber. Spectral acquisition range of hyperspectral cameras is 400 ~ 1100nm. The spectral resolution is 2.8 nm. The average interval of spectral sampling is 0.69 nm, so that the range of 400 ~ 1100 nm have 1024 bands. The number of a pixel is 1344 1024.
Figure 1. High-spectral image data block
Figure 2. Hyperspectral imaging system
1.CCD camera 2. Spectrometer 3. Lens 4.Lightsource 5.Feedway 6. Graphics card 7.Image processor computer 8. Display screen 9. Darkroom Box
C. Image Acquisition
Before the hyperspectral image data is acquired, we should ensure that the exposure time of hyperspectral camera is 20 ms through a pre-test, and determine the speed of the conveyor is 1.25mm/s. At first, we put a piece of paper, which is big enough in the displacement stage, and then put the cucumber infected downy mildew leaf on the white paper. And then set the value of a RGB wavelength. When the
data is being acquired, the cucumber leaf moves in a constant speed. Hyperspectral camera with the image spectrograph obtains the spectral information in every wavelength from each pixel of the infected leaf. At the same time, the image data of cucumber infected leaf is collected in each band. Every infected leaf image has 1024 bands. And eventually a hyperspectral image data block is gotten, whose size is 1344 1024 1024.
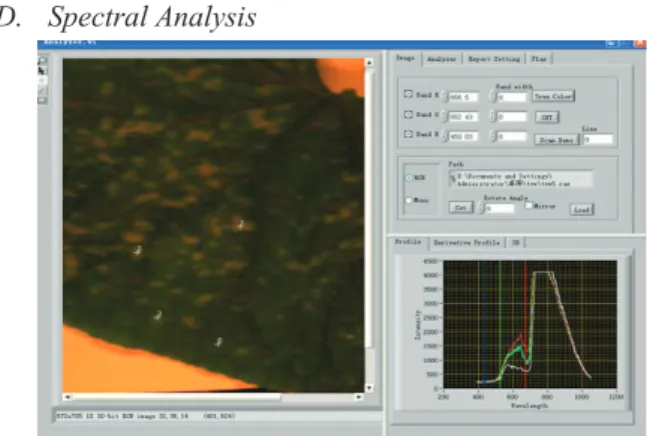
Hyperspectral images that have been collected are stored to the computer through the USB interface. These images are analyzed by the analysis software which are owned by the hyperspectral image acquisition system. The image acquisition and the analysis interfaces are shown in Fig.3. The left part shows a hyperspectral image of cucumber infected leaf in a special wavelength, the right upper part is an area for parameter settings, the right lower portion is a spectral curve of the infected leaf in a given pixel.
Results and Analysis
D. Spectral Analysis
Figure 3. GUI for hyperspectral image acquisition and analysis
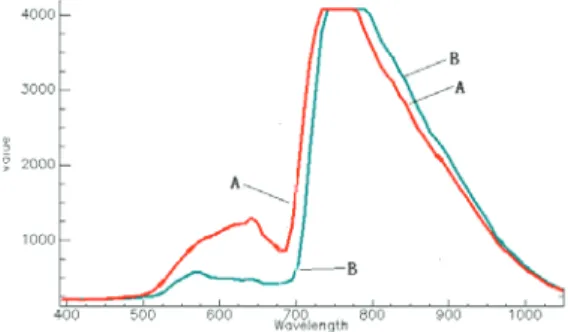
From the above analysis, the collected hyperspectral image of cucumber leaf infected downy mildew not only has two-dimensional image information, but also has spectral information on each pixel of the image can be seen. Fig. 4 is two spectral curves that have a normal pixel and a spot pixel within the scope of 400 1100nm, which are collected from a cucumber leaf infected downy mildew. The curve A is the spectral curve of cucumber downy mildew in a spot, the curve B is the spectral curve of a normal part. From the Fig.4, it’s clear to see that the spectral curves between the spot pixels and the normal pixels in the scope of 560 720nm have significant differences. The reason is that chlorophyll plays an important role in reflecting the spectral properties of plants in the visible region. Between the 560nm and720nm, chlorophyll absorbs less, so its reflection is more. When the cucumber downy mildew occur, the leaves appear brown spots, in which the contents of chlorophyll are lower, the chlorophyll reduce the absorption but the reflection increased, especially the spectral value have a great increase in red bands. Therefore, the spectral values have great different in the visible spectral region of 560 720nm.
In addition, in the near infrared region of 780nm~900nm, the spectral reflection intensity between the leaf’s normal part and the spots part has a marked difference. The reason is that the spectral characteristics of leaves depend on the cell structure of leaf in the near infrared spectrum. In this band, the internal structure of leaf between spots and normal parts are different, so the spectral reflection intensity in the spots part is lower than normal part.
So we select the hyperspectral image data to analysis in the visible spectral range of 560 720nm and within the near infrared spectral range of 780~900nm in the subsequent data processing.
E. Principal Component Analysis
The template is designed so that author affiliations are not repeated each time for multiple authors of the same affiliation. Please keep your affiliations as succinct as possible (for example, do not differentiate among departments of the same organization). This template was designed for two affiliations.
Principal component analysis [10] is a very effective method of dimensionality reduction for multi-dimensional data. Principal component analysis, which along the direction of the largest covariance by linear combination from the high-dimensional data space to low-dimensional data space, changes
Figure 4. GUI The sample spectral curve in normal and spots region for hyperspectral image acquisition and analysis
the original variables to some new ones, which are not relevant, can reflect the original data information greatly. This method can not only come true the data dimension reduction, but also eliminate redundant information in the original data. So we extract a few former principal component images by principal component analysis to find the easiest method to detect the principal component images of cucumber infected leaf.
The three former images of principal component analysis are obtained as shown Fig.5. Among them, PC1, PC2 and PC3 are the first, the second and the third principal component images. From the Fig.5, it is clear that the first principal component image has a great gray and gray-scale difference compared with the surrounding region, which is the qualified image for this experiment.
F. Image Fusion
Image fusion[11] refers to merging some images from different sensors in order to obtain a more complete picture or scene. The main purpose of image fusion is to improve the reliability and the clarity of the image by removing the redundant information. Image fusion adopts the principal component spectral fusion to synthesize for two or more different images. The method of the principal component spectral fusion[12] belongs to a pixel-level image fusion method, which is known as pixel-based image fusion, belongs to the bottom of the image fusion. The advantage of pixel-level image fusion is that it retains the scene of the original information as much as possible. This paper adopts the pixel-level image fusion. The three new images (PCx, PCy and PCz) are obtained by image fusion, which are merged with the first three obtained principal components images and the image (values of RGB are 634.79, 700.14, and 679.57nm), shown as Fig.6.
G. Object Extraction
According to the Fig.6, it can be seen that the first principal component image (PCx) is clearer and its spots have distinct different between with normal part, so we select the PCx images as the target to detect. The images PCx have lots of noises, as is shown in Fig.7(a), so we proceed to median filter (3×3 template), the result is shown in Fig.7 (b). In order to make it easier to detect the cucumber infected leaf region, we select the appropriate threshold for binarization for Fig.7(b). The result is shown in Fig.7(c). Then corrosion (3×3 template) is done twice[9] to remove the fragmented bright spots in the image, which is
shown in Fig.7(d). At last, expansion (3×3 template) is done twice to complete the extraction of cucumber infected leaf. The result is shown in Fig.7 (e).
a.PC1 b.PC2 c.PC3 Figure 5. The first three obtained principal components images by the principal component analysis in the full wavelength range
a.PCx b.PCy c.PCz Figure 6. The three new images by image fusion
a. PCx b. Median filter c. Binarization
d. Erosion e. Dilatation
Figure 7. GUI for hyperspectral image acquisition and analysis Feature Extraction of cucumber leaf disease H. Experimental results and analysis
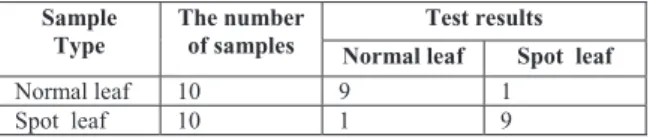
According to the above steps, we have detected ten infected leaf samples of cucumber and ten normal ones, the results are shown in Table 1. As is seen from Table 1, nine samples are detected correctly from ten normal cucumber leaf samples. Nine samples are detected correctly from ten cucumber infected leaf samples. The overall detection accuracy rate is 90%. Further analysis of the test results shows that the reasons of normal cucumber leaf samples detected falsely are complex, the mainly reason is that they have some noises both the critical edge and the background. After some treatments, we do not eliminate these noises completely and then the result is shown. The reason of mistaking the infected leaf as the normal one
is that the spot area of the cucumber infected leaf is so small that the spots are disappear after erosion processing.
Table 1 The results of cucumber leaves detecting
Sample Type
The number of samples
Test results
Normal leaf Spot leaf
Normal leaf 10 9 1
Spot leaf 10 1 9
Conclusion
This paper has conducted a preliminary study for detecting the cucumber downy midew by the hyperspectral imaging technology, and taken advantage of the principal component analysis to come true the dimensionality reduction of hyperspectral data effectively. The results validate the feasibility on detecting cucumber downy midew by hyperspectral imaging technology and the principal component analysis. Image fusion technology make the new image more obvious by combining the source image and the images after conducted by the principal component analysis between the image of the spot area and the normal part. In order to detect the disease, we carry on enhancement, binarization, corrosion and expansion treatments for the fusion image to make the spot characteristic clearer. The results show that the accuracy rate of this algorithm for detecting the cucumber downy mildew can reach nearly 90%. Hyperspectral imaging technology can be used for detecting the diseases of other crops by taking advantage of both image and spectral information.
References
[1] A. Camargoa, J.S. Smith. “An image-processing based algorithm to automatically identify plant disease visual symptoms,” Biosystems Engineering, vol. 102, no.1, pp.9-21, 2009.
[2] Tian Youwen, Li Chenghua. “Research on recognition of cucumber disease based on image processing in sunlight greenhouse,” Journal of Agricultural Mechanization Research, vol.28, no.2, pp.151-153, February 2006.
[3] Cedric Bravo1, Dimitrios Moshou1, Jonathan West, et al. “Early Disease Detection in Wheat Fields using Spectral Reflectance,” Biosystems Engineering, vol. 84, no.2, pp.137-145, 2003.
[4] H.R. Xu, Y.B. Ying, X.P. Fu,et al. “Near-infrared Spectroscopy in detecting Leaf Miner Damage on Tomato Leaf,” Biosystems Engineering, vol. 96, no.4, pp.447-454 , 2007.
[5] Johnson III Owen N, Slidell Mark, Kreishman Peter, et al. “Hyperspectral imaging:An emerging technology as a potential novel adjunct in assessing peripheral perfusion deficits and success of lower extremity revascularizations,” Journal of the American College of Surgeons, vol. 207, no.3, pp.114, 2008.
[6] Park B,Windham W R, Lawrence K C,et al. “Contaminant classification of poultry hyperspectral imagery using a spectral angle mapper algorithm. Biosystems Engineering,” vol. 96, no.3, pp.323-333,2007.
[7] Mahesh S, Manickavasagan A, Ayas D S, et al. “Feasibility of near-infrared hyperspectral imaging to differentiate Canadian wheat classes,” Biosystems Engineering, vol.101, no.1, pp.50-57,2008.
[8] CHEN Quan-sheng, ZHAO Jie-wen, CAI Jian-rong,et al. “Estimation of tea quality level using hyperspectral imaging technology,” Acta Optica Sinica, vol.28, no.4, pp.669-674, 2008.
[9] Chen Y R, Chao K, Kim M S. Machine vision technology for agricultural applications. “Computers and Electronics in Agriculture,” vol.36, no.2, pp.173~191, 2002.
[10] Liu Chun-hong, Zhao Jie-wen, Cai Jian-rong. “A new dimension reduction method of hyperspectral remote sensing images,” China Journal of Image and Graphics,no.2, pp.218-222, 2005.
[11] Yocky D A. “Image merging and data fusion by means of the discrete two-dimensional wavelet transform,” Journal of Optical Society of America, vol.12, no.9, pp.1834-1841, 1995.