A Multi-Agent Classifier System based on Fuzzy-ARTMAP and Fuzzy
Min-Max Neural Networks
Dr. Anas Quteishat
Al-Balqaa Applied University/ Faculty of Engineering Technology Computer Engineering Department
ABSTRACT
In this paper, we propose a Multi-Agent Classifier (MAC) system based on the Trust, Negotiation, and Communication (TNC) model. A novel trust measurement method, based on the recognition and rejection rates, is proposed. Two agent teams, each consists of three neural network (NN) agents, are formed. The first is the Fuzzy Min-Max (FMM) NN agent team and the second is the Fuzzy ARTMAP (FAM) NN agent team. An auctioning method is also used for the negotiation phase. The effectiveness of the proposed model and the bond (based on trust) is measured using two benchmark classification problems. The bootstrap method is applied to quantify the classification accuracy rates statistically. The results demonstrate that the MAC system is able to improve the performances of individual agents as well as the team agents. The results also compare favorably with those from other methods published in the literature.
Keywords: Multi-Agent Classifier; Trust; Negotiation; and Communication (TNC) model; Fuzzy Min-Max;
Fuzzy ARTMAP.Council for Innovative Research
Peer Review Research Publishing SystemJournal:
INTERNATIONAL JOURNAL OF COMPUTERS & TECHNOLOGY
Vol 12, No.2
[email protected]
1. INTRODUCTION
The Multi-Agent System (MAS) approach has gained much research interest over the last decade. This is evidenced by the widespread application of MAS in different domains including eCommerce[1],healthcare [2], military support [3], intelligent decision support[4], knowledge management [5], as well as control systems[6]. A number of models have been used to describe the relation between agents in MASs, and one of the earliest models is the Beliefs, Desires, Intentions (BDI) reasoning model [7]. Another model used in MAS is the decision support pyramid model [8]. The focus of this paper, however, is on the use of the Trust, Negotiation, and Communication (TNC) model [9]to implement a MAS model for pattern classification.
In our work, the proposed Multi-Agent Classifier (MAC) system consists of an ensemble of neural network (NN)-based classifiers. Two NN classifier agents are employed, (i) Fuzzy ARTMAP (FAM)[10] (ii) Fuzzy Min-Max (FMM) [11]network. A novel method to measure trust by using the classification accuracy rates of the agent is proposed. To verify the effectiveness of the proposed MAC system and the trust measurement method, the Pima Indian Diabetes (PID) and the Wisconsin Breast Cancer (WBC) benchmark data sets are employed. The results are compared with those from a number of machine learning systems published in the literature. The bootstrap method is also applied to quantify the results statistically.
This paper is organized as follows. Section 2 gives a description on the architecture of the TNC-based MAC system. The proposed trust measurement and negotiation methods are explained in section 3. The experimental results and discussion are presented in section 4. Finally, section 5 gives a summary of the work presented in this paper.
2. A NEW TNC-BASED MULTI-AGENT CLASSIFIER SYSTEM
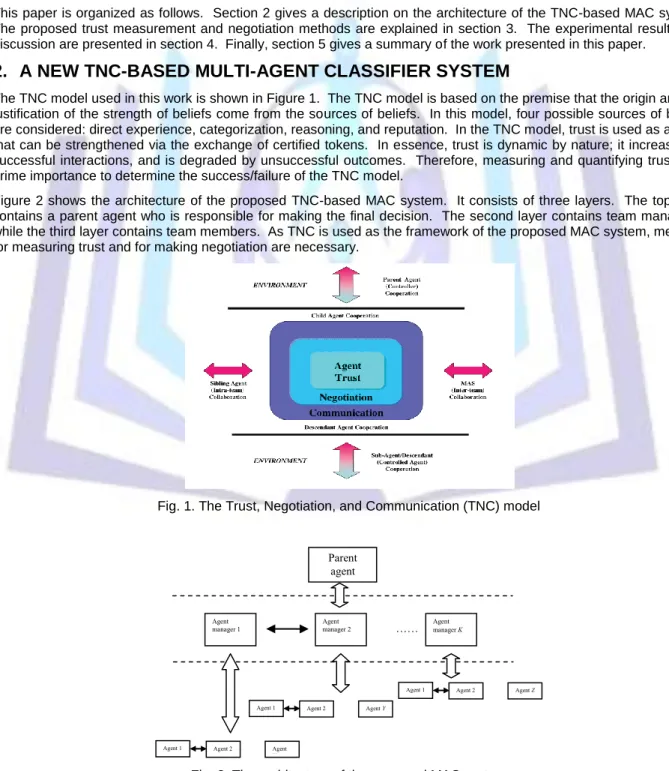
The TNC model used in this work is shown in Figure 1. The TNC model is based on the premise that the origin and the justification of the strength of beliefs come from the sources of beliefs. In this model, four possible sources of beliefs are considered: direct experience, categorization, reasoning, and reputation. In the TNC model, trust is used as a bond that can be strengthened via the exchange of certified tokens. In essence, trust is dynamic by nature; it increases by successful interactions, and is degraded by unsuccessful outcomes. Therefore, measuring and quantifying trust is of prime importance to determine the success/failure of the TNC model.
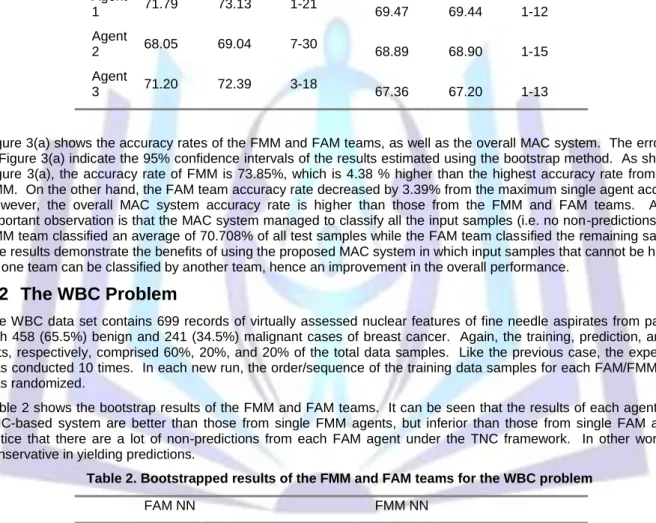
Figure 2 shows the architecture of the proposed TNC-based MAC system. It consists of three layers. The top layer contains a parent agent who is responsible for making the final decision. The second layer contains team managers, while the third layer contains team members. As TNC is used as the framework of the proposed MAC system, methods for measuring trust and for making negotiation are necessary.
Fig. 1. The Trust, Negotiation, and Communication (TNC) model
Fig. 2. The architecture of the proposed MAC system
Parent agent Agent manager K Agent manager 2 Agent manager 1
Agent 1 Agent 2 Agent Z
Agent 1 Agent 2 Agent Y
Agent 1 Agent 2 Agent
X
…… …
Negotiation used in the MAC system is based on an auctioning process. Auctioning is one of the most popular and mostly used negotiation processes in any MAS[12]. There are several bidding approaches, and the one used in this work is the “sealed bid - first price auction” method[13]. In this negotiation method, each agent first submits its bidding value, without knowing the bidding values of other agents (sealed bid). Then it is up to the auctioneer to take the decision based on the highest price
Given a new input sample, each agent within the team first gives a prediction (if available) of the output class of that input sample, and associates that prediction with a trust value. Then the team manager selects the prediction with the highest trust value. After that, an auctioning process takes place among the team managers. Each agent manager gives its prediction to the parent agent. Along with the prediction, each manager has to give a trust value, a reputation value, and a confidence factor. The parent agent makes a final decision and assigns a predicted output class for that particular input sample.
The proposed MAC system comprises two teams, each with three agents. The first team is formed by three FMM agents, while the second team is formed by three FAM agents. The FMM is a supervised classification network formed by using hyperbox fuzzy sets. A hyperbox defines a region of the n-dimensional pattern space that has patterns with full class membership. The hyperbox is completely defined by its minimum (min) and maximum (max) points. The membership function is defined with respect to these hyperbox min-max points, and describes the degree to which a pattern fits in the hyperbox. For an input pattern of n-dimensions a unit cube
I
n is defined. In this case the membership value ranges between 0 and 1. A pattern which is contained in the hyperbox has the membership value of one.On the other hand, the FAM network consists of a pair of Adaptive Resonance Theory (ART) modules designated as ARTa and ARTb, which create stable recognition categories in response to arbitrary sequences of input patterns. FAM also includes a map field module, Fab, that establishes an association between input patterns and target classes. FAM uses fuzzy membership values between 0 and 1, indicating the extent to which each feature is present/absent, to represent its input patterns.
Although FAM and FMM have different network structures, they share a number of similarities. First, both networks possess the same incremental learning property, i.e. they learn through a single pass of the training samples. Second, since both networks learn incrementally, the knowledge base formed in the networks is affected by the sequence of the training samples. In other words, different sequences of training samples form different knowledge bases in the network structures, hence different prediction capabilities. Third, in FMM, the weight vector of each node represents the minimum and maximum points that form a hyperbox in the pattern space. In FAM, the weight vector of each node also represents a hyperbox encoded by the minimum value of the input vectors and its complement-coded pairs. Finally, the performances of FMM and FAM primarily are governed mainly by one factor, i.e., the hyperbox size
of FMM and the baseline vigilance parameter,
a of FAM.As mentioned earlier the performances of both NN models are affected by the orders/sequences of the training samples. One of the ways to improve the performances of these NN models is by voting[10]. Instead of voting, we propose the use of agent teams to overcome this order/sequence problem. Here, each FMM/FAM agent is created by randomizing the sequence of the training samples. This satisfies the requirement that all agents within the team have the same learning capabilities, but with different initial knowledge bases.
3. MEASURING TRUST IN THE MAC SYSTEM
As shown Figure 1, the core element of the TNC model is based on trust. There are many definitions for trust. A simple one is the confidence places in a person/thing, or more precisely the degree of belief in the strength, ability, truth, or reliability of a person/thing (Kelly et al., 2003). Measuring trust is inherently subjective; therefore a process of monitoring its attributes must be established. In this paper we propose to use the reliability rate [14] for trust calculation. The reliability rate of each FMM/FAM agent is calculated using equation (1):
Rejection -1 n Recognitio y Reliabilit Trust (1)
where recognition is the ratio of the number of correct classifications to the total number of samples, and rejection is the ratio of the number of rejected classifications to the total number of samples.
In the original manifestation of FMM and FAM, there is no rejection criterion. To calculate the rejection rate, we propose to use the failure quality concepts discussed in [15]. Two suitable failure quantities used for the rejection criterion include interference and the restrictedness, and they are defined as:
Interference being the degree to which a classifier is unable to label a class to an input sample because the sample
Restrictedness is the degree where a classifier leaves an input sample without classification because that sample does not fit to any class label.
To measure the above quantities, we apply the weighted confidence factor (CF) method, as proposed in [16], for both FAM/FMM agents. Based on the confidence factor, the failure concepts are therefore calculated using equations (2) and (3): otherwise ) class(CF ) (CF class CF CF if 0 1 ce Interferen 1 2
1 2 (2) otherwise CF if ness Restricted 1
0 1 (3)where CF1 and CF2 are the confidence factors of the highest and second highest responded
F
2a node/hyperbox activated by the current input sample, and
is a user-defined interference threshold and
is a user-defined restrictedness threshold.To calculate the confidence factors, the training data set is divided into two sub-sets: one for training and another for prediction, as proposed in [16]. The prediction data set is then used to calculate the confidence factor for each
F
2anode/hyperbox. In addition, we use the prediction data set to calculate the initial trust for each agent. The initial trust is referred to as the reputation of an agent. The overall team reputation is the average of the reputations for all agents within the team.
To preserve the dynamic nature of trust measurement, the trust value is increased with successful predictions and is reduced with unsuccessful ones. To satisfy this nature of trust measurement, if each time the prediction of a sample is not rejected and is correctly classified, the trust value is increased by the Reliability value divided by the total number of test samples. However, if a sample is wrongly predicted or a sample is rejected for classification, the trust value is reduced by a factor equal to one over the total number of test samples.
In the test phase, the parent agent (the auctioneer) provides the current test sample to the team managers. The managers propagate the test sample to all team agents. Each agent gives a prediction for that particular sample to the team manager along with the trust value of that prediction and the confidence factor of the
F
2a node/hyperbox responsible for that prediction. The team manager then chooses the prediction with the highest trust value, and submits this prediction to the parent agent along with its reputation value, the trust value of the prediction, and the confidence factor for responsibleF
2a node/hyperbox. When the parent agent receives predictions from all teams, it makes a final prediction based on the highest Decision value using equation (4), as follows.Decision = Team Reputation + Trust value + CF value (4)
In the next section, an empirical evaluation using two benchmark data sets are presented in order to demonstrate the effectiveness of the proposed TNC-based MAC system and verify the proposed technique used to measure trust.
4. EXPERIMENTS AND RESULTS
The proposed method is evaluated two benchmark1 data sets. After several trial runs, the free parameter setting of the MAC system was as follows: the hyperbox size (
) of FMM was set to 0.275, while the baseline vigilance (
a) of FAM was set at 0.70. The interference threshold
was set to 0.05 and the restrictedness threshold
was set to 0.1. The experiment was conducted ten times for agent team. During each run, the order/sequence of the training data samples for each FAM and FMM agent was randomized. The final TNC-based test accuracy rate was calculated using equation (5): samples) test predicted -non of number ( samples test of number Total samples test classifid correctly of Number accuracy test based -TNC (5)4.1 The PID Problem
The PID data set consists of 768 cases which belong to two classes, in which 268 cases (35%) are from patients diagnosed as diabetic and the remaining are healthy. The experiment was conducted using 60% of the data set for
1The Pima Indian Diabetes (PID) and Wisconsin Breast Cancer (WBC) data sets from the UCI machine learning repository (Asuncion & Newman,
training, 20% for prediction and the remaining 20% for test. To quantify the performance statistically, the bootstrap method was used to compute the mean accuracy across all 10 runs.
Table 1 shows the bootstrap mean results of the FMM and FAM teams. The performance of each agent under the TNC framework is also shown. Note that there were some non-predictions from each agent under the TNC framework. It can be seen that each agent under the original setting or the TNC framework provides comparable results. However, the overall team accuracy rate can be further improved based on the aggregated results.
Table 1. Boot strapped results of the FMM and FAM teams for the PID problem
FAM NN FMM NN
Original FAM
TNC-based system Original FAM
TNC-based system
Accuracy Accuracy
Non-predictions Accuracy Accuracy Non-predictions Agent 1 71.79 73.13 1-21 69.47 69.44 1-12 Agent 2 68.05 69.04 7-30 68.89 68.90 1-15 Agent 3 71.20 72.39 3-18 67.36 67.20 1-13
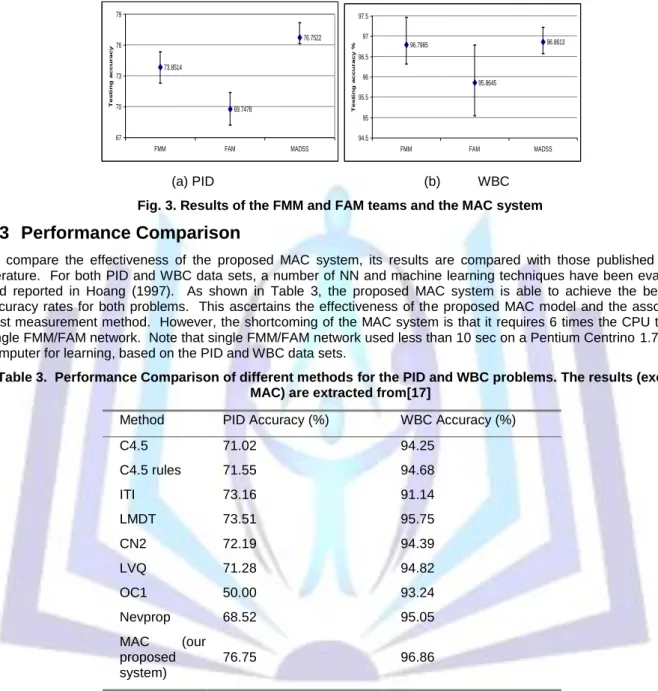
Figure 3(a) shows the accuracy rates of the FMM and FAM teams, as well as the overall MAC system. The error bars in Figure 3(a) indicate the 95% confidence intervals of the results estimated using the bootstrap method. As shown in Figure 3(a), the accuracy rate of FMM is 73.85%, which is 4.38 % higher than the highest accuracy rate from single FMM. On the other hand, the FAM team accuracy rate decreased by 3.39% from the maximum single agent accuracy. However, the overall MAC system accuracy rate is higher than those from the FMM and FAM teams. Another important observation is that the MAC system managed to classify all the input samples (i.e. no non-predictions). The FMM team classified an average of 70.708% of all test samples while the FAM team classified the remaining samples. The results demonstrate the benefits of using the proposed MAC system in which input samples that cannot be handled by one team can be classified by another team, hence an improvement in the overall performance.
4.2 The WBC Problem
The WBC data set contains 699 records of virtually assessed nuclear features of fine needle aspirates from patients, with 458 (65.5%) benign and 241 (34.5%) malignant cases of breast cancer. Again, the training, prediction, and test sets, respectively, comprised 60%, 20%, and 20% of the total data samples. Like the previous case, the experiment was conducted 10 times. In each new run, the order/sequence of the training data samples for each FAM/FMM agent was randomized.
Table 2 shows the bootstrap results of the FMM and FAM teams. It can be seen that the results of each agent in the TNC-based system are better than those from single FMM agents, but inferior than those from single FAM agents. Notice that there are a lot of non-predictions from each FAM agent under the TNC framework. In other word, it is conservative in yielding predictions.
Table 2. Bootstrapped results of the FMM and FAM teams for the WBC problem
FAM NN FMM NN
Original FAM
TNC-based system Original FAM
TNC-based system
Accuracy Accuracy
Non-predictions Accuracy Accuracy Non-predictions Agent 1 95.71 92.31 0-89 95.14 97.69 13-31 Agent 2 95.71 95.56 3-48 93.57 96.77 13-33 Agent 3 95.00 87.80 0-24 92.14 97.52 6-29
Figure 3(b), shows the test accuracy rates of the FMM and FAM teams, as well as the MAC system. Again, the error bars indicate the 95% confidence interval of the results (estimated using the bootstrap technique). For the MAC system, out of the 140 test samples, the FMM team classified 104 samples while the FAM team classified the remaining 36 samples. Again, the results demonstrate the benefit of the proposed MAC system, i.e. the agent teams are able to cover the shortcomings of each other, and to produce an improved performance under the TNC framework.
(a) PID (b) WBC
Fig. 3. Results of the FMM and FAM teams and the MAC system
4.3 Performance Comparison
To compare the effectiveness of the proposed MAC system, its results are compared with those published in the literature. For both PID and WBC data sets, a number of NN and machine learning techniques have been evaluated and reported in Hoang (1997). As shown in Table 3, the proposed MAC system is able to achieve the best test accuracy rates for both problems. This ascertains the effectiveness of the proposed MAC model and the associated trust measurement method. However, the shortcoming of the MAC system is that it requires 6 times the CPU time of single FMM/FAM network. Note that single FMM/FAM network used less than 10 sec on a Pentium Centrino 1.73 GHz computer for learning, based on the PID and WBC data sets.
Table 3. Performance Comparison of different methods for the PID and WBC problems. The results (except MAC) are extracted from[17]
Method PID Accuracy (%) WBC Accuracy (%)
C4.5 71.02 94.25 C4.5 rules 71.55 94.68 ITI 73.16 91.14 LMDT 73.51 95.75 CN2 72.19 94.39 LVQ 71.28 94.82 OC1 50.00 93.24 Nevprop 68.52 95.05 MAC (our proposed system) 76.75 96.86
5. SUMMARY
In this paper, a new MAC system, based on the TNC model, has been proposed. It has been shown that “trust” is the core of the TNC model. As such, a novel method for trust measurement has been introduced. The method is based on the recognition and rejection rates of classification. To investigate the effectiveness of the trust measurement methods, two NN-based agent teams, i.e., FMM and FAM, were formed. Two benchmark problems were used to evaluate the applicability of the proposed model. The results showed that the TNC-based MAC system yielded better test accuracy rates than those from individual teams, as well as those from a number of machine learning systems published in the literature.
Although the results obtained from the benchmark studies are encouraging, more experiments with data sets from different domains are needed in order to further ascertain the effectiveness of the proposed MAC system and the trust measurement method. Instead of the FMM/FAM network, use of other classifiers for the proposed TNC-based model can also be investigated.
73.8514 69.7478 76.7522 67 70 73 76 79 FMM FAM MADSS Te s ti ng a c c ura c y 96.7965 95.8645 96.8613 94.5 95 95.5 96 96.5 97 97.5 FMM FAM MADSS Te s ti ng a c c ura c y %
REFERENCES
[1] K. Gwebu, J. Wang, and M. D. Troutt, "Constructing a Multi-Agent System: An Architecture for a Virtual Marketplace," in Intelligent Decision Support Systems in Agent-Mediated Environments, G. Phillips-Wren and L. Jain, Eds., ed: IOS Press, 2005.
[2] D. L. Hudson and M. E. Cohen, "Use of intelligent agents in the diagnosis of cardiac disorders," in Computers in
Cardiology, 2002, pp. 633-636.
[3] A. Tolk, "An Agent-Based Decision Support System Architecture for the Military Domain," in Intelligent Decision
Support Systems in Agent-Mediated Environments, G. Phillips-Wren and L. Jain, Eds., ed: ISO Press, 2005.
[4] S. Ossowski, A. Fernandez, J. M. Serrano, J. Z. Hernandez, A. M. Garcia-Serrano, J. L. Perez-de-la-Cruz, et al., "Designing multiagent decision support system the case of transportation management," in Proceedings of the
Third International Joint Conference on Autonomous Agents and Multiagent Systems AAMAS 2004, pp.
1470-1471.
[5] R. Singh, A. Salam, and L. Lyer, "Using agents and XML for Knowledge representation and exchange: An intelligent distrubuted decision support architecture," in Proceeding of the Ninth Amiricas Conference on
Information Systems, 2003, pp. 1854-1863.
[6] S. Ossowski, J. Z. Hernandez, C. A. Iglesias, and A. Ferndndez, "Engineering agent systems for decision support," in Third International Workshop Engineering Societies in the Agents World ESAW'02, Madrid, Spain, 2002, pp. 184-198.
[7] M. E. Bratman, Intention, Plans, and Practical Reason: University of Chicago Press, 1999.
[8] R. Vahidov and B. Fazlollahi, "Pluralistic multi-agent decision support system: a framework and an empirical test," Information and Management vol. 41, pp. 883-898, 2004.
[9] K. Haider, J. Tweedale, P. Urlings, and L. Jain, "Intelligent Decision Support System in Defense Maintenance Methodologies," in International Conference onEmerging Technologies ICET '06. , 2006, pp. 560-567.
[10] G. A. Carpenter, S. Grossberg, N. Markuzon, J. H. Reynolds, and D. B. Rosen, "Fuzzy ARTMAP: A neural network architecture for incremental supervised learning of analog multidimensional maps," IEEE Transactions
on Neural Networks,, vol. 3, pp. 698-713, 1992.
[11] P. K. Simpson, "Fuzzy Min-Max Neural Networks-Part 1: Classification," IEEE Transactions on Neural Networks,
vol. 3, pp. 776-786, 1992.
[12] Z. Balogh, M. Laclavik, and L. Hluchy, "Multi Agent System for Negotiation and Decision Support," in Proceeding
of fourth International Scientific Conference Electronic Computers and Informatics, 2000, pp. 264-270.
[13] M. Beer, M.d'Inverno, N. Jennings, M. Luck, C. Preist, and M. Schroeder, "Negotiation in Multi-Agent Systems,"
Knowledge Engineering Review, vol. 14, pp. 285-289., 1999.
[14] L. Xu, A. Krzyzak, and C. Y. Suen, "Methods of combining multiple classifiers and their applications to handwriting recognition," IEEE Transaction on Systems, Man, and Cybernetics, vol. 22, pp. 418-435, 1992. [15] M. Egmont-Petersen, J. L. Talmon, J. Brender, and P. NcNair, "On the quality of neural net classifiers," Artificial
Intelligence in Medicine, vol. 6, pp. 359-381, 1994.
[16] G. Carpenter and A. Tan, "Rule Extraction: From Neural Architecture to Symbolic Representation," Connection
Science, vol. 7, pp. 3-27, 1995.
[17] P. Eklund and A. Hoang, "A Comparative Study of Public Supervised Classifier Performance on the UCI Database," Australian Journal of Intelligent Information Processing Systems, vol. 9, pp. 1-39, 2006.
Author’ biography with Photo
Anas Quteishatreceived the B.Eng. (Electronics) degree from Princess Sumaya University of Technology, Jordan, and both the M.Sc. (Electronic Systems Design) and Ph.D. degrees from Universiti Sains Malaysia, Nibong Tebal, Malaysia in 2003, 2005, and 2008, respectively. He is currently with Department of Computer Engineering, Faculty of Engineering Technology, Al-Balqa’ AppliedUniversity, Al-Salt, Jordan. His research interests include neural networks, pattern recognition, rule extraction, and multi-agent systems Department of Computer Engineering / Faculty of engineering Technology/ Al-Balqa’ Applied University Amman, Jordan Amman, P.O.Box (15008), marka ashamalia Tel (+962776176712) email: [email protected]