I N S T I T U T E
Legislative Powers and Executive
Corruption
M. Steve Fish, Katherine E. Michel and
Staffan I. Lindberg
Working Paper
SERIES 2015:7
Varieties of Democracy (V-Dem) is a new approach to the conceptualization and
measurement of democracy. It is co-hosted by the University of Gothenburg and
University of Notre Dame. With a V-Dem Institute at University of Gothenburg that
comprises almost ten staff members, and a project team across the world with four
Principal Investigators, fifteen Project Managers, 30+ Regional Managers, 170 Country
Coordinators, Research Assistants, and 2,500 Country Experts, the V-Dem project is one
of the largest-ever social science research-oriented data collection programs.
Please address comments and/or queries for information to:
V-Dem Institute
Department of Political Science
University of Gothenburg
Sprängkullsgatan 19, PO Box 711
SE 40530 Gothenburg
Sweden
E-mail: [email protected]
V-Dem Working Papers are available in electronic format at www.v-dem.net.
Copyright © 2015 by authors. All rights reserved.
Legislative Powers and Executive Corruption
∗
M. Steven Fish
University of California, Berkeley
Katherine E. Michel
University of California, Berkeley
Staffan I. Lindberg
University of Gothenburg
∗ This research project was supported by Riksbankens Jubileumsfond, Grant M13-0559:1, PI: Staffan I. Lindberg,
V-Dem Institute, University of Gothenburg, Sweden; Grant KAW 2013.0166 by Knut & Alice Wallenberg Foundation to Wallenberg Academy Fellow Staffan I. Lindberg, V-Dem Institute, University of Gothenburg, Sweden; by University of Gothenburg, Grant E 2013/43.
Introduction
The comparative politics literature is replete with cross-national studies of corruption,
though the precise dimensions this term encompasses frequently remain unclear. According to an
oft-cited definition by Robert Klitgaard (1998: 4), “corruption equals monopoly plus discretion
minus accountability.” Yet this definition really specifies the conditions that are likely to be
conducive to corrupt practices rather than corrupt practices themselves. One can readily imagine
an unaccountable actor who enjoys monopoly power and discretion not engaging in corrupt
practices. He or she may be constrained by habit, ethical beliefs, or fear of shaming. Other
conceptions provide what amount to lists of corrupt practices without necessarily offering a
rigorous definition of corruption itself. In its “UN Anti-Corruption Toolkit,” the United Nations
Office on Drugs and Crime distinguishes corruption on two axes—grand versus petty and active
versus passive—and identifies a long list of corrupt acts: bribery, theft, embezzlement, fraud,
extortion, abuse of discretion, favoritism, nepotism, clientelism, the exploitation of conflicting
interests (“conduct creating”), and improper political contributions (United Nations 2004). Such
a list points us to the vast array of corrupt practices, but it does not solve the problem of
definition.
Clear concepts are of great value. Yet the absence of consensus on a concept’s definition
need not prevent us from investigating the phenomenon itself, or preclude exploration of its
causes and consequences. If we were so constrained, empirical investigations of subjects like
“political culture,” “institutions,” and “democracy,” among many others of interest to social
scientists, would not be possible.
While scholars have not reached consensus on a definition of corruption, there is general
agreement that the misuse of public office for private material gain qualifies corrupt practice
(Rose-Ackerman 1999, 2008; Kaufmann 2005; Treisman 2007). Bribery, theft, and embezzlement
by public officials are universally regarded as examples of corruption, and this paper focuses on
these practices, in particular among executive branch officials.
Some analysts have treated corruption as benign, or at least unavoidable, under many
circumstances. According to such thinking, corrupt practices can “grease the wheels” and give
officials an incentive to deliver services that they might otherwise fail to provide at all. Particularly
at lower levels of socioeconomic development, corruption is sometimes seen as inevitable and
not necessarily dysfunctional in its effects (Leff 1964, 1965; Huntington 1968; Bardhan 1997).
Most scholars, however, have treated corruption as a problem rather than a solution—as sand,
not grease, in the wheels and as inimical to economic development, popular government, and
public morale (Mauro 1995; Méon and Sekkat 2005). Comparative political scientists often
highlight the negative effects of corruption on institutional efficacy. Karklins (2002: 32) states:
By distorting the purpose of public institutions, corruption undermines good governance
and democracy, both in the minds of a citizenry that no longer trusts state and political
institutions, and in terms of the cost that the citizenry pays in terms of poor state
performance. Beyond the poor results, the undermining of good governance distorts
democratic procedures and principles. Procedurally, corruption involves breaking the
rules and laws that undergird an institution or entire regime. It also involves deception,
fraud, and an impulse to corrupt others to either help hide or even expand illegal
activities. More important, corruption undermines the principles on which democratic
regimes are built, such as the rule of law, free and fair electoral competition, and
representative and responsive government.
Given the potentially devastating effects of corruption, scholars have exerted much effort
in assessing what influences the level of corruption cross-nationally. Treisman (2007) succinctly
summarizes the most robust results from this literature, finding that less corruption correlates
with high economic development, long-established liberal democracies with a free and
widely-read press, a high share of women in government, and a history of openness to trade. More
corruption correlates with a high dependence on fuel exports, intrusive business regulations, and
unpredictable inflation.
1Despite these reported correlations, the expansive, sometimes amorphous nature of
corruption and the absence of consensus on precisely what corruption is leads to numerous
measurement issues. Many cross-national studies rely on subjective measures of
perceived
corruption, rather than objective measures of corruption itself. A standard measure is
Transparency International’s “Corruption Perceptions Index” (CPI), a yearly ranking of most of
the world’s countries based on expert assessments and opinion surveys.
2Other indices are
available, including Freedom House’s “Nations in Transit” project, which measures corruption in
a subset of transitional countries, and the World Bank’s “Worldwide Governance Indicators”
1 When analyzing measures of reported corruption experiences rather than perceived levels of corruption, corruption correlates with lower development. It also possibly correlates with dependence on fuel exports, lower trade exports, and more intrusive regulations.
2 In addition to a number of studies reviewed by Treisman (2007), Billger and Goel (2009) use quantile regression estimates to assess how the determinants of corruption (as measured by the CPI) differ in countries with high and low levels of corruption.
project, which measures “control of corruption.”
3Yet these indicators have at least three
weaknesses: They are prone to measurement error because corruption takes a variety of forms
and often takes place in secret; they are created in part from survey data, and respondents may
choose to misreport or not report information on corruption; and they are ordinal measures and
thus do not actually capture the magnitude of corruption (Svensson 2005: 21-3).
What the cross-national corruption literature needs, then, is a new set of corruption
measures that (1) attempts to measure the magnitude of corruption, and (2) breaks apart the
expansive definition of “corruption” into smaller components, or distinct corrupt practices. The
Varieties of Democracy (V-Dem) project, an ongoing data collection effort that uses surveys of
more than 2000 country experts, offers such measures, as well as a vast array of other political
indicators over the period 1900 to 2012 (Coppedge, et al. 2011). In this paper, we conduct an
exploratory analysis of one facet of this new data: corruption within the executive branch of
government. The V-Dem data provide us with not only several useful measures of corruption,
which we use for our dependent variable, but also a host of measures of political institutions and
conditions, which we draw on for our independent variables.
We organize the paper as follows. First, focusing on executive corruption as our
dependent variable of interest, we present our hypothesis that the presence of a strong legislature
limits executive corruption. Second, we describe our data, which include new measures of
corruption and legislative powers from the V-Dem project. Third, we present the results of our
cross-sectional, time-series analysis. We find a negative association between executive corruption
levels and three legislative powers: (1) the power of the legislature to investigate the executive in
practice; (2) the power of the legislature to control its own funding; and (3) the power of the
legislature to pass legislation in all policy areas in practice. Fourth, we test whether these
significant variables affect level of corruption of the
legislature. We find that, in line with our
expectations, two of the three variables are uncorrelated with legislative corruption and one
variable—the ability to investigate the executive in practice—actually reduces legislative
corruption. Fifth, we conclude.
3 Brown, et al. (2011), for instance, argue that high levels of ideological polarization increase the perception that corruption is being controlled (as measured by the World Bank).
Theory
In the contemporary world, autonomous executives often have been foes of clean
politics. Even many politicians with reputations as democrats who captured the top executive
office in free elections have proven prone to abuse their power and engage in corrupt practices.
Powerful executive presidents are particularly prone to engage in abuse. Russia’s Boris Yeltsin
and Vladimir Putin, Peru’s Alberto Fujimori, Kyrgyzstan’s Askar Akayev, Senegal’s Abdoulaye
Wade, and Zambia’s Frederick Chiluba are only a few examples of presidents who faced protest,
investigation, or prosecution following corruption scandals. Prime ministers might often be more
constrained by legislatures, but they too may foment rot, as Italy’s Silvio Berlusconi and
Thailand’s Thaksin Shinawatra did during their time in office.
Autonomous executives threaten what Guillermo O’Donnell (1999) calls “horizontal
accountability,” which he defines as “the controls that state agencies are supposed to exercise
over other state agencies.” O’Donnell has in mind particularly the controls that agencies from the
various branches of government place on one another, such as the legislature’s control over the
executive. In developing countries, executives—and particularly presidents—usually enjoy a big
advantage. Most agencies of state fall under their authority, and executives typically also have
considerable sway over the judiciary. The best hope for ensuring some check on the executive,
according to O’Donnell and other scholars, is a powerful legislature that has the authority to
monitor and push back against the executive (Fish 2005a, 2005b).
By which mechanisms might a robust legislature influence the level of corruption in the
executive branch? We are concerned, first, with the legislature’s ability to constrain the executive.
The ability to investigate the activities of the executive branch serves as an example of a power of
this type. Such powers provide the legislature with oversight functions, increasing the level of risk
for an executive who wishes to engage in corrupt practices such as bribery or embezzlement. We
expect executive corruption to be lower when the legislature holds powers that constrain the
executive than when it does not enjoy such powers.
Second, we are concerned with the legislature’s autonomy from the executive. A robust
legislature holds not only powers that constrain the executive, but also powers that provide it
with freedom from executive control. How might an executive limit legislative autonomy?
An executive may reduce legislative autonomy by retaining power over a legislature’s operational,
day-to-day activities. When a legislature lacks the ability to control the funds that finance its own
operations, for instance, it not only fails to place direct constraints on the executive, but also
loses operational autonomy. When the executive controls these funds, then s/he controls the
resources that legislators draw on to pay for (1) the legislature’s operations and (2) the legislators’
own perks. This gives the executive a powerful tool that s/he can wield to manipulate legislators
and discourage them from carrying out due diligence, particularly in terms of pushing back
against any questionable executive behavior. When a legislature enjoys operational autonomy,
alternatively, it might bolster the legislature’s ability to resist executive encroachment and
manipulation. This power does not exactly
constrain
the executive, but it may enhance the
legislature’s capacity for playing an independent role and carrying out its duties, including those
that involve checking the executive.
In addition, an executive may reduce legislative autonomy by having powers over
policy-making. If an executive has the power of veto, for example, s/he has the ability directly to
constrain the legislature’s capacity for making laws, its central function. Just as with executive
power over the operational activities of the legislature, an executive with the ability to block
legislation that hinders the fulfillment of his or her goals holds a powerful tool with which to
constrain the legislature. We therefore expect executive corruption to be lower when a legislature
holds powers providing freedom from executive control (or alternatively, we expect executive
corruption to be higher when the executive holds powers that constrain the legislature).
Data
To test our theoretical suppositions relating various types of legislative powers to
executive corruption, we use data from the Varieties of Democracy (V-Dem) project. We utilize
two V-Dem variables as our dependent variables of interest: (1) executive bribery and corrupt
exchanges and (2) executive embezzlement and theft. Each variable represents a unique facet of
executive corruption, with survey respondents asked to answer the following questions:
Executive bribery and corrupt exchanges: How routinely do members of the executive (the head
of state, the head of government, and cabinet ministers), or their agents, grant favors in
exchange for bribes, kickbacks, or other material inducements?
Executive embezzlement and theft: How often do members of the executive (the head of state,
the head of government, and cabinet ministers), or their agents, steal, embezzle, or
misappropriate public funds or other state resources for personal or family use?
Survey respondents answered each question according to a zero to four scale, with zero
indicating routine or constant executive corruption and four representing a lack or near lack of
executive corruption. The V-Dem team then converted each variable to an interval scale
according to its measurement model.
4In addition to our dependent variables, we also use V-Dem data to measure the legislative
powers that approximate the powers outlined above in our theory section. For legislative powers
that constrain the executive, we use five V-Dem indicators:
Investigation power, de facto
: If the executive were engaged in unconstitutional, illegal, or
unethical activity, how likely is it that a legislative body (perhaps a whole chamber,
perhaps a committee, whether aligned with government or opposition) would conduct an
investigation that would result in a decision or report that is unfavorable to the executive?
Investigation power, de jure
: Does the legislature have the power to investigate the activities of
the executive branch?
Interpellation power
: Does the legislature have the power to interpellate members of the
executive branch, or similarly, is the executive responsible for reporting its activities to the
legislature on a regular basis?
Power to pass legislation, de facto
: In practice, is the approval of the lower (or unicameral)
chamber of the legislature required to pass legislation?
Power to pass legislation, de jure
: By law, is the approval of the lower (or unicameral) chamber
of the legislature necessary to pass legislation?
In addition to the previously-mentioned de jure and de facto powers of investigation, we
include an additional three legislative powers as examples of executive constraints. First, we
include the power of interpellation. Similar to the power of investigation, interpellation power
provides the legislature with an oversight function over the executive branch. Second, we include
the de facto and de jure powers to pass legislation. In some polities, the legislature’s approval is
always necessary for laws to be enacted. In these cases, even if the executive has the right to
introduce legislation, s/he must always share lawmaking powers with the legislature. This power
therefore gives the legislature a functional monopoly on law-making because, in effect, it denies
the executive the ability to decree laws—a clear executive constraint.
Moving beyond executive-constraining powers, we use three V-Dem indicators to signify
powers that ensure legislative autonomy from the executive:
Power over funding: In practice, does the legislature control the resources that finance its
own internal operations and the perquisites of its members?
Executive veto power: Does the executive have the power to approve/reject legislation once
it has been passed by the legislature (not including reviews for constitutionality)?
5Amendment power: By law, can the legislature (including both chambers of the legislature)
change the constitution without the involvement of any other body?
As a complement to power over funding and executive veto power—the latter of which
demonstrates a
lack of legislative autonomy in policy-making—we also include legislative
amendment power. The power to amend the constitution gives the legislature the ability to define
or redefine both operational and policy-making procedures. This allows legislators to place
constitutional safeguards against executive encroachment and guarantee the legislature’s
autonomy.
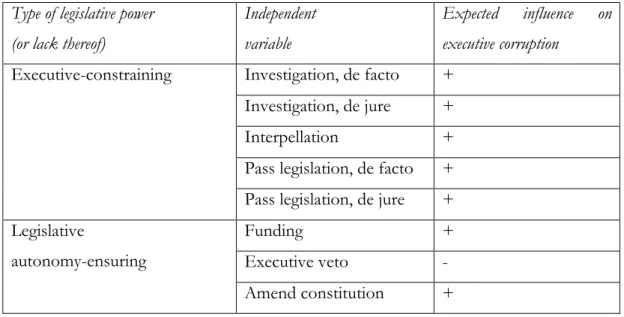
Table 1 summarizes our theoretical expectations for the relationship between each
legislative power indicator and executive corruption (we include only one column because our
expectations for the two dependent variables, executive bribery and corrupt exchanges and
executive embezzlement and theft, are identical).
6We bold the entries for de facto powers, as we
expect their relationship with the dependent variables to be stronger than with their de jure
counterparts.
5 Note that we recode the original V-Dem variable, which asks the following: Who has the power to approve/reject legislation once it has been passed by the legislature (not including reviews for constitutionality)? Our recode takes a value of one if the head of state, head of government, both head of state and head of government, or government/cabinet has this power.
6 Note that the V-Dem data includes a number of other indicators that also indicate legislative powers. As two examples, V-Dem includes one variable for whether the legislature’s approval is necessary to ratify treaties and one for whether the legislature’s approval is necessary to declare war. While each of these variables indicates a legislative power, we find only a tenuous theoretical connection with executive corruption. What is the mechanism that links the ability to ratify treaties or declare war to executive corruption? In approximating our three sets of legislative powers, therefore, we attempt to choose variables with a clear theoretical connection to executive corruption.
Table 1. Theoretical expectations for legislative power indicators
Type of legislative power
(or lack thereof)
Independent
variable
Expected influence on
executive corruption
Executive-constraining
Investigation, de facto
+
Investigation, de jure
+
Interpellation
+
Pass legislation, de facto
+
Pass legislation, de jure
+
Legislative
autonomy-ensuring
Funding
+
Executive veto
-
Amend constitution
+
Notes
: The final column indicates whether our theoretical expectation is of a positive (+) or
negative (-) relationship between the legislative power and dependent variable. Note that as the
dependent variables increase, their higher values indicate
less
corruption (an expected positive
relationship therefore means that we expect the presence of a legislative power to lower the level
of executive corruption). The bolded entries indicate that we expect a stronger relationship
between independent and dependent variables when considering the de facto, rather than de jure,
version of the legislative power.
Results
For this exploratory cross-sectional, time-series regression analysis, we examine the data
over the years 2000 to 2010.
7We subset the data to exclude microstates and we include only
countries with a population greater than 500,000 at the beginning of the time period of interest.
8To complement the V-Dem legislative powers, we introduce two control variables in our analysis.
These are the United Nations’ measure of logged gross domestic product per capita (GDP per
capita) and Ross’s (2013) measure of net oil exports per capita.
9The cross-national corruption
literature consistently finds these control variables to be significant.
10In the results that follow,
we lag all independent variables by one year and use Newey-West standard errors to address
concerns of heteroskedasticity and autocorrelation. Table 2 presents the regression results for our
first measure of executive corruption: executive bribery and corrupt exchanges.
7 We additionally run the analyses on a sample from 1990 to 2010, with similar results. We report the 2000-2010 sample here to avoid the issue of state disintegration in the early to mid-1990s (in the former Soviet Union and the former Yugoslavia, for example). The additional results are available from the authors by request.
8 Note that the 500,000 population cutoff allows us to exclude a number of countries that have missing data in V-Dem’s version three release of the data. These missing countries, some of which have populations less than one-half million, include: Bahamas, Bahrain, Barbados, Belize, East Timor, Equatorial Guinea, Fiji, Kuwait, Libya, Luxembourg, Malta, Oman, Papua New Guinea, Singapore, Solomon Islands, and United Arab Emirates. In addition to the countries missing V-Dem data, the 500,000 population cutoff forces us to exclude the following five states for which V-Dem does have data: Cape Verde, Iceland, Maldives, São Tomé and Príncipe, and Seychelles. We additionally exclude the following five cases due to indeterminate status or non-independence: Palestine-Gaza, Palestine-West Bank, Somaliland, Macau, and Hong Kong.
9 In an effort to ensure robust results, we replaced the United Nations measure of GDP per capita with a similar measure from, first, the World Bank and, second, V-Dem. We then replaced the GDP per capita variable with World Bank measures of life expectancy and fertility rates. The results were consistent in all cases.
10 We additionally ran the analysis with, first, the Freedom House organization’s political rights measure as a control variable (the data is available at https://freedomhouse.org/report-types/freedom-world#.VUY6y_lViko). Many authors argue that democracy reduces corruption (see, for instance, Lambsdorff 2005). We exclude these runs from the main text for two reasons. First, we worry about endogeneity, as one of the components of the political rights score (under “Functioning of Government”) asks the following: “Is the government free from pervasive corruption?” Second, we worry that the Freedom House measure may pick up a component of the legislature’s strength. We therefore exclude these runs from the main text due to both endogeneity and collinearity concerns. When we do include the political rights variable, it is highly significant across all runs, the coefficient is in the expected direction, and its inclusion knocks out the oil variable’s significance. In terms of legislative powers, only legislative investigation power (de facto) remains significant across both dependent variables. We also reran the analysis with the addition of British colony and/or British legal origin as control variables (La Porta, et al. 1999). A number of authors have argued that British influence leads to lower levels of corruption (Treisman 2000), though more recent studies tend to find no effect (Treisman 2007). While the coefficients are in the expected direction, we never find these variables to be significant. In terms of legislative power indicators, investigate (de facto), funding, and passing legislation (de facto) remain significant across both dependent variables. We include the additional runs with British colony in the appendix.
Table 2. Regression results for executive bribery and corrupt exchanges
Dependent variable: Executive Bribery and Corrupt Exchanges
(1)
(2)
(3)
(4)
(5)
(6)
(8)
(9)
Constant
-3.45
***-3.44
***-2.54
***-3.02
***-3.14
***-3.44
***-3.48
***-3.08
***(0.37) (0.37) (0.35) (0.40) (0.46) (0.41) (0.50) (0.37)
GDP per capita (ln) 0.42
***0.42
***0.29
***0.36
***0.42
***0.42
***0.44
***0.37
***(0.05) (0.05) (0.05) (0.05) (0.05) (0.05) (0.05) (0.05)
Oil exports, per capita -0.00
***-0.00
***-0.00
*-0.00
**-0.00
***-0.00
***-0.00
***-0.00
(0.00) (0.00) (0.00) (0.00) (0.00) (0.00) (0.00) (0.00)
No investigate (df)
0.44
***(0.09)
No investigate (dj)
0.02
(0.27)
Investigate (dj)
0.13
(0.16)
Interpellate
0.11
(0.16)
Pass leg (df)
-0.36
(0.13)
***Pass leg (dj)
-0.03
(0.33)
Funds
0.28
(0.11)
***No Veto
0.09
(0.26)
Veto
-0.24
(0.18)
Amend
0.24
(0.16)
Observations
1553 1565 1554 1553 1455 1553 1565 1521
Adjusted R
20.57 0.45 0.44 0.50 0.47 0.49 0.46 0.47
*p<0.1;
**p<0.05;
***p<0.01
Notes
: The dependent variable ranges in level of executive bribery and corrupt exchanges from
routine/expected (high level of corruption) to never/hardly ever (low level of corruption). A
positive coefficient indicates the amount corruption
decreases
for a one unit increase in the
independent variable (that is, due to the dichotomous nature of most independent variables,
when the power exists), while a negative coefficient indicates the amount corruption
increases
for a
one unit increase in the independent variable (again, when the power exists). The independent
variables de jure investigation and de jure passing legislation each take multiple levels—the
excluded level in both cases is the answer “not specified,” which we consider distinct from
missing data.
As expected, higher levels of economic development significantly correlate with lower
levels of executive bribery and corrupt exchanges in all models. The finding supports the widely
held view that poorer countries suffer from higher corruption. Moreover, a higher net oil export
level correlates with higher levels of executive bribery and corrupt exchanges and this result is
significant in all but one model. This finding conforms to expectations that oil-reliant countries
face especially daunting problems with corruption.
When we turn to legislative power indicators, we find three highly significant results.
First, for executive-constraining powers, we find that while the coefficients for both the power of
interpellation and de jure investigation are positive as expected, neither power is significant. But
the de facto power of investigation is highly significant and in the expected direction: For a
one-unit increase in the independent variable—that is, when we move from a legislature without the
power to investigate the executive in practice to a legislature with this power—we expect the
amount of executive bribery and corrupt acts to decrease, holding the other covariates constant.
Second, we find that the requirement that the legislature (or as stated in the survey, the lower
house of the legislature) participate in the passage of any legislation in practice is highly
significant and decreases the amount of executive bribery. Third, we find that the ability to
control the resources that finance the legislature’s internal operations, an autonomy-enhancing
power, is highly significant. When a legislature is in charge of its own funds, we expect a lower
amount of executive bribery. Of the remaining variables, all follow our directional theoretical
expectations except one: passing legislation de jure. This variable’s sign runs counter to our
intuition, but is not statistically significant.
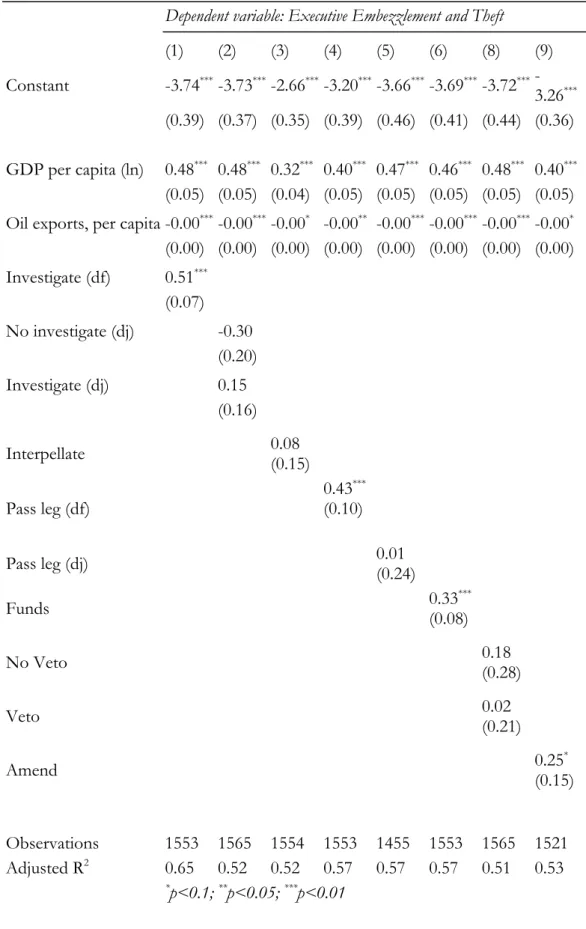
We see broadly similar results when we turn to our second measure of executive
corruption: executive embezzlement and theft. Importantly, each of our three legislative power
findings for executive bribery and corrupt acts remains significant and in the expected direction.
Table 3. Regression results for executive embezzlement and theft
Dependent variable: Executive Embezzlement and Theft
(1)
(2)
(3)
(4)
(5)
(6)
(8)
(9)
Constant
-3.74
***-3.73
***-2.66
***-3.20
***-3.66
***-3.69
***-3.72
***-3.26
***(0.39) (0.37) (0.35) (0.39) (0.46) (0.41) (0.44) (0.36)
GDP per capita (ln) 0.48
***0.48
***0.32
***0.40
***0.47
***0.46
***0.48
***0.40
***(0.05) (0.05) (0.04) (0.05) (0.05) (0.05) (0.05) (0.05)
Oil exports, per capita -0.00
***-0.00
***-0.00
*-0.00
**-0.00
***-0.00
***-0.00
***-0.00
*(0.00) (0.00) (0.00) (0.00) (0.00) (0.00) (0.00) (0.00)
Investigate (df)
0.51
***(0.07)
No investigate (dj)
-0.30
(0.20)
Investigate (dj)
0.15
(0.16)
Interpellate
0.08
(0.15)
Pass leg (df)
0.43
***(0.10)
Pass leg (dj)
0.01
(0.24)
Funds
0.33
(0.08)
***No Veto
0.18
(0.28)
Veto
0.02
(0.21)
Amend
0.25
(0.15)
*Observations
1553 1565 1554 1553 1455 1553 1565 1521
Adjusted R
20.65 0.52 0.52 0.57 0.57 0.57 0.51 0.53
*p<0.1;
**p<0.05;
***p<0.01
Notes
: The dependent variable ranges in level of executive embezzlement and theft from
routine/expected (high level of corruption) to never/hardly ever (low level of corruption). A
positive coefficient indicates the amount corruption
decreases
for a one unit increase in the
independent variable (that is, due to the dichotomous nature of most independent variables,
when the power exists), while a negative coefficient indicates the amount corruption increases for a
one unit increase in the independent variable (again, when the power exists). The independent
variables de jure investigation and de jure passing legislation each take multiple levels—the
excluded level in both cases is the answer “not specified,” which we consider distinct from
missing data.
In addition to our findings that correspond to those from Table 2, in Table 3 there are a
few small, but not statistically significant, differences. Namely, executive veto power switches to a
positive sign in this model, which runs counter to our expectations. Unlike the model reported in
Table 2, passing legislation de jure now conforms to our expected positive coefficient. More
importantly, there is one difference in terms of statistical significance. We find that the
legislature’s power to amend the constitution decreases the amount of executive embezzlement
and theft.
Legislative Corruption
While our exploratory analysis suggests that three legislative powers are important for
curbing executive corruption across both dependent variables, a skeptic may counter that while
these legislative powers help curb executive corruption, they may also increase the risk of legislative
corruption. Perhaps the members of more powerful legislatures will have more opportunities for
engaging in corrupt practices themselves. And, if these legislative powers turn out to have a net
effect of zero on the level of corruption since legislators are more corrupt, why focus on them at
all?
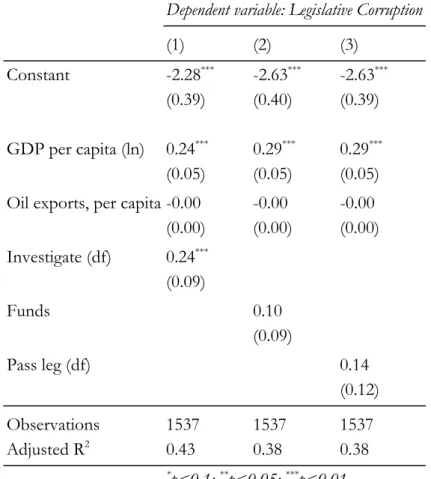
To assess the skeptic’s claim, we run three additional regressions on a different dependent
variable, also drawn from the V-Dem data: legislative corruption. This variable is as follows:
Legislative corruption: Do members of the legislature abuse their position for financial gain?
By “abusing their position,” this question includes corrupt activities such as accepting bribes,
helping personally-connected firms obtain government contracts, doing favors for firms in
exchange for future employment chances, or stealing money from the state or campaign
donations for personal use. Table 4 presents the regression results.
Table 4. Regression results for legislative corruption
Dependent variable: Legislative Corruption
(1)
(2)
(3)
Constant
-2.28
***-2.63
***-2.63
***(0.39)
(0.40)
(0.39)
GDP per capita (ln) 0.24
***0.29
***0.29
***(0.05)
(0.05)
(0.05)
Oil exports, per capita -0.00
-0.00
-0.00
(0.00)
(0.00)
(0.00)
Investigate (df)
0.24
***(0.09)
Funds
0.10
(0.09)
Pass leg (df)
0.14
(0.12)
Observations
1537
1537
1537
Adjusted R
20.43
0.38
0.38
*p<0.1;
**p<0.05;
***p<0.01
Notes: The dependent variable ranges in level of legislative corruption from commonly (high level
of corruption) to never/hardly ever (low level of corruption). A positive coefficient indicates a
decrease in corruption, while a negative coefficient indicates an increase in corruption.
From Table 4, we see that neither the power to control funding nor to pass legislation in
practice is a significant predictor of legislative corruption. The power to investigate the executive
in practice is, however, highly significant. When we examine the coefficient directions, though,
we see that all three variables have positive coefficients, meaning that their presence leads to a
decrease in legislative corruption. It therefore appears unlikely that these powers are resulting in a
net effect of zero, at least when considering legislative and executive corruption. In fact, the
legislature’s holding these powers may decrease corruption in both the executive and legislative
branches.
Conclusion
This paper utilizes new measures of corruption available from the V-Dem project to
assess executive corruption cross-nationally over the period 2000 to 2010. We focus on two types
of executive corruption—bribery and embezzlement—and find that three legislative powers curb
both types of executive corruption. A legislature with the ability to investigate the executive in
practice, control its own finances, or pass legislation in practice is able to impose more
constraints on the executive than does a legislature without these powers, and these powers help
deter the executive from committing corrupt acts.
Our findings enable us not only to ascertain whether rules that constrain the executive by
empowering the legislature reduce executive corruption, but also to assess which rules in particular
might have such an effect. The richness of the V-Dem data helps us test a variety of hypotheses
about specific institutions related to executive-legislative relations. As the findings show, some
powers seem to be of importance for controlling executive corruption while others are not. We
hope that the investigation will provide the basis for a more differentiated picture of how
legislatures may check corrupt practices in the executive.
Of course, our findings are based only on observational data and much additional work is
needed to replicate, validate, and check the robustness of these results.
References
Bardhan, Pranab. 1997. “Corruption and Development: A Review of Issues.” Journal of
Economic Literature, 35 (3): 1320-46.
Billger, Sherrilyn M. and Rajeev K. Goel. 2009. “Do Existing Corruption Levels Matter in
Controlling Corruption? Cross-Country Quantile Regression Estimates.” Journal of
Development Economics, 90 (2): 299-305.
Brown, David S., Michael Touchton, and Andrew Whitford. 2011. “Political Polarization as a
Constraint on Corruption: A Cross-National Comparison.” World Development, 39 (9): 1516-29.
Coppedge, Michael, John Gerring, David Altman, Michael Bernhard, Steven Fish, Allen Hicken,
Matthew Kroenig, Staffan I. Lindberg, Kelly McMann, Pamela Paxton, Holli A. Semetko,
Svend-Erik Skaaning, Jeffrey Staton, and Jan Teorell. 2011. “Conceptualizing and Measuring
Demcoracy: A New Approach.” Perspectives on Politics, 9 (2): 247-67.
Fish, M. Steven. 2005a. “Stronger Legislatures, Stronger Democracies.” Journal of Democracy,
17: 5-20.
Fish, M. Steven Fish. 2005b. “Democracy Derailed in Russia: The Failure of Open Politics”.
Cambridge: Cambridge University Press.
Huntington, Samuel P. 1968. “Political Order in Changing Societies”. New Haven, CT: Yale
University Press.
Karklins, R. 2002. “Typology of Post-Communist Corruption.” Problems of Post-Communism,
49 (4): 22-32.
Kaufmann, Daniel. 2005. “Back to Basics—10 Myths About Governance and Corruption.”
Finance and Development (International Monetary Fund), 42 (3).
Klitgaard, R. 1998. “International Cooperation Against Corruption.” Finance & Development, 35
(1): 3-6.
La Porta, Rafael, Florencio Lopez-de-Silanes, Andrei Shleifer, and Robert Vishny. 1999. “The
Quality of Government.” The Journal of Law, Economics, & Organization, 15 (1): 222-79.
Lambsdorff, Johann Graf. 2005. “Consequences and Causes of Corruption: What Do We Know
from a Cross-Section of Countries?” Working Paper, University of Passau.
Leff, Nathaniel H. 1964. “Economic Development through Bureaucratic Corruption.” American
Behavioral Scientist, 8 (3): 8-14.
Leys, Colin. 1965. “What is the Problem About Corruption?” The Journal of Modern African
Studies, 3 (2): 215-30.
Mauro, Paolo. 1995. “Corruption and Growth.” Quarterly Journal of Economics, 110 (3):
681-712.
Méon, Pierre-Guillaume and Khalid Sekkat. 2005. “Does Corruption Grease or Sand the Wheels
of Growth?” Public Choice, 122 (1/2): 69-97.
O’Donnell, Guillermo. 1999. “Counterpoints: Selected Essays on Authoritarianism and
Democratization”. Notre Dame, IN: University of Notre Dame Press, 185.
Pemstein, Daniel, Eitan Tzelgov, and Yi-Ting Wang. 2015. “Evaluating and Improving Item
Response Theory Models for Cross-National Expert Surveys.” Varieties of Democracy Institute:
Working Paper No. 1. March 2015.
Rose-Ackerman, Susan. 1999. “Corruption and Government: Causes, Consequences, and
Reform”. Cambridge: Cambridge University Press.
Rose-Ackerman, Susan. 2008. “Corruption,” in Charles K. Rowley and Friedrich G. Schneider,
eds., Readings in Public Choice and Constitutional Political Economy. New York, NY: Springer
Publishing, 551-66.
Ross, Michael. 2013. “Oil and Gas Data, 1932-2011.” Harvard Dataverse Network. Available at
http://hdl.handle.net/1902.1/20369 UNF:5:dc22RlDasveOTAJvwIjBTA== V2.
Svensson, J. 2005. “Eight Questions about Corruption.” Journal of Economic Perspectives, 19
(3): 19-42.
Treisman, Daniel. 2000. “The Causes of Corruption: A Cross-National Study.” Journal of Public
Economics, 76 (3): 399-457.
Treisman, Daniel. 2007. “What Have We Learned About the Causes of Corruption from Ten
Years of Cross-National Empirical Research?” Annual Review of Political Science, 10: 211 44.
United Nations. 2004. “UN Anti-Corruption Toolkit.” Office on Drugs and Crime. Accessed
online at
http://www.unodc.org/pdf/crime/corruption/toolkit/corruption_un_anti_corruption_toolkit_s
ep04.pdf
Appendix: Additional Regression Results
Controlling for British colony
Dependent variable: Executive Bribery and Corrupt Exchanges
(1)
(2)
(3)
(4)
(5)
(6)
(8)
(9)
Constant
-3.61
***-3.50
***-2.55
***-3.05
***-3.18
***-3.48
***-3.52
***-3.11
***(0.38) (0.38) (0.35) (0.40) (0.45) (0.41) (0.50) (0.38)
GDP per capita (ln) 0.42
***0.42
***0.29
***0.36
***0.42
***0.42
***0.44
***0.37
***(0.05) (0.05) (0.05) (0.05) (0.05) (0.05) (0.05) (0.05)
Oil exports, per capita -0.00
***-0.00
***-0.00
*-0.00
**-0.00
**-0.00
***-0.00
***-0.00
(0.00) (0.00) (0.00) (0.00) (0.00) (0.00) (0.00) (0.00)
British Colony
0.25 0.15 0.02 0.16 0.15 0.13 0.16 0.11
(0.23) (0.17) (0.14) (0.17) (0.17) (0.17) (0.17) (0.16)
Interpellate
0.23
(0.20)
No investigate (dj)
0.07
(0.28)
Investigate (dj)
0.15
(0.16)
Investigate (df)
0.44
***(0.09)
Funds
0.29
***(0.11)
No Veto
0.10
(0.27)
Veto
-0.26
(0.18)
Amend
0.23
(0.16)
Pass leg (dj)
-0.04
(0.32)
Pass leg (df)
0.36
***(0.13)
Observations
1554 1565 1553 1553 1565 1521 1455 1553
Adjusted R
20.45 0.45 0.57 0.50 0.46 0.47 0.47 0.50
*p<0.1;
**p<0.05;
***p<0.01
Dependent variable: Executive Embezzlement and Theft
(1)
(2)
(3)
(4)
(5)
(6)
(8)
(9)
Constant
-3.82
***-3.73
***-2.61
***-3.21
***-3.66
***-3.69
***-3.74
***-3.26
***(0.40) (0.37) (0.34) (0.40) (0.45) (0.41) (0.45) (0.37)
GDP per capita (ln) 0.48
***0.48
***0.32
***0.40
***0.47
***0.46
***0.48
***0.40
***(0.05) (0.05) (0.04) (0.05) (0.05) (0.05) (0.05) (0.05)
Oil exports, per capita -0.00
***-0.00
***-0.00
*-0.00
**-0.00
***-0.00
***-0.00
***-0.00
*(0.00) (0.00) (0.00) (0.00) (0.00) (0.00) (0.00) (0.00)
British Colony
0.11 0.01 -0.11 0.06 0.02 0.03 0.07 -0.00
(0.22) (0.20) (0.16) (0.19) (0.19) (0.19) (0.19) (0.18)
Interpellate
0.13
(0.18)
No investigate (dj)
-0.30
(0.21)
Investigate (dj)
0.15
(0.16)
Investigate (df)
0.52
***(0.07)
Funds
0.33
***(0.08)
No Veto
0.18
(0.28)
Veto
0.02
(0.21)
Amend
0.25
*(0.15)
Pass leg (dj)
0.01
(0.24)
Pass leg (df)
0.43
***(0.10)
Observations
1554 1565 1553 1553 1565 1521 1455 1553
Adjusted R
20.52 0.52 0.66 0.56 0.51 0.53 0.52 0.57
*p<0.1;
**p<0.05;
***p<0.01