San Jose State University
SJSU ScholarWorks
Master's Projects Master's Theses and Graduate Research
Spring 5-15-2015
SocioBot: Twitter for Command and Control of a
Botnet
Ismeet Kaur Makkar
San Jose State University
Follow this and additional works at:https://scholarworks.sjsu.edu/etd_projects Part of theComputer Sciences Commons
This Master's Project is brought to you for free and open access by the Master's Theses and Graduate Research at SJSU ScholarWorks. It has been accepted for inclusion in Master's Projects by an authorized administrator of SJSU ScholarWorks. For more information, please contact
Recommended Citation
Makkar, Ismeet Kaur, "SocioBot: Twitter for Command and Control of a Botnet" (2015).Master's Projects. 392. DOI: https://doi.org/10.31979/etd.cum2-f3fm
SocioBot: Twitter for Command and Control of a Botnet
A Project Presented to
The Faculty of the Department of Computer Science San Jose State University
In Partial Fulfillment
of the Requirements for the Degree Master of Science
by
Ismeet Kaur Makkar May 2015
c ○2015 Ismeet Kaur Makkar ALL RIGHTS RESERVED
The Designated Project Committee Approves the Project Titled
SocioBot: Twitter for Command and Control of a Botnet
by
Ismeet Kaur Makkar
APPROVED FOR THE DEPARTMENTS OF COMPUTER SCIENCE
SAN JOSE STATE UNIVERSITY
May 2015
Dr. Mark Stamp Department of Computer Science Dr. Thomas Austin Department of Computer Science Fabio Di Troia Università del Sannio
ABSTRACT
SocioBot: Twitter for Command and Control of a Botnet by Ismeet Kaur Makkar
A botnet is a collection of computers controlled by a botmaster, often used for malicious activity. Social network provides an ideal medium for botnets to spread their reach. In this research, we develop and analyze a botnet that uses Twitter for its command and control channel. We use this botnet to perform a distributed denial of service attack on a web server, and we utilize the biological epidemic models to analyze the spread of the botnet using Twitter.
ACKNOWLEDGMENTS
I am very thankful to my advisor Dr. Mark Stamp for his continuous guidance and support throughout this project and believing in me. I would also like to thank the committee members, Dr. Thomas Austin and Fabio Di Troia, for monitoring the progress of the project and their valuable time. Lastly I would like to thank my husband for being a constant support pillar.
TABLE OF CONTENTS CHAPTER 1 Introduction . . . 1 2 Background . . . 3 2.1 Social Networks . . . 3 2.2 Bots . . . 4
2.2.1 How Bots Work . . . 5
2.2.2 Command and Control . . . 5
2.2.3 Spreading the Infection . . . 7
2.2.4 Communication Protocol . . . 8 2.2.5 Trigger Event . . . 8 2.2.6 Functionality . . . 9 2.3 Network Simulator . . . 9 2.3.1 Spamulator . . . 9 2.3.2 Docker . . . 11 3 Epidemic Models . . . 17 3.1 SIR Model . . . 18 3.2 SEIR Model . . . 21
3.3 Basic Reproduction Number . . . 22
4 Experiments . . . 24
4.1 Attack Scenario . . . 25
4.2.1 Simple Model (SIR) . . . 28
4.2.2 SEIR Model . . . 33
4.2.3 SEIR Model for Twitter . . . 34
4.3 Analysis: Spreading a tweet . . . 36
4.3.1 Basic Reproduction Number . . . 39
4.3.2 Defensive Strategies . . . 42
4.4 Simulating the spread of Code-Red worm . . . 43
LIST OF TABLES
LIST OF FIGURES
1 Architecture of Spamulator [6] . . . 11
2 Architecture of Docker [14] . . . 12
3 SIR Model flow diagram . . . 19
4 SEIR Model flow diagram . . . 21
5 Spread of botnet using Twitter . . . 26
6 DDoS attack using the botnet . . . 27
7 Fraction of the infected users with time . . . 29
8 Number of Infected Users over time with no recovery (SI Model) . 30 9 Number of Infected and Susceptible Users over time for different values of probability of infection (SI Model) . . . 30
10 SIR Model with Susceptible,Infected and Recovered Users . . . . 31
11 SIR model with 𝛽= 0.4and 𝛾 = 0.3 . . . 32
12 SIR model with 𝑁 = 50, infection rate = 0.5 and recovery rate = 1 32 13 Number of Susceptible,Exposed, Infected and Recovered Users over time with infection rate=0.5 and recovery rate=0.5 (SEIR Model) 33 14 SEIR model for the spread of botnet over Twitter . . . 35
15 Spread of the botnet over Twitter with 𝑛= 100 and 𝑝= 0.5 . . . 35
16 Spread of the botnet over Twitter with 𝑛= 50 and 𝑝= 0.3 . . . . 36
17 Spread of a Tweet over social network . . . 37
18 Spread of Tweets with 𝑛= 100 and 𝑝= 0.5. . . 37
19 Spread of Tweets with 𝑛= 50 and 𝑝= 0.3 . . . 38 20 Comparative spread of Tweets for𝑛= 70 with 𝑝= 0.3and 𝑝= 0.5 38
21 Basic Reproduction Number as a function of number of followers and click probability . . . 40 22 Effect of recovery rate on Basic Reproduction Number . . . 40 23 Simulation showing the effect of click probability and number of
followers in a network . . . 41 24 Effect of click probability and number of followers on the number
of infected users . . . 42 25 SI model simulation for spread of Code Redv2 worm . . . 44 26 SIR model simulation for spread of Code Redv2 worm . . . 45
CHAPTER 1 Introduction
Today, the Internet is become a major source of information and is used to provide a variety of services to users through out the world. The Internet has trans-formed telephone and television services, the traditional communication medium, with services like Voice over Internet Protocol (VoIP) and Internet Protocol Televi-sion (IPTV). Web blogs, e-papers and news feeds are being used widely instead of traditional books, newspaper and published materials. Online music and gaming are one of the most used segments on Internet, while online shopping and e-commerce have revolutionized the way people spend money. The Internet has also brought people together through online forums, messaging and social networking.
The growing number of devices connected to the Internet has resulted in an ever increasing threat to users. Some users on the Internet thrive on tricking users into downloading some application on the device which may be capable of performing malicious actions. These software applications are known as malware and can be a form of worm, virus, spyware, trojan horse, etc.
Devices that utilize the Internet are often not well protected against malware and hence attackers can use these devices to perform a variety of attacks, including distributed denial of service and spamming. One such attack occurred recently when smart refrigerators were used to spam hundreds of thousands of user accounts world-wide [19]. In another incident the blogging website WordPress was attacked by a large botnet [39]. In yet another recent case, Bitcoin users were warned by security experts to change passwords and encrypt their Bitcoin wallets after a version of the
Pony Botnet hacked Bitcoin [29].
A bot is an application program installed on a user’s machine executing auto-mated tasks [10]. A botnet is a collection of bot computers controlled by a botmaster, which is often used for malicious purposes. Users collaborate and are encouraged to share information on the social networks in the form of multimedia and personal texts on their profiles. A portion of these posts come from users who exploit the social network connections to extend their malicious activities like spamming [4, 35]. Thus social media provides an ideal medium for botnets to spread their reach. In this research, we develop a botnet that uses Twitter for its command and control system. This is an enhancement of the botnet that was previously developed [33]. Epidemic models have been used by mathematicians to analyze the spread of a biological dis-ease. Since the spread of malware on a network shares many similar characteristics with the spread of disease, we use epidemic models to analyze the spread of our botnet on a simulated social network.
This paper is organized into the following sections. Chapter 2 provides back-ground information about social networks and bots. We also discuss two network simulators which were explored for simulation of the botnet. Chapter 3 outlines var-ious epidemic models used by mathematicians to model the spread of diseases. This is followed by Chapter 4 where we discuss our experiments. This incorporates the details of the bot application, the attack done to spread the botnet followed by the analysis of the simulations. Chapter 5 closes the paper with conclusion and future work.
CHAPTER 2 Background
2.1 Social Networks
Social media has penetrated and altered the way people interact and commu-nicate. More than 70% of users on the Internet are using social networking [1, 34]. It has become the dominant method of using the Internet. We have more access to news and opinions than ever before because of social networking. It is very common to hear someone to share their opinion on Facebook, or to receive breaking news all over the world via Twitter. People all over the world share images with each other via Instagram, Flickr and other photo sharing sites. Linkedin is used by professionals the world over for job searching and connections. Facebook has more than a billion user accounts and Twitter has more than 500 million user accounts among other social networking sites.
Twitter is among the most popular and fastest growing social networking sites being used globally [1]. Users on Twitter can post messages that are limited to 140 characters. These posts are called “tweets”. Users can follow other users they find interesting and tweets from anyone a user has followed will appear on the user’s home page. Twitter is different from many social networks in a way that the relationship between two users need not be mutual. This means that if a user A follows a user B on Twitter, B has no obligation to follow A back. Twitter provides a medium for users to share short pieces of text along with sharing other types of media like images and hyperlink.
be-cause of some intrinsic properties. Some of these properties are:
1. a large and highly distributed user base from different countries
2. groups of users who share the same social interests or views, develop trust with each other, and seek access to the common resources, and
3. platform for distributing malicious resources and applications which bait users to install them on their system.
Social networks are a powerful tool for connecting with users all over the world but also create a threat. This is because they can easily be exploited to carry out malicious activities.
2.2 Bots
A botnet is a collection of commands, scripts, or a simple executable applications that can connect a large number of computers or devices to a central command center which is usually a server. The command center, also called a botmaster, is used to control the bots [10]. These bots execute the commands from the botmaster that may be harmless or malicious. Since a bot infected machine does the botmaster’s bidding the victim machines are referred to as “zombies”. The malicious activities may be as simple as executing code on a machine or as harmful as stealing personal information, source code from company resources, or interrupting the services. Botnets pose a high risk, yet silent, threat to Internet [8, 9]. There are several important aspects of botnets including command and control structure, infection method, communication protocol, trigger events, and functionality [7]. We will discuss each of these briefly in the following sections.
2.2.1 How Bots Work
Bots can reach a user computer or device in many ways. Bots often spread themselves across the Internet by searching for vulnerable, unprotected computers to infect. When they find an exposed computer, they quickly infect the machine and then report back to the botmaster. The goal of a bot is to stay hidden until it is instructed to carry out a task [7].
After a computer is taken over by a bot, it can be used to carry out a variety of automated tasks. Some of the tasks may be harmless like sending spam emails or social posts while it may also be performing malicious activities like sending spyware, trojan or virus files [33]. The bot can be used for stealing personal and private infor-mation and communicating it back to the botmaster. The malicious user inforinfor-mation may be credit card numbers, bank credentials, and other sensitive personal infor-mation. It can also be employed for launching distributed denial of service (DDoS) attacks against a specified target. Cybercriminals can extort money from Website owners, in exchange for regaining control of the compromised sites. However, more commonly everyday user machines are the targets of these attacks. The bot can also be used for clickfraud. This means that fallacious users employ bots to boost revenue from Web advertising by automatically clicking on the ads on Internet [8].
2.2.2 Command and Control
The command and control structure of a botnet is the way it receives com-mands and updates to functionality, how it transmits data, and how communication is handled between the botmaster and the victim machines, or bots, that make up the botnet. The Command and Control, or C&C, constitutes the interface between the botmaster and botnet. The botmaster commands the C&C, and the C&C
com-mands the bots. Botnets can be typically organized into a centralized structure with a central C&C server, a P2P or peer-to-peer structure where peers are used as com-mand and control channel, or a combination of the two which is referred to as hybrid structure [33].
A centralized structure involves the bots receiving commands from the central server and in turn transmitting data to it. This can be a server that the botnet has compromised and can access securely, without leaving any traces of identity or can be a new server set by the botmaster. The central server can actually change frequently, and there can be multiple servers used throughout the life of the botnet. The ability to have multiple central servers is important in case any of the servers are detected and brought down by malware researchers or law enforcement agencies.
Botnets have been controlled traditionally using Internet Relay Chat (IRC) [23]. The IRC framework has the advantage of simplicity, flexibility, and ease of admin-istration. IRC is easy to modify for any specific purpose because it is a ubiquitous communications standard on the internet. The Bot application is designed to connect the victim machine to an IRC server and take commands from the control channel. The botmaster can utilize existing chat services and networks, or can implement a control server by installing an IRC daemon on a compromised machine. Some exam-ples of IRC-based botnets are SpyBot [7], AgoBot, GTBot [7], and SDBot [22].
The traditional centralized structure has given way to peer-to-peer structure. Botnets such as Nugache in 2006 or Storm in 2007 used P2P methods for command and control [9]. P2P methods involve message communication between the bots rather than to and from a centralized server. Any one bot in the P2P structure botnet can be used as a command and control server by the botmaster, using it for message propagation to other bots via P2P [13].
A hybrid structure can be formed by combining both the structures taking some elements from centralized and P2P structure each. This type of botnet might consist of bots that communicate with each other via P2P, but use a centralized server to receive commands and transmit data. The hybrid structure can change within groups of bots, each group using different servers. This type of structure is highly flexible and resistant to interference with the servers as groups of bots can continue to operate and control even if several servers are taken down. [38] proposes a hybrid botnet but no real life examples of hybrid botnet have been found according to the authors yet. Social networks make for a new type of command and control. These bots are called social zombies and controlled using social network channels [30]. The wide spread use of social networks makes an ideal medium for the spread of the botnet and using them as a platform for malicious activities. There are multiple bots that have been developed as proof of concept using social networks. A lot of researchers have built malware and botnets which use Twitter as a command and control mechanism for the spread [18, 28] and [5] exploits Facebook users to spread a botnet.
2.2.3 Spreading the Infection
There are several factors which determine the probability of infection, most of which work by exploiting the host machine for any vulnerability it might have. Some users, unfortunately, run old, unsecured versions of application software and operat-ing system which can be an easy target for infection. Accordoperat-ing to [8] infections are spread primarily through browser exploits, malicious email attachments, operating system vulnerabilities followed by files downloaded on the Internet. A powerful in-fection method these days is sending a link to a victim through email, or embedding a link in social networking sites which when clicked will re-direct the victim to a
malicious website that exploits the vulnerability in the browser to install bot on a victim computer. Malicious email attachments which was the older method of mal-ware distribution, can be substituted with a macro virus or an executable masked as an image of music file. A Trojan can be an application that a user is familiar with but has been altered to perform some malicious operations.
2.2.4 Communication Protocol
The communication protocol refers to the method used by a botnet to transmit and receive data between bots or between bots and server. This can be done using the IRC protocol, or Internet Relay Chat. A botmaster can set up a secure channel on an IRC server and receive commands. Another protocol that can be used is HTTP–any communication using this protocol will look like normal web traffic. Some botnets have used instant messaging protocols and P2P protocols for P2P structured botnets. During the last couple of years botnets are using social networking protocols such as Twitter and Facebook for command and control [40].
2.2.5 Trigger Event
A trigger event is something that causes the bot or malware to be active and exhibit it’s malicious functionality. The trigger can be anything like some time in the day or a particular date to begin a spamming or DDoS attack. Having a scheduled time, especially night, may be advantageous for the botnet to avoid detection and be active. This may be the case when the bot waits until night time to begin taking action and hide heavy network activity. Another trigger mechanism can be some user action like opening a banking site or financial software which can activate the keylogging software. Most of the botnets like Agobot, Spybot, and GTBot, use commands from
botmaster to perform specific actions.
2.2.6 Functionality
A botnet’s functionality refers to all activity a botnet has been programmed to perform when commanded by the botmaster. These botmasters are typically orga-nized criminal elements or fraudulent businesses. A botnet’s functionality mainly consists of activities such as spamming, stealing financial data, encrypting the sys-tem drive and distributed denial of service (DDoS) attacks. The botnet may also be programmed to include functionality like click fraud in which bots are used to visit websites that gain advertising revenue from ad clicks, or spamdexing where bots post spam messages to blogs and other sites that allow commenting. Agobot and Spybot [7] both have scanning capabilities, can control victim machines and perform DDoS attacks. The Storm botnet [8] is mainly used for spreading spam.
2.3 Network Simulator
We cannot work on the actual social network because of security concerns so we needed to simulate the network. Network simulators are software applications which model the behavior of the actual network using statistics and other mathematical formulas. There are multiple network simulators available in academia and the cor-porate world. We analyzed one in each to test the tools around what we want to do.
2.3.1 Spamulator
John Aycock, Heather Crawford, and Rennie deGraaf developed an Internet sim-ulator: the Spamulator [6] for teaching a course on spam and spy ware. The
Spa-mulator is a lightweight network siSpa-mulator that runs on a single machine. We know that the Internet is a complicated thing and we cannot simulate the entire network. Spamulator just simulates the parts of the Internet which are necessary for sending spam. The package implements a limited set of features of the Internet like Network Routing Daemon for Transport Control Protocol (TCP) and Domain Name Server (DNS) for simulated servers.
The Spamulator is designed such a way that it simulates the Internet with mil-lions of domains, works with simple Internet applications, functions under very heavy use, and can be extended for other projects and research. The Spamulator does not require any physical hardware requirements as it can run on a single machine. The Spamulator is a loop back network simulator, the components of which run on a single computer device. The architecture of the Spamulator can be illustrated using Figure 1.
The Spamulator works as follows: The network packets that originate from a client program and are destined to a simulated server are redirected to a locally maintained queue. These packets on the queue are read by Spamulator’s core, the Loop Back Network Simulator (LNS). This reroutes the packet to the local simulated server. The traffic from the simulated server returned to the client program is handled in a similar manner. Spamulator does not touch the network traffic not destined to a simulated IP address.
The Spamulator, other than rerouting packets, searches for and launches the simulated servers. It also keeps track of all the open connections, obtains domain name information from a local DNS for the simulated servers, forwards all packets between a server and a client, and performs clean up when a server finishes the work and ceases to exist. It thus acts as the backbone of the simulation. The Network
Figure 1: Architecture of Spamulator [6]
Interface Card (NIC) on the system must be available and active while executing the tool because Spamulator uses the NIC to send and receive packets. This is the hardware limitation of using Spamulator.
2.3.2 Docker
Docker, a container based virtualization framework, is fast, lightweight and easy to use unlike traditional virtualization frameworks [14]. It hosts the applications separating them from the infrastructure, which is treated like a managed hosted application. Docker allows you to make containers that can hold all the dependencies for an application. Every container is independent and insulated from any other making sure that nothing gets shared. Docker has powerful APIs which makes it a lightweight framework with the capability to provide a lifecycle for developing and
deploying applications into the containers.
Docker provides a way to execute and test almost any kind of application securely detached in a container. This security and execution in isolation permits the user to run multiple containers concurrently on the host. This simultaneous running of multiple containers means that the user can get more value out of hardware.
Docker is composed of two major components:
1. Docker which is the open source virtualization platform, and
2. Docker Hub which is a Software-as-a-Service platform provided by Docker for sharing and managing the containers.
The core architecture of Docker is client-server. Figure 2 shows a basic architec-ture of Docker.
A Docker daemon is responsible for the heavy work of making, running the con-tainers, and distributing them. The user interacts with the Docker daemon through the Docker client and not directly. The Docker client is the user facing interface and is in a form of the Docker binary. It takes user commands and communicates to and from with a Docker daemon. The Docker daemon and client both can interact running on the same system, or by connecting a Docker client to a remote Docker daemon. The Docker daemon and client transmits messages by using sockets or RESTful APIs.
Docker has three internal major parts:
1. Docker containers, 2. Docker images, and 3. Docker registries
We will discuss these parts in detail next.
2.3.2.1 Docker containers
Docker containers resemble a directory containing all the components needed for an application to run and function properly. This means including operating system, metadata and user files. A Docker image is used to create a new container each time. Docker containers can be executed, initiated, terminated, moved to another and deleted. Every container is a quarantined and secure application platform.
2.3.2.2 Docker images
We need templates to create Docker container. These templates are called Docker images. An example would be an Ubuntu operating system installed with Apache
and a user application. Docker images are used to launch the containers. Docker lets the user build new images or update the images already created. Each image is made of a series of layers. Docker combines the different layers into a single image using the union file systems. A Union file system is compromised of files and directories from separate file systems transparently overlaid to form a single consistent file system.
Docker images are built from base images using the set of instructions where each instruction is responsible for creating a new layer in the image. A special file called Dockerfile stores all these instructions. The instructions can include actions such as:
1. Executing a command 2. Adding file or folder
3. Creating an environment variable
4. Deciding the processes to execute when launching a container from the image.
This Dockerfile is read when a request for building an image is encountered, the instructions are executed, and a final image is returned.
2.3.2.3 Docker Registries
Docker registries are special folders that hold images. These folders can be private or public where images can be uploaded to or downloaded from. The images can be user created or re-used previously created from other users. The images in the public storage registry are searchable and can be accessed and downloaded by anybody, whereas the images in private storage are excluded from search results. These images can be pulled down and used by only the users with access to build containers. Docker
registries permits the user to build simple, yet powerful work flows for development and deployment.
2.3.2.4 Running a Docker container
The Docker client commands the Docker daemon to run a container using Docker binary or API by executing the following instruction:
$ sudo docker run -i -t ubuntu /bin/bash
Let us analyze when Docker does this command is executed step by step.
1. The Ubuntu image is pulled up. Docker ensures the presence of the Ubuntu operating system image. If the image is not found locally on the host, it is downloaded from Docker Hub. If the image exists, Docker uses it to create a new container.
2. A new container is created as soon as Docker has the image.
3. A filesystem is allocated for the creation of a container and a read-write layer is mounted and added to the image.
4. A network-bridge interface is created that allows the Docker container to com-municate with the local host.
5. An IP address, available from pool, is found and allocated. 6. The user specific application and processes are executed, and;
7. The standard input, output and errors are collected and logged for the user to observer the running application.
The container runs as an independent machine running the application. We can concurrently run as many instances of Docker container as the host machine supports. We could run 1000 containers simultaneously on a 4GB RAM Intel i5 Lubuntu machine.
CHAPTER 3 Epidemic Models
Researchers have been trying to understand the propagation of malicious software over the Internet [20, 31, 40]. The researchers in the network security have been trying to make use of mathematical epidemic models for the same [2, 16]. An epidemic model is used for describing the transmission of contagious diseases among people. Infectious diseases modeling is used to study the way diseases spread in order to predict the course of an outbreak in the future and to come up with strategies to control the outbreak [11, 12]. Today various computer softwares are available which model the behavior of disease outbreaks very closely to the epidemic records.
There are two types of epidemic models, Stochastic and Deterministic.
Stochastic means random. A stochastic model allows randomization in one or more input values over a range of time for estimating probability distributions of possible effects. The results of these models depend on minor variations in the vari-ables that determine the propagation of illness like a risk of exposure to disease, etc. These minor variations may change the results dramatically in small populations where stochastic models are mostly used. Stochastic models can be formulated using Markov chains, continuous and discreet, or stochastic differential equations. These models are different in the way time and state variables are assumed. The determin-istic models SIR and SIS are used as basis of formulation of stochastic models [3].
Deterministic models are usually used when a large population, like in case of tuberculosis, is involved. These models are based on mathematical representation where each variable changes according to a given mathematical formula, and not
due to random variations. They are also called compartmental mathematical models because every single person in the population is put in a different compartment or subgroup. These compartments represent a specific stage of the epidemic like sus-ceptible, infectious, recovered, etc which are denoted using letters 𝑆, 𝐼, and 𝑅 [11]. Individuals in the population transition from one compartment to another with re-spect to time which is expressed in the form of transition rate using derivatives. Thus deterministic models are developed using differential equations.
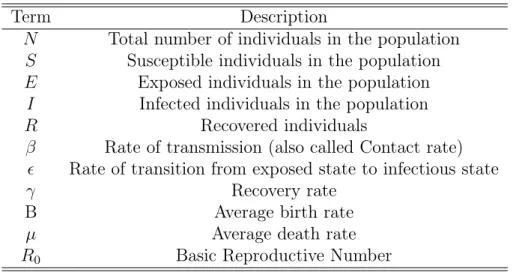
We will discuss some deterministic models in the next section. Table 1 outlines the common terminology used when discussing these models.
Table 1: Terms used in Epidemic Models
Term Description
𝑁 Total number of individuals in the population
𝑆 Susceptible individuals in the population
𝐸 Exposed individuals in the population
𝐼 Infected individuals in the population
𝑅 Recovered individuals
𝛽 Rate of transmission (also called Contact rate)
𝜖 Rate of transition from exposed state to infectious state
𝛾 Recovery rate
B Average birth rate
𝜇 Average death rate
𝑅0 Basic Reproductive Number
3.1 SIR Model
Kermack and McKendrick created the first epidemic model where a fixed popula-tion is assumed with three compartments [24]. These are Susceptible, 𝑆(𝑡), Infected,
𝐼(𝑡), and Removed, 𝑅(𝑡). A brief description of the compartments is as follows:
been infected with the disease and are susceptible. 𝐼(𝑡) represents the number of in-dividuals at time t who are infected with the disease and are responsible for spreading the disease to individuals in the susceptible subgroup. 𝑅(𝑡)represents the individuals who were infected and have recovered from the disease either by immunization or by death. The recovered individuals cannot get infected again.
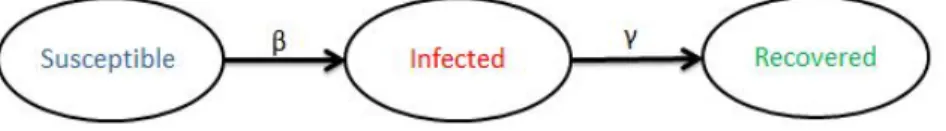
The transition in the SIR model can be understood using Figure 3
Figure 3: SIR Model flow diagram
Considering a fixed population at any given time, 𝑁 = 𝑆(𝑡) +𝐼(𝑡) +𝑅(𝑡), the model can be represented using the equations
𝑑𝑆 𝑑𝑡 =− 𝛽𝑆𝐼 𝑁 𝑑𝐼 𝑑𝑡 = 𝛽𝑆𝐼 𝑁 −𝛾𝐼 𝑑𝑅 𝑑𝑡 =𝛾𝐼
This model considers that no individuals are born or dead during the time period. There are multiple variants of the model some of which incorporate births and deaths during the model execution.
Like in the recent outbreak of Ebola [26] where a huge number of individuals died due to the disease, it becomes important to include births and deaths in the model. Assuming an equal birth rate and death rate,𝜇, the model can be represented by the following differential equations
𝑑𝑆 𝑑𝑡 =− 𝛽𝑆𝐼 𝑁 +𝜇(𝑁 −𝑆) 𝑑𝐼 𝑑𝑡 = 𝛽𝑆𝐼 𝑁 −𝛾𝐼−𝜇𝐼 𝑑𝑅 𝑑𝑡 =𝛾𝐼 −𝜇𝑅
Another variant of SIR model is SIS model where the individuals do not develop any immunity on recovery and thus become susceptible to infection again [3]. Infec-tions like cold flu and influenza come under this category. It can be expresses using the following equations
𝑑𝑆 𝑑𝑡 =− 𝛽𝑆𝐼 𝑁 +𝜇(𝑁 −𝑆) +𝛾𝐼 𝑑𝐼 𝑑𝑡 = 𝛽𝑆𝐼 𝑁 −𝛾𝐼−𝜇𝐼
People recover from an infection and develop immunity for the disease. For some diseases this immunity can be short-lived. Considering f as the average rate of immunity loss, SIR model can be extended to SIRS model where individuals from the recovered group rejoin the susceptible group after loss of immunity [41]. It can be expressed as 𝑑𝑆 𝑑𝑡 =− 𝛽𝑆𝐼 𝑁 +𝜇(𝑁 −𝑆) +𝑓 𝑅 𝑑𝐼 𝑑𝑡 = 𝛽𝑆𝐼 𝑁 −𝛾𝐼−𝜇𝐼 𝑑𝑅 𝑑𝑡 =𝛾𝐼−𝜇𝑅−𝑓 𝑅
3.2 SEIR Model
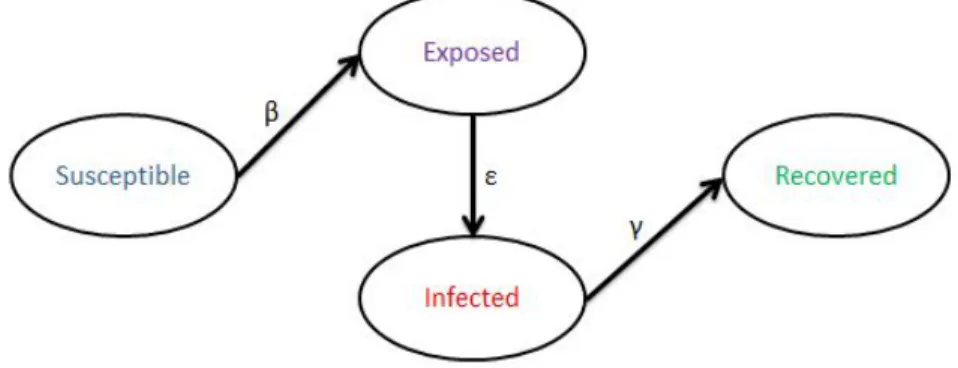
When we talk of SIR model we consider diseases that make a person contagious immediately after infection, i.e. the person starts spreading the infection at once. This is not always the case. There are many diseases, like HIV/AIDS, SARS, Ebola, where an individual gets infected but is not infectious for some time. This time is called latent period and the state is called Exposed state. It is a state where an individual is infected but cannot spread the infection to others.
This model, called SEIR [25], divides the total population, N into four compart-ments - susceptible, exposed, infectious, and recovered, such that𝑁 =𝑆(𝑡) +𝐸(𝑡) +
𝐼(𝑡) +𝑅(𝑡). The basic flow can be understood using Figure 4.
Figure 4: SEIR Model flow diagram
𝑑𝑆 𝑑𝑡 =− 𝛽𝑆𝐼 𝑁 𝑑𝐸 𝑑𝑡 = 𝛽𝑆𝐼 𝑁 −𝜀𝐸 𝑑𝐼 𝑑𝑡 = 𝜀𝐸 𝑁 −𝛾𝐼 𝑑𝑅 𝑑𝑡 =𝛾𝐼
Similar to the SIS model where the recovered individuals become susceptible immediately after recovering from the infection we have SEIS model. This is a variant of SEIR model expressed using the following differential equations considering births and deaths: 𝑑𝑆 𝑑𝑡 =𝐵− 𝛽𝑆𝐼 𝑁 −𝜇𝑆 +𝛾𝐼 𝑑𝐸 𝑑𝑡 = 𝛽𝑆𝐼 𝑁 −(𝜖+𝜇)𝐸 𝑑𝐼 𝑑𝑡 =𝜀𝐸−(𝛾+𝜇)𝐼
There are other variants which consider individuals with passive immunity (𝑀), children born with immunity from mother, or innate immunity. The SEIR model is extended to include more compartments based on the additional parameters being considered. Example models include MSIR, and MSEIR.
3.3 Basic Reproduction Number
When modeling the epidemics it is important to ascertain the severity of the disease. This is done using Basic Reproduction Number (𝑅0). It is also called basic
reproductive ratio and it determines if the disease causes an epidemic or dies out [21]. It is the number of secondary infections generated on average by a single infectious individual during its infectious period given a completely susceptible population.
This quantity is usually calculated by solving the model differential equations, which is a fairly lengthy process. A simple way to determine𝑅0 is using the
transmis-sion rate𝛽, recovery rate𝛾and total population size N. The number of new infections by an infected individual is 𝛽 N per unit time. Thus the basic reproduction number is given by
𝑅0 = 𝛽𝑁
𝛾
The transmission potential of a disease is determined by Basic Reproduction Number. A disease will die out in the population when infectious individuals fail to transmit the infection to other individuals. This happens when the basic reproductive number falls below 1 (𝑅0 < 1). This happens because individuals recover from the
disease at a faster pace than the infection can spread to new individuals. Thus eventually there are no people left to spread the infection and the disease dies.
Similarly, if this number becomes greater than 1 (𝑅0 > 1), the infection will
continue spreading in the population and become an epidemic. This is because the transmission rate is greater than the recovery rate, which means that more number of individuals are getting infected than the number of people getting recovered in the same amount of time. This results in a greater number of infected people over time and thus an epidemic. A larger 𝑅0 value generally means a bigger and difficult to
CHAPTER 4 Experiments
There have been many reports of malicious users using Twitter-based botnets since 2009 [28] and researchers developing botnet using Twitter for command and control [33, 32]. The botmaster uses the social network, Twitter, for the command and control of the botnet because it does not require the overhead of setting up a dedicated IRC server or creating a peer-to-peer network control structure. We wanted to analyze and model the spreading mechanism of a botnet on social network, thus we created a Twitter-based botnet. We will discuss the experiment setup and results in this chapter.
We started by building the bot, a Java application. This application, FreeLunch, monitors the botmaster Twitter account for any commands and performs operations based on the commands. We used Twitter4j library [37] for Twitter APIs.
We created a twitter4j.properties file which contains all the configuration infor-mation for the application. This includes parameters like consumer key, secret key, access token, user name and the request interval. This information is segregated so that if the botmaster Twitter account is compromised or blocked for any reason, the details can be updated without affecting the operation of the botnet. The update process is achieved by uploading a copy of this configuration file on Dropbox [15]. The bot application monitors the Dropbox link for any changes to the properties file. If there are any changes the latest copy of the properties file is downloaded and used for operations.
hour [36]. For this reason our application polls the botmaster Twitter account every four hours for any new tweets. If there are multiple tweets, each tweet is analyzed in chronological order, that is, the latest tweet is analyzed last. The application is added to the Startup programs folder so that the application launches every time the system restarts.
4.1 Attack Scenario
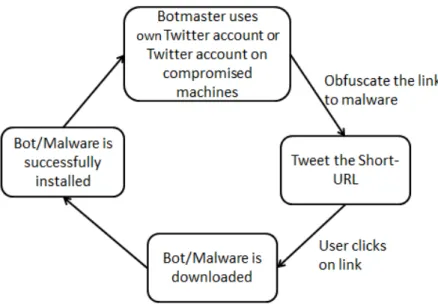
The botmaster uploads the bot onto a personal server. He then creates a tiny URL (using services like bit.ly) to ensure that the complete URL is not visible. The botmaster posts the URL as tweet on his twitter account with or without hashtags. Short-URLs are regular URLs which are encoded into URLS with a lesser number of characters, and can thus be used in tweets. These short-URLs present a very potent threat to any user because of the encoding of URLs. It is a method of information obfuscation which can be exploited to force users to download the malicious software on their system and spread it without their knowledge. This obfuscation becomes a much more potent threat and far reaching when social network such as Twitter is involved.
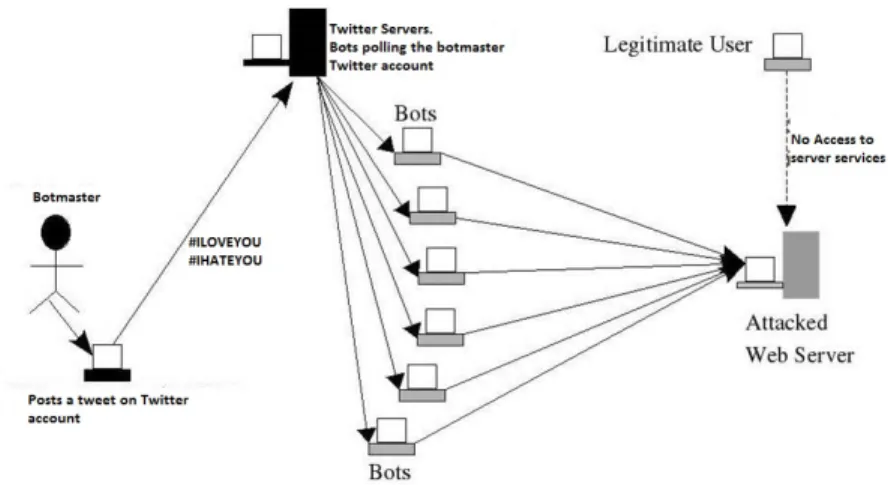
Most of the users on the social network are naive and do not care much about the security aspect. It is very easy to lure these users to click on malicious links. Once the botmaster tweets the short-url, his followers would be able to see the tweet and some, if not all, would click on the url. This click will result in downloading and installing of the bot (assuming that the system does not block it), thereby initiating the spread of botnet. When the botnet receives command from the botmaster, it uses the Twitter account of the exploited user to further spread its reach. This can be illustrated using Figure 5
Figure 5: Spread of botnet using Twitter
The botmaster uses the Twitter account to issue commands to the botnet. We use Docker for network simulation and perform a distributed denial of service attack on a server. The bot monitors the botmaster Twitter account for the hashtags in the tweets. The bot has been programmed to start the DDoS attack on the server when-ever a tweet with #ILOVEYOU is posted. This leads to the server being inaccessible to any legitimate user that may be trying to use the service. The bots stop the attack when the botmaster posts a tweet with #IHATEYOU. The general idea of the attack can be understood using Figure 6
4.2 Analysis: Spreading the Bot
We want to analyze the spread of the botnet on Twitter using our attack method. For purposes of experimentation we consider a constant population consisting of 𝑁
users on Twitter, which is assumed to be fixed during the course of the epidemic. The number of infected users on Twitter depend on the density of followers of
Figure 6: DDoS attack using the botnet
the infected user based on time, geographic location and the reach of the infection in the follower circle [16].
We will be discussing two different variants of the epidemic models.
Model 1: The infected nodes recover after the infection and cannot be infected again. This may correspond to a single vulnerability that was exploited by the bot and is now patched. It is analogous to an immunization we get for a disease. We will call this Simple Model (SIR).
Model 2: The infected nodes are divided into two parts, exposed i.e. the nodes have the infection but cannot spread it, and infected i.e. the infection is prominent enough to spread it to other nodes. This will correspond to bot being installed on the user machine, but not performing any malicious action or re-tweeting the short URL until commanded by the botmaster. The wait state is also called the hidden state. We will call this SEIR Model.
4.2.1 Simple Model (SIR)
We started with a basic model where once the nodes are recovered they will forever remain recovered, i.e., the node cannot be used to infect more nodes. In the SIR model, 𝑆(𝑡), 𝐼(𝑡), and 𝑅(𝑡) denote the number of susceptible, infected and recovered nodes at any given time t. Every member of the population belongs to one of these groups. Thus, if is the total population is𝑁(𝑡), then𝑁(𝑡) =𝑆(𝑡)+𝐼(𝑡)+𝑅(𝑡). We will work on the assumption that each of the susceptible users (the followers of an infected user) can get in contact with the infectious members and thus get infected. The infection rate 𝛽 denotes the probabilistic rate at which an infected or malicious user spreads the infection by broadcasting the tweet containing the short-URL. We can say that number of infected users is equal to number of users “following” the infected users who will click on the link in the tweet. Thus only the followers of an infected user can get infected using this model. However, not all users are equally susceptible. The degree of susceptibility depends on the average degree of connectivity which means the number of followers a user has, the probability of a link being clicked, and the probability of malware/bot infection meaning that the bot is successfully installed on the system. In this model, for simplicity we assume that users which get infected will never be recovered. This is done to avoid the cycle of infected-> recovered -> susceptible -> infected. So we will have 𝑅(𝑡)equals 0.
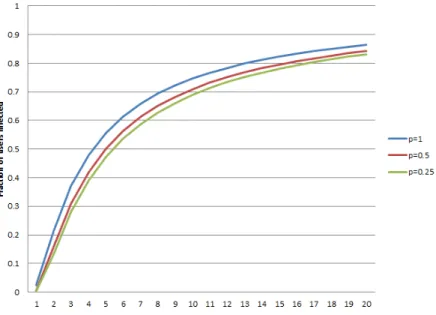
There are various factors that affect the number of infected users from a given infected user. These factors are the density of followers of the infected user based on time and geographic location and the reach of the infection in the follower circle. We ran the initial experiments based on some different parameters of𝛽, the probability of spread of infection to the followers, and the probabilities of followers clicking links from users, p, and calculated the fraction of users infected at any given time. For simplicity
we assume all users have the same number of followers. The 𝑥-axis represents the progression of time (in units) while the𝑦-axis represents the fraction of infected users in Figure 7. We can clearly see that as probability of infection nears one, the faster the infection spreads.
Figure 7: Fraction of the infected users with time
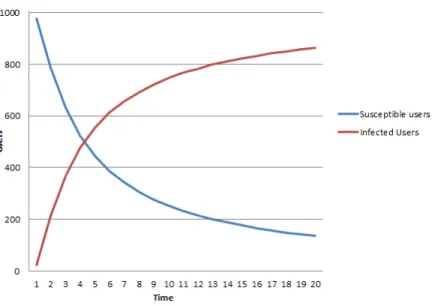
We conducted the experiment to get the number of bots at any given time with the number of followers of each user constant at 10. Figure 8 shows the spread of the bots over the period of time with a constant population of one thousand users. As the number of infectious users increase, the susceptible user group decreases in size. This is because of the constant population size. This is under the assumption that the botmaster is tweeting continuously ,i.e. one per unit time. We can interpret the graph time units in minutes, if the botmaster tweets per minute. This is similar to a condition when an unknown worm is left on the open network so that it can spread as long as nobody comes up with a recovery or removal strategy.
Figure 9 shows the number of infected users with varying values of probability for the spread of infection. A low probability of infection transmission means it takes
Figure 8: Number of Infected Users over time with no recovery (SI Model)
longer time for users to be infected and thus a slower epidemic. All users are infected at time t equal 4 in case of probability equal 1 compared to the time t equal 7 it takes in case of probability equal 0.25.
Figure 9: Number of Infected and Susceptible Users over time for different values of probability of infection (SI Model)
Next we changed the experiment to accommodate the recovery in the model. We performed the experiment again with the click probability set as 0.5 and rate of
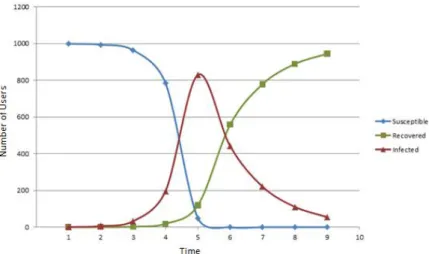
recovery 𝛾 as 0.5. This means that 50% of the infected nodes recover from infection at the next time step. Figure 10 shows the plot. As the number of infected users increases the number of susceptible users decrease. When the recovery starts the users which can get infected decreases further. Thus the infection dies out after a period of time and all users are recovered.
Figure 10: SIR Model with Susceptible,Infected and Recovered Users
Figure 11 shows the result of the same experiment with each user having 10 followers. The transmission rate 𝛽 was set as 0.4 and the recovery rate 𝛾 set as 0.3. This means that users have 40% chance of contracting the infection and if infected they recover after three time units. We can see from the plot that the number of infectious users increases steadily first and then increases exponentially. As the users start recovering the number of susceptible users reduces. This in turn reduces the number of infectious users with time.
We wrote a small simulation program using Java and Swing to show the spread of the bot in a random 50 node graph with node degree equal to 10. The degree of the node means that a node has 10 connections and hence can spread the infection to 10 nodes if the probability of infection is 1. Figure 12 shows the progress of infection
Figure 11: SIR model with 𝛽 = 0.4 and 𝛾 = 0.3
and recovery at different time intervals. The black nodes denote susceptible nodes, the red nodes are infected and the green nodes are recovered nodes. Each infectious node infects five other nodes at every step. The infected nodes recover from the infection in the next instance of time.
4.2.2 SEIR Model
There are some diseases like HIV/AIDS or SARS where even though a person catches the infection, he is not infectious for some period of time. This means that even though the individual has contracted the infection, he is not capable of spread-ing the infection. In a similar manner, there may be cases where the infected host machines, bots, take no action for some time to aid in the spread of botnet. These can be studied using the SEIR model.
We divided the users into four classes for this model. Class S is a class of all susceptible users with a known risk of infection. Class E represents the hidden infected users, i.e. the infected users which cannot infect other susceptible users. Class I is made up of active infectious users which can infect the susceptible users and perform malicious bot operations i.e. DDoS and spamming. Class R is comprised of Users that have been cured of the infection and are now immune to the bot.
We did an experiment similar to the SIR Model for a total population of 1000 users with two states of infection, namely exposed and infected for the SEIR model. Figure 13 shows the result of the experiment.
Figure 13: Number of Susceptible,Exposed, Infected and Recovered Users over time with infection rate=0.5 and recovery rate=0.5 (SEIR Model)
The incubation period from exposed to infection is set as one time unit. This means that the exposed users can start spreading the infection after one day. The probability of infection p is set as 0.5 and recovery probability 𝛾 is also set as 0.5. The resulting graph shows that the plot for infected users follows the exposed users line plot lagging by one time unit. This is because of the incubation period set as 1. The nodes recover after two time units thus lowering the number of infections in the total population.
4.2.3 SEIR Model for Twitter
We expanded the experiment to simulate the social network Twitter with 5 mil-lion users. We simulated the social network, Twitter, using the average statistics of Twitter like the number of followers, the probability that a tweet is re-tweeted and the median follower count of users. We started with a single infected user who in turn will infect some of his followers. We compute the number of followers for any user using a random number generator between 10 and 100. Similarly, we compute a random click probability between 0.1 and 0.6 biased towards 0.1. This probability helps us to calculate the number of susceptible users that get the infection from the first user. We also calculate the number of secondary infections using random probability and the number of uninfected followers.
Figure 14 shows the SEIR model for the spread of a botnet using the social network simulation. It shows that given the incubation period of one time unit, the infectious plot line follows the exposed plot line. The infected users recover in the next time instance as the recovery rate is one. Since the total number of users at any given time is a constant, the highest number of infected users at any given time would be lessened by the number of users exposed and recovered.
Figure 14: SEIR model for the spread of botnet over Twitter
We repeated the experiment with some fixed values of the number of followers, click probabilities and recovery rate. We do not consider any secondary infections for these experiments. The botnet spread in Twitter with the number of followers fixed at 100 and click probability of 0.5 can be seen in Figure 15. Here again, it can be observed that the exposed users are followed by infected users which in turn convert to recovered users. The peak value of infected users in this case is higher because all users have the same number of followers which is 100 and a higher click probability.
Figure 15: Spread of the botnet over Twitter with 𝑛= 100 and 𝑝= 0.5
Figure 16 shows the result of the experiment with the number of followers fixed at 50 and click probability of 0.3. Since the number of followers for each user is smaller and the click probability is also smaller than the previous case, it takes a longer time
period to reach the peak number of infected users and thus, a longer recovery time.
Figure 16: Spread of the botnet over Twitter with 𝑛 = 50 and 𝑝= 0.3
4.3 Analysis: Spreading a tweet
A tweet is said to go viral if it is re-tweeted repeatedly by a large number of users. The tweet is usually re-tweeted by the followers of the user who tweets it. We use this to simulate and observe the spread of a tweet on the network using epidemic model. We used SIR model because the susceptible users re-tweet when they are infected and move to the recovered state.
We used the Twitter social network simulation for the re-tweet experiment using random probability of infection and the number of followers. Figure 17 shows the result of the experiment.
The plot shows that the tweet spreads quickly when the number of susceptible users is large, but the spread is slow after most of the users have been infected. This is because the users recover from infection after one time unit. The highest number of tweets is directly dependent on the number of followers and click probability. The higher the number of followers and the probability that the followers will click on the link in the tweet, the more the number of retweets.
fol-Figure 17: Spread of a Tweet over social network
lowers and click probability to simulate the spread of tweet on Twitter. Figure 18 shows the result of experiment with 100 followers for every infected Twitter user with click probability of 0.5. The infected users start retweeting and thus spreading the infection to the susceptible users. Once the infected user has retweeted, it moves to the recovered class in the next time instance.
Figure 18: Spread of Tweets with 𝑛= 100 and 𝑝= 0.5
Figure 19 shows the result of experiment with each Twitter user having 50 fol-lowers and click probability of 0.3. The plot follows the same trend as Figure 18 but it is easy to notice that the smaller number of followers and lower probability of clicking on the tweet results in more time for it to reach maximum number of retweets. The highest number of retweets are reached at time equal to 7 in this case compared to
time equal to 5 in case of more number of followers and higher click probability.
Figure 19: Spread of Tweets with 𝑛 = 50 and 𝑝= 0.3
To better understand the role of click probability we conducted experiments with a fixed number of followers but varying click probability. Figure 20 shows a comparative graph of spread of tweets when the number of followers for each user is 70 and click probability is 0.3 and 0.5. It is clear from the graph that higher probability would mean the infection penetrates the social network faster. Thus in order to contain the spread, the click probability should be reduced. One of the ways to achieve this is by educating the users to not click on any links from unknown users.
4.3.1 Basic Reproduction Number
Basic Reproduction Number is an important number when analyzing the epi-demic model. It is used to determine the course a disease takes over a period of time, that is whether the disease dies out or causes an epidemic. Similarly basic reproduc-tion number can be used to determine if the malware or botnet creates an epidemic on the network or eventually dies out.
We wanted to analyze the behavior of basic reproduction number on our simu-lated social network when we vary the number of followers for an infected user and the probability that a follower clicks on the link in the tweet, called click probability. More often the basic reproduction number is calculated using the differential equa-tions of the model using matrix operaequa-tions. For purposes of simplicity we used the formula
𝑅0 = 𝛽𝑁
𝛾
where 𝛽 is the rate of infection transmission and𝛾 is the recovery rate.
We calculated the basic reproductive number for all values of the number of followers between 10 and 100 and click probability between 0.2 and 0.6. Figure 21 shows the variation of the Basic Reproduction Number with the number of followers and probability when recovery rate was assumed as 1. The number of followers every user has directly impacts the basic reproduction number. The higher the number, the greater would be the basic reproduction number. The click probability also affects the basic reproduction number in a similar manner. Higher the probability that the infection will spread, the higher would be the basic reproduction number.
We also calculated the basic reproductive number for different values of recovery rate. Figure 22 shows the value of basic reproductive number for two different values
Figure 21: Basic Reproduction Number as a function of number of followers and click probability
of the recovery rate. The longer it takes to recover from infection, the higher is the basic reproduction number. The basic reproduction number 𝑅0 is greater than 1 for
all values confirming that we have an epidemic in the simulated social network.
We performed an experiment using Docker simulation to determine the conditions in the network when the number of infected users rises significantly resulting in an epidemic. We repeated the experiment with multiple values of number of followers and click probability and observed the number of infected users at time unit seven. If there is a DDoS attack observed at time interval seven it means that epidemic occurs in the simulated network. The number of followers for an infected user was varied from 5 to 15 with the click probability varying from 0.1 to 0.5.
Figure 23 shows the result of the experiment. The red areas on the heat map mark the values for which infected users create an epidemic. There are higher chances of infection epidemic when the click probability and number of followers are both high. It was observed that the spread of infection can be contained if the click probability is reduced to 0.1 even for higher number of followers.
Figure 23: Simulation showing the effect of click probability and number of followers in a network
We also calculated the values of the basic reproduction number using the math-ematical formula for a comparative analysis. Figure 24 shows the heat map for the same values of number of followers and click probability. The blue areas correspond to the safe values, i.e. values for which the infection does not create an epidemic. The red areas mark the epidemic state of infection.
Figure 24: Effect of click probability and number of followers on the number of infected users
Like in Figure 23, the epidemic grows stronger with the number of followers and click probability. We observed some differences in the experimental results and mathematical results because our experiment was time-bound. Should we increase the waiting time for the DDoS attack in our experiment, we would see less difference. Additionally, the mathematical derivation considers ideal conditions in the network which is not always true. There may be some delays or periods of inactivity by a user which can cause deviation from expected result.
4.3.2 Defensive Strategies
Having conducted several experiments to establish that Twitter can be used as a command and control center of a botnet, we wanted to analyze some defensive mechanisms to mitigate the extent of the attack.
One of the imperative things is to discourage Twitter users to click on random links. This cannot be done because it will have an adverse effect on the way the social network operates and makes business. One way to manage this can be by letting Twitter control all the links posted in the tweets and not permit third-party
short-URL services. While Twitter has an in-house short-URL provider which checks the authenticity of the posted links in the tweets, it also allows short-URLs from other providers.
Another way to inhibit the magnitude of attack is by educating the Users to be careful around user profiles and tweets which look suspicious. This can go a long way in preventing the spread of botnet infection. If the click probability of the user is reduced to below 0.1, the effects of the botnet will be extenuated.
Another important aspect of infection prevention is prioritizing sharing of infor-mation. All authorities including government should share any available information with the users and encourage them to take caution. More research based solution can be creating a mini-sandbox which will open the clicked link in a closed environment, cut off from system resources.
4.4 Simulating the spread of Code-Red worm
Code-Red and Code-Redv2 combined is one of the worst computer worm and virus. These worms surfaced in July 2001 and infected more than 359,104 computers in less than 14 hours [27]. Around 43% of the infected machines were in United States followed by Korea. The worms affected machines running Windows 2000 and Windows NT operating system. The Windows platform was exploited due to buffer overflow vulnerability.
While the first version of the worm used a random number generator with static seed, Code-Redv2 used random-seed based random number generator to search for unpatched versions of Windows operating system. The Code-Redv2 worm spread in a conventional IP address scan manner but scanned for a different set of IP addresses from each infected machine thus infecting a huge number of machines in a short
period of time. The infection process continued for a twenty-four hour period between July 19, 2001 midnight to July 20, 2001 midnight. The worm was programmed for a distributed denial of service attack on the White House website. The impact of the worm was widespread and huge loss of business occurred.
We performed an experiment to model the spread of the Code-Redv2 worm in the 24-hour period. We used our social network simulator for the purpose.
Our experiment results can be seen in Figure 25 assuming a total population of 400,000 user machines and scanning rate of 100 machines per hour with a probability of infection varying between 0.1 and 0.4. The infection started slow but an exponential growth in the number of infected machines was observed after some time.
Figure 25: SI model simulation for spread of Code Redv2 worm
We know that the infection spread ceased at midnight of July 20, 2001. The infected machines performed a distributed denial of service attack on the White House website. We created a SIR model by assuming that all the infected machines recovered after performing the distributed denial of service attack.
Figure 26 shows the result of the simulation. Once the number of infected ma-chines reached the maximum they performed a DDoS attack and went to the recovered
state. Therefore, we see a steep drop in the number of infected users and a steep rise in the recovered hosts.
Figure 26: SIR model simulation for spread of Code Redv2 worm
We could successfully simulate the spread of Code-Redv2 worm using our model. However, we have no data to compare if the rate of spread in the model is the same as the actual worm spread.
CHAPTER 5
Conclusion and Future Work
The purpose of this research was to study the use of the social network, Twitter, as a command and control center of a botnet. We created a bot application which used Twitter to spread and infect as many users as possible. The botnet executed denial of service attacks once a good number of users had been infected. We also focused on studying the way a botnet spreads in the social network Twitter and modelled the behavior using mathematical epidemic models, SIR and SEIR. A number of factors contributed to the success of our botnet attack using Twitter. The first factor was that the botmaster has the capability to broadcast a malicious message because a tweet is posted publicly and is visible to all users on Twitter. The obfuscation of the original links using short-URLs further contributed to the success. Finally the click probability, that is, the probability that a user clicks the short-URLs in the posted tweet, was high because of limited user education towards security. We were able to successfully demonstrate that a botnet can spread like an epidemic on a social network. We were also able to determine the epidemic model parameter 𝑅0, basic
reproduction number, from the botnet simulation. Even though Twitter monitors the user accounts very closely and has a bad reputation of blocking the user accounts it suspects of any malicious activity including spamming, it is very difficult to detect botnet activities on the social network. The work done illustrates that social network can be exploited as a command and control of a botnet and can create an epidemic of infected machines in no time.
Our research was based on various assumptions about Twitter like fixed the number of users, no inactive users, one tweet per user, etc. The research work can be
extended to better immitate the social network, Twitter, as it is used. The differential equations and the transmission parameters can be modified to include parameters like density of users based on time and location following the infected users. These modified equations can be used to solve for basic reproduction number. Creating an internal network, cut off from outside Internet, that can be scaled to simulate the Internet would be useful in getting close results. Further, methods proposed in [17] can be used to determine the number of infected users at any given time and thus be used as a defensive mechanism.
LIST OF REFERENCES
[1] 22 Social Media Facts and Statistics You Should Know in 2014, Jeff Bullas,
http://www.jeffbullas.com/2014/01/17/20-social-media-facts-and-statistics-you-should-know-in-2014/
[2] M. Ajelli, R. Lo. Cigno, A. Montresor, Modeling Botnets and Epidemic Malware,
Communications (ICC), 2010 IEEE International Conference, Capetown, May 2010,
http://disi.unitn.it/~montreso/pubs/papers/icc10.pdf
[3] L. Allen, An Introduction to Stochastic Epidemic Models, Mathematical Epi-demiology, pp 81-130, 2008
[4] Analysis Shows Social Networks Increasingly Used to Spread Malware, Info-Security Magazine, May 2, 2012
[5] E. Athanasopoulos, A. Makridakis, S. Antonatos, D. Antoniades, S. Ioannidis, Antisocial Networks: Turning a Social Network into a Botnet,11th International Conference, ISC 2008, Taipei, Taiwan, September 15-18, 2008,
http://www.ics.forth.gr/dcs/Activities/papers/facebot.isc08.pdf
[6] J. Aycock, Spamulator: The Internet on a Laptop, Proceedings of the 13th An-nual Conference on Innovation and Technology in Computer Science Education, Madrid, Spain, 2008, pp. 142-147.
[7] P. Barford, V. Yegneswaran, An Inside Look at Botnets, Special Workshop on Malware Detection, Advances in Information Security, Springer 2006,
http://pages.cs.wisc.edu/~pb/botnets_final.pdf
[8] D. Barroso, Botnets as the Silent Threats, European Union Agency for Network and Information Security, September 7, 2007,
http://www.enisa.europa.eu/publications/archive/botnets-2013-the-silent-threat
[9] Z. Bu, P. Bueno, R. Kashyap, A. Wosotowsky, The New Era of Botnets, McAfee Labs,
http://www.mcafee.com/us/resources/white-papers/wp-new-era-of-botnets.pdf
[10] Crimeware: What’s a Bot?, Norton by Symantec,
[11] D. Daley and J. M. Gani, Epidemic Modelling : An Introduction, Cambridge University Press, 1999
[12] O. Diekmann, H. Heesterbeek, Mathematical Epidemiology of Infectious Dis-eases: Model Building, Analysis and Interpretation, New York: Wiley, 2000 [13] D. Dittrich, S. Dittrich, P2P as Botnet Command and Control: A Deeper Insight,
International Conference on Malicious and Unwanted Software, 2008,
http://staff.washington.edu/dittrich/misc/malware08-dd-final.pdf
[14] Docker - An open platform for distributed applications for developers and sysad-mins, December 2014,
https://www.docker.com/
[15] Dropbox - Keep your files safe, synced, and easy to share, December 2014,
https://www.dropbox.com/
[16] M.R. Faghani, H. Saidi, Malware Propagation in Online Social Networks, Mali-cious and Unwanted Software (MALWARE), 2009 4th International Conference, October 2009,
http://faghani.info/malware09.pdf
[17] M. E. Fioravanti, Bacterial quorum sensing for coordination of targeted mal-ware, Malicious and Unwanted Software: The Americas (MALWARE), 2014 9th International Conference, October 2014, pp. 101-108
[18] Flashback Mac Malware Uses Twitter as Command and Control Center, The Mac Security Blog, March 5, 2012,
http://www.intego.com/mac-security-blog/flashback-mac-malware-uses-twitter-as-command-and-control-center/
[19] Fridge caught sending spam emails in botnet attack,CNET.com, January 19, 2014,
http://www.cnet.com.au/fridge-caught-sending-spam-emails-in-botnet-attack-339346451.htm/
[20] M. Garetto,W. Gong,D. Towsley, Modeling Malware Spreading Dynamics, IN-FOCOM 2003, Twenty-Second Annual Joint Conference of the IEEE Computer and Communications, IEEE Societies, April 2003,
http://infocom2003.ieee-infocom.org/papers/46_01.PDF
[21] J. Hefferman, R. Smith, L. Wahl, Perspectives on the Basic Reproduction Ratio,
Journal of the Royal Society Interface 2, 2005
[22] T. Holz, S. Marechal, F. Raynal, New Threats and Attacks on the World Wide Web, IEEE Security and Privacy, vol.4 (2), pp. 72-75, March/April 2006
[23] C. Kalt, Internet Relay Chat: Client Protocol, RFC 2812, 2000
[24] W. O. Kermack, A. G. McKendrick, A Contribution to the Mathematical Theory of Epidemics, Proceedings of the Royal Society A: Mathematical, Physical and Engineering Sciences 115 (772): 700, August 1927
[25] X. Li,B. Fang, Stability of an Age-structured SEIR Epidemic Model with Infec-tivity in Latent Period,Applications and Applied Mathematics: An International Journal (AAM), Vol.4, pp. 218-236, June 2009
[26] The Math Behind The CDC’s Predictions About How Bad The Ebola Epidemic Could Get, Business Insider, October 10, 2014,
http://www.businessinsider.com/ebola-epidemic-modeling-2014-10
[27] D. Moore, C. Shannon, J. Brown, Code-Red: A Case Study on the Spread and Victims of an Internet Worm, Internet Measurement Workshop (IMW), Mar-seille, France, Nov 2002, pp. 273–284,
http://www.caida.org/publications/papers/2002/codered/codered.pdf
[28] J. Nazario, Twitter-based botnet command channel, The Arbor Networks Security Blog, August 13, 2009
http://ddos.arbornetworks.com/2009/08/twitter-based-botnet-command-channel/
[29] Novel Version of Pony Botnet Attacks Bitcoin Users, January 10, 2014,
http://www.modernreaders.com/novel-version-of-pony-botnet-attacks-bitcoin-users/1885/lorenzo-tanos
[30] P. Roberts, Sophisticated attackers now using social net for command and con-trol, ThreatPost , January 27, 2011
[31] The Role of the Internet in the Propagation of Malware, STM Whitepaper NETGEAR ProSecure,
http://www.netshop.co.uk/NetshopFiles/pdf/stm600ew3-100eus/STM_ Whitepaper_PropagationOfMalware.pdf
[32] A. Sanzgiri, J. Joyce, S. Upadhyaya, Early (tweet-ing) Bird Spreads the Worm: An Assessment of Twitter for Malware Propagation,9th International Conference on Mobile Web Information Systems (MobiWIS), Ontario, Canada, August 2012,
http://www.cse.buffalo.edu/~shambhu/documents/pdf/MobiWIS-2012.pdf
[33] A. Singh, K. Ross, A. Toderici, M. Stamp, Social Networking for Botnet Com-mand and Control,International Journal of Computer Network and Information Security, 5(6):11-17, May 2013,
![Figure 1: Architecture of Spamulator [6]](https://thumb-us.123doks.com/thumbv2/123dok_us/791284.2600032/22.918.282.692.146.541/figure-architecture-of-spamulator.webp)
![Figure 2: Architecture of Docker [14]](https://thumb-us.123doks.com/thumbv2/123dok_us/791284.2600032/23.918.260.715.621.999/figure-architecture-of-docker.webp)