Pattern Mining and Anomaly Detection based on
Power System Synchrophasor Measurements
Huiying Ren1Zhangshuan Hou1 Earth System Science Division1 Pacific Northwest National Laboratory {Huiying.Ren | Zhangshuan.Hou} @pnnl.gov
Heng Wang2, Dimitri Zarzhitsky3, Pavel Etingov2 Electricity Infrastructure & BuildingDivision2,
Computing and Analytics Division3 Pacific Northwest National Laboratory {Heng.Wang | Pavel.Etingov} @pnnl.gov
Abstract
Real-time monitoring of power system dynamics us-ing phasor measurement units (PMUs) data improves situational awareness and system reliability, and helps prevent electric grid blackouts due to early anomaly de-tection. The study presented in this paper is based on real PMU measurements of the U.S. Western Intercon-nection system. Given the nonlinear and non-stationary PMU data, we developed a robust anomaly detection framework that uses wavelet-based multi-resolution analysis with moving-window-based outlier detection and anomaly scoring to identify potential PMU events. Candidate events were evaluated via spatiotemporal correlation analysis and classified for a better under-standing of event types, resulting in successful anomaly detection and classification of the recorded events.
1. Introduction
The phasor measurement units (PMUs) provide high-resolution, accurate, and synchronized information about power system state. Active deployment of PMUs enables a more reliable and efficient manner of power system operations by monitoring key metrics, such as angle and voltage stability, along with power system os-cillations[1, 2]. According to North American Synchro-phasor Initiative (NASPI), the installations of PMUs are rapidly increasing in the United States. In July of 2012, there were only about 500 PMUs installed across the country, but the number increased to over 2000 installed PMUs by 2015 [3]. Given the large coverage and rich capability of PMUs, extensive research in applying PMU measurements to enhance the situational aware-ness for the power grid has been conducted [5-9], and PMUs have been utilized for voltage stability improve-ments [4] and building of advanced Wide Area Moni-toring Protection and control (WAMPC) systems [4].
The magnitude phasors data from PMUs were used to analyze voltage stability in real time [10]. Also, studies of phasor angle data from PMUs were performed for line outages detection[11].
Since the amount of PMU data rapidly increased, implementation of data mining on PMUs can benefit the operator by tracking power system dynamics and detect-ing conditions that could result in system blackouts. For example, anomaly detection of PMU data has been done using transmission line parameters [12], where continu-ous monitoring of equivalent impedances of transmis-sion lines is required. When Supervisory Control and Data Acquisition (SCADA) system data is available, a correlation examination of the PMU data can be useful [13] and optimal filtering and feature-based classifica-tion approaches to improve accuracy of PMU anomaly detection have been studied [14]
,
[15].Data mining is often referred to as knowledge dis-covery in databases (KDD), and finding or recognizing patterns can be thought of as fitting a model to the data. Pattern mining techniques can be used to analyze power system behaviors, such as frequency or voltage changes in the PMU measurements, as well as to localize these anomalous events.
Anomaly detection can be accomplished by several signal-processing approaches, such as Eigenvalue Anal-ysis (EA), Fourier Transform (FT), Short Time Fourier Transform (STFT), Spectral Analysis (SA), and others. Since PMU signals are usually nonstationary, many standard FT methods unsuitable for PMU applications. It has been demonstrated that advanced algorithms based on FT [16] can be applied to PMU data to improve dynamic phasor estimates. However, with a large amount of PMU data, computational requirements are significant [17]. Likewise, because STFT and SA ap-proaches are based on fixed-size windowing techniques, they are less accurate and efficient in tracking signals in both time and frequency domains.
Proceedings of the 51st Hawaii International Conference on System Sciences|2018
URI: http://hdl.handle.net/10125/50218 ISBN: 978-0-9981331-1-9
(CC BY-NC-ND 4.0)
In contrast, the wavelet transform separates 1D sig-nals into 2D components overlapping in time-frequency domain. The wavelet techniques have been widely used because of good multiple time-frequency resolution [18, 19]. Wavelet transforms have been proven to be very ef-ficient [20] in signal analysis, with a reduction of the number of coefficients as the scaling factor increases. Discrete wavelet transform (DWT) is sufficient to de-compose and reconstruct most power quality problems, which can analyze information accurately and effi-ciently[21]. Wavelet-based anomaly detection has been successfully applied for detecting network anomalies [22-26] for various systems and problems. Wavelet-based multi-resolution analysis (MRA) uses a wavelet function and a scaling function to decompose and recon-struct the signal at different resolution levels, allowing the anomaly phenomena to be detected and localized at each resolution level.
In this study, MRA was applied to the PMUs in a U.S. Western Electricity Coordinating Council (WECC) system. The paper is organized as follows: Section 2 de-scribes the theoretical background of MRA, and mov-ing-window-based outlier detection and anomaly scor-ing system. Section 3 demonstrates detection results us-ing real-world PMU data, together with classification analyses of the verified events. The different scoring systems and spatiotemporal correlation analyses are dis-cussed in Section 4.
2. Methodology
2.1. Multi-resolution analysis (MRA)
Wavelet process using DWT can filter the input sig-nal with lowpass and highpass filters. Lowpass filter is defined by a scale function, that is,
𝜑𝜑𝑗𝑗,𝑘𝑘(𝑥𝑥) = 2 𝑗𝑗
2𝜑𝜑(2𝑗𝑗𝑥𝑥 − 𝑘𝑘) (1) where 𝑘𝑘 is the translation coefficient and j is the scale factor [27]. The expansion function of any subspace can be built from double-resolution copies of them-selves [28], so the scaling function can be written as
𝜑𝜑(𝑥𝑥) = ∑ ℎ𝜑𝜑𝑛𝑛 (𝑛𝑛)√2𝜑𝜑(2𝑥𝑥 − 𝑛𝑛) (2) where ℎ𝜑𝜑 represents the scaling function coefficients. The highpass filter is defined by a wavelet function,
𝜓𝜓𝑗𝑗,𝑘𝑘(𝑥𝑥) = 2 𝑗𝑗
2𝜓𝜓(2𝑗𝑗𝑥𝑥 − 𝑘𝑘) (3) It can be expanded to
𝜓𝜓(𝑥𝑥) = ∑ ℎ𝜓𝜓𝑛𝑛 (𝑛𝑛)√2𝜓𝜓(2𝑥𝑥 − 𝑛𝑛) (4) where ℎ𝜓𝜓 contains the wavelet function coefficients. The DWT decomposes signals into the approximation (A) and detail (D) components, respectively. Approxi-mation of the signal at resolutions 2−𝑗𝑗,𝑗𝑗= 0, 1, 2 … can be obtained at decreasing levels of detail. A detailed the-ory of MRA has been developed by Meyer [29], and can be mathematically expressed as 𝑓𝑓(𝑥𝑥) = ∑ 𝐶𝐶𝑜𝑜𝑛𝑛 (𝑛𝑛)𝜑𝜑(𝑥𝑥 − 𝑛𝑛) + ∑ ∑ 𝐷𝐷𝑗𝑗(𝑛𝑛)2 𝑗𝑗 2 𝑗𝑗−1 𝑗𝑗=0 𝑛𝑛 𝜓𝜓(2𝑗𝑗𝑥𝑥 − 𝑛𝑛) (5)
where 𝐶𝐶𝑜𝑜 is the 0 level scaling coefficient and 𝐷𝐷𝑗𝑗 is the wavelet coefficient at scale j. The scaled and translated wavelet 𝜓𝜓(2𝑗𝑗𝑥𝑥 − 𝑛𝑛) in MRA is a decomposed signal in the time-frequency domain. Orthogonal wavelets ex-panded by 2𝑗𝑗 carry signal variations at the resolu-tion 2−𝑗𝑗. A number of wavelet families have been de-veloped with different characteristics, and a well-known family is the Daubechies (db) [30]. In our pa-per, Haar (db1) wavelet is employed in the MRA. Haar’s wavelet has 1 moment of wavelet function, which has a linear phase and a complete localization in the time domain[30][31].
2.2. Anomaly scoring and classification
The raw PMU data that was used in this study con-tains 12 units representing signals at 12 different loca-tions in the WECC system. For each PMU, there are four attributes, including the voltage, angle variation (lag 1 differences for PMU phasor angle), frequency, and rate of changes of frequency (ROCOF). The PMUs are stored in PDAT format [32], developed by the Bonneville Power Administration (BPA). The format was based on IEEE Std. C37.118.2-2011 data frames [33]. Each file contained 1 minute of PMU data at a 60 samples per second resolution. In this paper, the PMU signals were re-sampled at 1Hz for our framework since we focused on detecting anomalous events which usu-ally lasted for a number of seconds and the variability within 1 second generally has weak correspondence to the potential events.
To localize anomalies at each decomposed resolu-tion level, a moving-window-based outlier detecresolu-tion ap-proach was proposed. The moving window can retain both reliability and sensitivity of the detection perfor-mance. The anomalous score was set to be 1 if an anom-aly was detected at each resolution level. The anomanom-aly score matrices were the summation of scores at multi-resolution levels across 12 units for each PMU attribute.
The anomalous scores can be used to rank the ‘likeli-hood’ of events. Given the fact that the recorded actual events last between 5 and 20 seconds, the detected anomalies were further prescreened by the event dura-tions. Spatiotemporal correlation analysis were applied to the anomaly candidates to distinguish between false alarms and real events. The false alarms are expected to have weak spatiotemporal correlations due to locality and weak continuity, although local events may actually occur for only a few PMUs. In general, strong correla-tions across units should verify and confirm the real events[34].
For the verified events, we deployed the cluster anal-ysis and Principal Component Analanal-ysis (PCA) for iden-tifying similarities between the events. Clustering groups multiple objects by putting similar objects in the same group. The appropriate clustering algorithm and clustering model parameters are problem-dependent. In this study, we used Expectation Maximization [35] al-gorithm for clustering analysis [35-37]. EM-clustering is a general model-based approach for approximating maximum likelihood estimations using Bayesian infor-mation criterion (BIC)[38]. PCA is also useful for sim-ilarity identification; it converts observations of possi-bly correlated variables into a set of values of linearly uncorrelated variables (called principal components) us-ing orthogonal transformation. The first principal com-ponent has the largest possible variance and the most variability. By combining quantitative clustering meth-ods, PCA helps highlight which attributes are useful for discriminating the individual events.
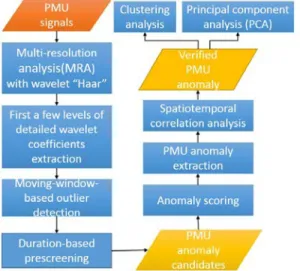
The framework of wavelet-based anomaly detection and classification is illustrated in Figure 1. In the next section, we will present the detection results using the proposed framework.
Figure 1. Wavelet-based PMU anomaly de-tection and classification framework.
3. Results
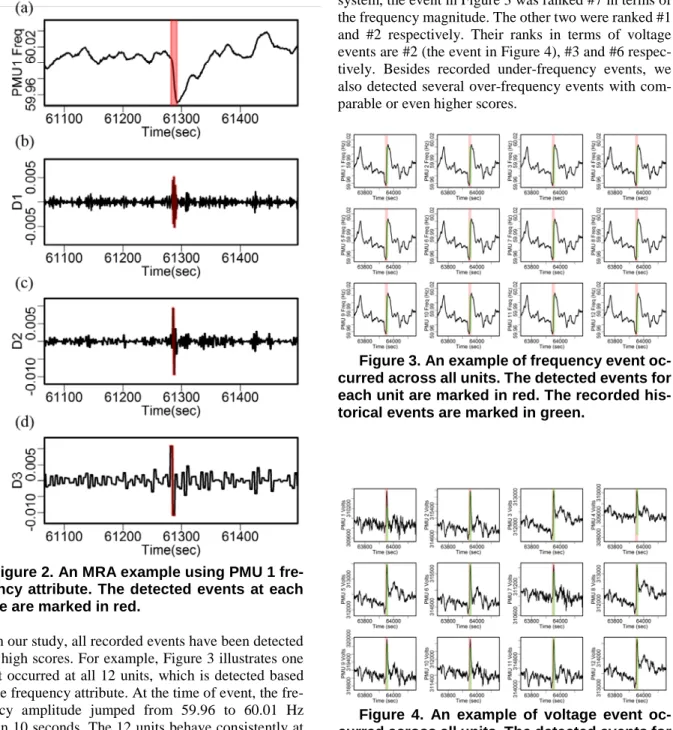
We evaluated our detection framework on the actual Western Interconnection synchrophasor data. The raw PMU signals were down-sampled to 1Hz, so the time resolution for the MRA procedure was 1 second, and the first three levels of MRA, D1, D2 and D3, have resolu-tions of 2-, 4- and 8-seconds, respectively. The 2D time-frequency representation of real-world PMUs has sig-nificant benefits compared to the regular 1D data in the time domain for event detection perspective. Figure 2 illustrates MRA and moving-window outlier detection results for the first unit of PMUs (PMU1) using the fre-quency attribute. Given the observations of the signal and detailed wavelet coefficients, the events are more evidenced from the D3, D2, and D1 coefficients than from the original, and it thus helps to increase event lo-calization accuracy. This increase with detail coeffi-cients is the key-component of our event detection algo-rithm. The recorded historical events were marked in red in Figure 2(a), which shows that the anomalous candi-dates have been identified at each resolution level using our detection framework.
In this study, we used a 30-day real-world PMU da-taset to test the framework, with 32 historical events that were recorded during the 30-day testing time period. We analyzed four attributes, including the voltage, angle variation, frequency and ROCOF for each PMU dataset. In general, the ROCOF attribute has nosier signals than the rest of the attributes, and the detected candidates have weak spatiotemporal correlations. As observed in [14], ROCOF has large variance which reduces the event detection accuracy due to sensor and grid dynam-ics. The angle variation attribute contains similar (and relatively redundant) information to the frequency at-tribute because the frequency is derived from the angel variation. Therefore, it is warranted to focus on the volt-age and frequency attributes for event detection in this evaluation.
Figure 2. An MRA example using PMU 1 fre-quency attribute. The detected events at each scale are marked in red.
In our study, all recorded events have been detected with high scores. For example, Figure 3 illustrates one event occurred at all 12 units, which is detected based on the frequency attribute. At the time of event, the fre-quency amplitude jumped from 59.96 to 60.01 Hz within 10 seconds. The 12 units behave consistently at the moment of event occurrence, resulting in strong spa-tial correlations. This warrants increased situational awareness and indicates systematic behavior and area-wide situation to be monitored. The same event was also detected from the voltage attribute, with strong correla-tions across all units as shown in Figure 4. The ampli-tude of voltage for each unit increased by over 1000 Volts within 10 seconds. After the event, the voltage sta-bilized, but did not necessarily return to the same volt-age level as prior to the event.
Two other recorded historical events were reported during the same day. In fact, according to the scoring
system, the event in Figure 3 was ranked #7 in terms of the frequency magnitude. The other two were ranked #1 and #2 respectively. Their ranks in terms of voltage events are #2 (the event in Figure 4), #3 and #6 respec-tively. Besides recorded under-frequency events, we also detected several over-frequency events with com-parable or even higher scores.
Figure 3. An example of frequency event oc-curred across all units. The detected events for each unit are marked in red. The recorded his-torical events are marked in green.
Figure 4. An example of voltage event oc-curred across all units. The detected events for each unit are marked in red. The recorded his-torical events are marked in green.
Our framework also enables detection of anomalies when they are local. During another time period on the same testing day, two voltage events were detected, as shown in Figure 5, where 7 out of the 12 units did not show evidence of the same anomalies. The first event occurred at unit 9 only, and the second event happened at units 3, 5, 8 and 10, respectively. Figure 6 shows the frequency signals for the same time period as in Figure
5, with no frequency events detected, suggesting that the events that happened during this time period were mainly voltage-related. Special attention is needed for these types of events as they cannot be treated as “bad data” although the spatiotemporal correlations are rela-tively weak.
Figure 5. Two examples of voltage events detected at different local units. The detected events for each unit are marked in red. No his-torical events were recorded during this time period.
Figure 6. PMU Frequency during the same time period as Figure 6. No frequency events were detected.
PCA were applied to evaluate and classify the iden-tified events. The PCA result is illustrated in Figure 7. The left panel shows the first two principal components of three attributes (voltage, angle variation, and fre-quency). The events can be grouped easily based on the Biplot. For example, anomalies #83, #108, #109 and #142 have outstanding differences in both frequency and angle variation compared to other anomalies; while anomalies #11 and #141 have outstanding voltages among the anomalies. Another unsurprising observation is that the angle variation has a strong correlation with the frequency, and the two have redundant information
with very similar behaviors contributing mainly to the first principal component. The variability of voltage is the major contributor to the second component. By re-moving the redundant angle variation in PCA, the volt-age and frequency are nearly orthogonal factors as shown in the right panel in Figure 7. PCA helps classify the identified events to be either frequency-related or voltage-related. However, there are a few exceptions; for example, events #2, #85, #113 and #116 are clearly identifiable using both frequency and voltage factors. And three of them were actually the historical recorded events, which were detected using both voltage and fre-quency attributes.
Figure 7. PCA Biplots of detected events us-ing different PMU attributes. The historical rec-orded events are circled in blue.
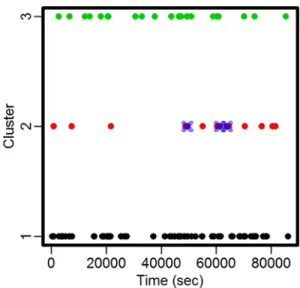
EM-clustering was used to assign the events to dif-ferent classes. The goal of EM clustering is to estimate the means and standard deviations for each cluster so as to maximize the likelihood of the observed data. The R-package mclust [39] was used for the clustering, and the optimum number of clusters was determined to be 3, based on voltage, angle difference, and frequency attrib-utes. The clustering results are shown in Figure 8. Note that the recorded actual events were all clustered into the same group (i.e., class 2) with the smallest group size. The events falling into the same class (i.e., class 2) as the recorded ones are potential events of interest. The clustering approach helps reduce the number of events, and therefore reduce the chance of false alarms. The his-torical recorded events tend to have outstanding anom-alies in terms of both voltage and frequency, and there-fore can be considered as voltage-frequency-related events, as do the events in the entire cluster 2.
Figure 8. Clustering analysis of detected events using three PMU attributes including voltage, angle variation, and frequency. The historical recorded events are marked in blue.
4. Discussion
We described and developed a PMU signal analysis framework that features a scoring system for the anom-aly detection as explained in Section 2. We also evalu-ated the effect of an alternative scoring system on our detection framework. Compared with the additive scor-ing system, the alternative multiplicative scorscor-ing system is much stricter, because the score for each MRA scale at each unit is multiplied to obtain scores of either 0 or 1. This multiplicative scoring system, reduced both the false alarm and anomaly detection rates. Future work will address techniques for enhancing the ratio of anom-aly detection over false alarms.
Wu and Xie’s work [34] shows that spatiotemporal analysis can be applied to reduce the false alarm rate ef-fectively. In general, real events have strong spatial and temporal correlation, but this is not always true due to measurement errors, bad data, and local events. Further investigation of the real-world PMU data from a variety of sources and scenarios will be needed, especially for those units/regions where local events are likely to oc-cur.
5. Acknowledgement
This study is supported by the Department of En-ergy’s Grid Modernization Laboratory Consortium (GMLC) project.
6. References
[1] A. G. Phadke and J. S. Thorp, Synchronized phasor measurements and their applications. Springer Science & Business Media, 2008.
[2] L. F. dos Santos, G. Antonova, M. Larsson, and S. Fujii, "The Use of Synchrophasors for Wide Area Monitoring of Electrical Power Grids."
[3] A. Silverstein, "An Update on the North American SynchroPhasor Initiative," Presentation May 5, 2015 2015.
[4] V. Terzija et al., "Wide-area monitoring, protection, and control of future electric power networks," Proceedings of the IEEE, vol. 99, no. 1, pp. 80-93, 2011.
[5] I. Kamwa, A. K. Pradhan, and G. Joos, "Adaptive phasor and frequency-tracking schemes for wide-area protection and control," IEEE Transactions on Power Delivery, vol. 26, no. 2, pp. 744-753, 2011. [6] O. P. Dahal and S. M. Brahma, "Preliminary work
to classify the disturbance events recorded by phasor measurement units," in Power and Energy Society General Meeting, 2012 IEEE, 2012, pp. 1-8: IEEE. [7] H. Zhu and Y. Shi, "Phasor measurement unit
placement for identifying power line outages in wide-area transmission system monitoring," in System Sciences (HICSS), 2014 47th Hawaii International Conference on, 2014, pp. 2483-2492: IEEE.
[8] D. Ghosh, C. Kumar, T. Ghose, and D. Mohanta, "Performance simulation of phasor measurement unit for wide area measurement system," in Control, Instrumentation, Energy and Communication (CIEC), 2014 International Conference on, 2014, pp. 242-245: IEEE.
[9] R. Quint, P. Etingov, D. Zhou, and D. Kosterev, "Frequency response analysis using automated tools and synchronized measurements," in Power and Energy Society General Meeting (PESGM), 2016, 2016, pp. 1-5: IEEE.
[10] S. Dasgupta, M. Paramasivam, U. Vaidya, and V. Ajjarapu, "Real-time monitoring of short-term voltage stability using PMU data," IEEE Transactions on Power Systems, vol. 28, no. 4, pp. 3702-3711, 2013.
[11] J. E. Tate and T. J. Overbye, "Line outage detection using phasor angle measurements," IEEE Transactions on Power Systems, vol. 23, no. 4, pp. 1644-1652, 2008.
[12] S. Pal, B. Sikdar, and J. Chow, "Classification and Detection of PMU Data Manipulation Attacks Using Transmission Line Parameters," IEEE Transactions on Smart Grid, 2017.
[13] S. Pal, B. Sikdar, and J. Chow, "Detecting data integrity attacks on SCADA systems using limited PMUs," in Smart Grid Communications (SmartGridComm), 2016 IEEE International Conference on, 2016, pp. 545-550: IEEE.
[14] S. A. R. Konakalla and R. de Callafon, "Optimal filtering for grid event detection from real-time
synchrophasor data," Procedia Computer Science, vol. 80, pp. 931-940, 2016.
[15] S. A. R. Konakalla and R. A. de Callafon, "Feature Based Grid Event Classification from Synchrophasor Data," Procedia Computer Science, vol. 108, pp. 1582-1591, 2017.
[16] F. Aminifar, M. Fotuhi-Firuzabad, A. Safdarian, A. Davoudi, and M. Shahidehpour, "Synchrophasor measurement technology in power systems: Panorama and state-of-the-art," IEEE Access, vol. 2, pp. 1607-1628, 2014.
[17] S. Bruno, M. De Benedictis, and M. La Scala, "" Taking the pulse" of power systems: Monitoring oscillations by wavelet analysis and Wide Area Measurement System," in Power Systems Conference and Exposition, 2006. PSCE'06. 2006 IEEE PES, 2006, pp. 436-443: IEEE.
[18] S. Mallat, A wavelet tour of signal processing. Academic press, 1999.
[19] M. Lounsbery, T. D. DeRose, and J. Warren, "Multiresolution analysis for surfaces of arbitrary topological type," ACM Transactions on Graphics (TOG), vol. 16, no. 1, pp. 34-73, 1997.
[20] J. J. Benedetto and S. Li, "The theory of multiresolution analysis frames and applications to filter banks," Applied and Computational Harmonic Analysis, vol. 5, no. 4, pp. 389-427, 1998.
[21] A. Gaouda, M. Salama, M. Sultan, and A. Chikhani, "Power quality detection and classification using wavelet-multiresolution signal decomposition," IEEE Transactions on power delivery, vol. 14, no. 4, pp. 1469-1476, 1999.
[22] V. Alarcon-Aquino and J. A. Barria, "Anomaly detection in communication networks using wavelets," IEE Proceedings-Communications, vol. 148, no. 6, pp. 355-362, 2001.
[23] W. Lu and A. A. Ghorbani, "Network anomaly detection based on wavelet analysis," EURASIP Journal on Advances in Signal Processing, vol. 2009, p. 4, 2009.
[24] H. B. Aradhye, B. R. Bakshi, J. F. Davis, and S. C. Ahalt, "Clustering in wavelet domain: A multiresolution art network for anomaly detection," AIChE journal, vol. 50, no. 10, pp. 2455-2466, 2004.
[25] W. Wang, D. Lu, X. Zhou, B. Zhang, and J. Mu, "Statistical wavelet-based anomaly detection in big data with compressive sensing," EURASIP Journal on Wireless Communications and Networking, vol. 2013, no. 1, p. 269, 2013.
[26] M. H. Bhuyan, D. K. Bhattacharyya, and J. K. Kalita, "Network anomaly detection: methods,
systems and tools," Ieee communications surveys & tutorials, vol. 16, no. 1, pp. 303-336, 2014. [27] S. G. Mallat, "A theory for multiresolution signal
decomposition: the wavelet representation," IEEE transactions on pattern analysis and machine intelligence, vol. 11, no. 7, pp. 674-693, 1989. [28] C. S. Burrus, R. A. Gopinath, and H. Guo,
"Introduction to wavelets and wavelet transforms: a primer," 1997.
[29] Y. Meyer, "Principe d'incertitude, bases hilbertiennes et algebres d'operateurs," Séminaire Bourbaki, vol. 28, pp. 209-223, 1985.
[30] S. Avdaković and N. Čišija, "Wavelets as a tool for power system dynamic events analysis–State-of-the-art and future applications," Journal of Electrical Systems and Information Technology, vol. 2, no. 1, pp. 47-57, 2015.
[31] I. Daubechies, Ten lectures on wavelets. SIAM, 1992.
[32] T. Faris, "BPA Synchrophasor Lab Tools," WECC JSIS meeting, September, 2016, vol. [Online] Available:
https://www.wecc.biz/Administrative/18%20BPA %20SP%20LabTools-2016_09.pdf.
[33] "IEEE Standard for Synchrophasor Data Transfer for Power Systems," IEEE Std C37.118.2-2011 (Revision of IEEE Std C37.118-2005), pp. 1-53, 2011.
[34] M. Wu and L. Xie, "Online Detection of Low-Quality Synchrophasor Measurements: A Data Driven Approach," IEEE Transactions on Power Systems, 2016.
[35] A. P. Dempster, N. M. Laird, and D. B. Rubin, "Maximum likelihood from incomplete data via the EM algorithm," Journal of the royal statistical society. Series B (methodological), pp. 1-38, 1977. [36] R. A. Redner and H. F. Walker, "Mixture densities,
maximum likelihood and the EM algorithm," SIAM review, vol. 26, no. 2, pp. 195-239, 1984.
[37] C. Fraley and A. E. Raftery, "MCLUST: Software for model-based cluster analysis," Journal of classification, vol. 16, no. 2, pp. 297-306, 1999. [38] C. Fraley and A. E. Raftery, "Bayesian
regularization for normal mixture estimation and model-based clustering," Journal of classification, vol. 24, no. 2, pp. 155-181, 2007.
[39] C. Fraley and A. E. Raftery, "MCLUST version 3: an R package for normal mixture modeling and model-based clustering," DTIC Document2006.