Computational Methods for the Analysis of
Mass Spectrometry Imaging Data
Dissertation
zur Erlangung des akademischen Grades
doctor rerum naturalium (Dr. rer. nat.)
vorgelegt dem Rat der Fakult¨at f¨ur Mathematik und Informatik der Friedrich-Schiller-Universit¨at Jena
von M.Sc. Purva Kulkarni
Gutachter:
1. Prof. Dr. Sebastian B¨ocker, Friedrich-Schiller-Universit¨at Jena
2. Dr. Aleˇs Svatoˇs, Max Planck Institute for Chemical Ecology Jena
3. Prof. Dr. Manja Marz, Friedrich-Schiller-Universit¨at Jena
Tag der ¨offentlichen Verteidigung: 17. September 2018
Abstract
Several thousand biochemical reactions occur in a living system. The low molecular weight organic compounds that take part in, or are formed by, these reactions are called metabolitesand their study is known asmetabolomics. System-wide comprehensive char-acterization of metabolites in an organism is crucial for understanding cellular function. Metabolites cover a wide range of compound classes and exhibit large structural diver-sity. A vast majority of these metabolites are still unknown and identifying them is a bottleneck. This physicochemical diversity of metabolites necessitates the application of different complementary analytical methods for their detection and identification. Mass spectrometry (MS) is one such method that provides unmatched capabilities for the detection and identification of analytes. It is being extensively applied for metabolomics in the recent years. A powerful enhancement to MS-based detection is the addition of spatial information to the chemical data; an approach called mass spectrometry imag-ing (MSI). This label-free, non-targeted technique generates a series of localized mass spectra from discrete positions on the imaged sample, thereby providing comprehensive information on molecular composition as well as spatial distribution in a single exper-iment. MSI enables two- and three-dimensional overviews of hundreds of molecular species over a wide mass range in complex biological samples.
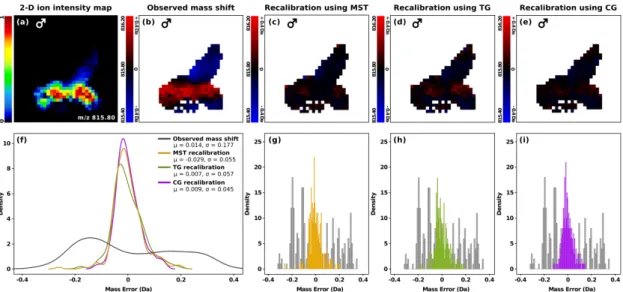
With constant advancements in spectral and spatial resolution and also depending on the biological sample analyzed, a single MSI experiment is capable to generate large amounts of multi-dimensional data. The localization of a specific ion species across the imaged sample can be visualized by creating an ion intensity map. The manual exploration and interpretation of such data, however, is far from simple. To harness the full potential of the acquired data, there is a strong need for robust computational approaches that can extract valuable chemical information captured in a single experiment. In this work, we present two computational methods and a workflow that address three different aspects of MSI data analysis: correction of mass shifts, unsupervised exploration of the data and importance of preprocessing and chemometrics to extract meaningful information from the data.
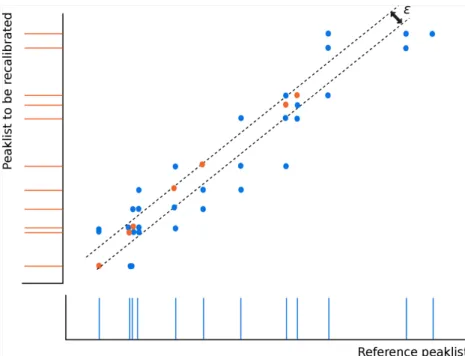
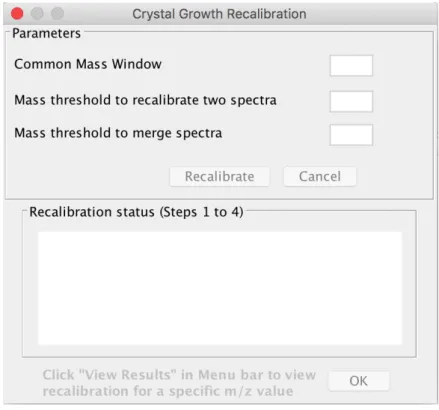
High mass accuracy of the acquired MS data is of prime importance for confident peak annotation. However, this can be compromised due to several factors, leading to mass errors. In the first part of this thesis, we introduce a new lock mass-free recalibration procedure that enables to significantly reduce these mass shift effects in MSI data. Our method exploits similarities amongst peaklist pairs and takes advantage of the spatial context in three different ways, to perform mass correction in an iterative manner. Evaluation of our method showed considerable reduction in the mass shifts for different datasets. As an extension of this work, we also present a Java-based tool,MSICorrect, that implements our recalibration approach and also allows data visualization.
In the next part, an unsupervised approach to rank ion intensity maps based on the abundance of their spatial pattern is presented. In current practice, the predominant approach to analyze MSI datasets is either looking at ion intensity maps to visualize the distribution of specific masses of interest or using data-mining methods. However, this conventional approach can prove extremely challenging and labor-intensive in getting an overview of the measured masses or to explore the distribution of unknown compounds. There is an acute need for methods that allow untargeted and exploratory analysis of MSI data. The method presented in this thesis is our first attempt in this direction. Our method provides a score to every ion intensity map based on the abundance of spatial pattern present in it and then ranks all the maps using it. To know which masses
iv
exhibit similar spatial distribution, our method uses spatial-similarity based grouping to provide lists of masses that exhibit similar distribution patterns. Results for ranking and spatial-similarity based grouping show a good agreement with visual observations. In the last part, we demonstrate the application of a data preprocessing and multivari-ate analysis pipeline to a real-world biological dataset. An optimal data preprocessing strategy is the key to obtain reliable statistical interpretation of the data. It is critical to judge and select the right preprocessing and multivariate analysis algorithms based on the nature of the data. We demonstrate this by applying the full pipeline to a high-resolution MSI dataset acquired from the leaf surface of Black cottonwood ( Popu-lus trichocarpa). Application of the pipeline helped in highlighting and visualizing the chemical specificity on the leaf surface.
The computational solutions introduced in this thesis address different issues that are encountered while analyzing MSI data. The main advantages of our presented recali-bration method are that mass correction is robust against outliers, is not dependent on the presence of a lock-mass (namely internal or external calibrant) and can be applied to datasets that have a varying degree of mass shift across the imaged sample. Our spatial pattern extraction and image ranking approach allows to quickly explore large MSI datasets, without any expert knowledge. Lastly, the data analysis workflow pre-sented can guide researchers to select appropriate preprocessing and statistical methods for their MSI data. Thus, application of the presented methods will be helpful to im-prove mass accuracy, in turn enabling reliable compound annotation and they also hold the potential for use in untargeted studies, further aiding in the identification of novel biomarkers.
Zusammenfassung
In einem lebenden System treten tausende biochemische Reaktionen auf. Zum Verst¨ and-nis der einzelnen zellul¨aren Abl¨aufe ist es entscheidend, die auftretenden Substanzen um-fassend und systemweit zu charakterisieren. Die niedermolekularen organischen Verbind-ungen, die an diesen Prozessen beteiligt sind bzw. dabei entstehen, werden als Metabo-lite bezeichnet. Das zugeh¨orige Forschungsgebiet heißt Metabolomics.
Die bisher bekannten Metabolite weisen eine große strukturelle Diversit¨at auf, weswe-gen sie zu einer Vielzahl unterschiedlicher Substanzklassen geh¨oren. Es muss beachtet werden, dass ein Großteil dieser Verbindungen noch immer unbekannt und die struk-turelle Charakterisierung sehr schwierig sind. Aus diesem Grund ist die Anwendung von verschiedenen komplement¨aren Analysemethoden zur Detektion und Identifizierung der Metabolite n¨otig.
Die Massenspektrometrie (MS) weist hierf¨ur un¨ubertroffene F¨ahigkeiten zur Analyse von niedermolekularen organischen Verbindungen auf und wird mittlerweile routinem¨aig im Bereich Metabolomics eingesetzt. Eine wichtige Erweiterung zur massenbasierten Detektion ist hierbei die sogenannte bildgebende Massenspektrometrie (MSI), welche neben den chemischen Daten auch Informationen zur r¨aumlichen Verteilung liefert. Diese Non-Target-Technik kommt ohne chemische Markierungen aus und generiert inner-halb eines einzigen Experiments eine Serie von Massespektren f¨ur eine diskrete Position auf der zu untersuchenden Probe. MSI erm¨oglicht einen zwei- und dreidimensionalen
¨
Uberblick zur r¨aumlichen Verteilung von hunderten molekularen Spezies innerhalb eines großen Massenbereichs in komplexen biologischen Proben. W¨ahrend eines einzigen MSI-Experiments wird in Abh¨angigkeit vom Gewebe eine riesige Menge multidimensionaler Daten generiert. Diese vergr¨oßert sich auch durch die st¨andige Weiterentwicklung in der spektralen und r¨aumlichen Aufl¨osung. Die Lokalisierung der einzelnen Ionenspezies ¨
uber die gesamte Probe l¨asst sich mithilfe einer sogenannten Ionenintensit¨atskarte (ion intensity map) visualisieren. Dennoch sind die manuelle Auswertung und Interpretation dieser Messdaten beraus aufwendig und kompliziert. Um das tats¨achliche Potential der Analysen auszusch¨opfen, werden robuste Berechnungsans¨atze ben¨otigt, die die wertvolle chemische Information aus den Daten eines einzigen Experiments extrahieren k¨onnen. In der vorliegenden Arbeit pr¨asentieren wir zwei Berechnungsmethoden und einen Work-flow, die sich an drei verschiedene Probleme der MSI-Datenauswertung richten. Dazu geh¨oren die Korrektur von Masseverschiebungen (mass shifts), die nicht-¨uberwachte Datenauswertung sowie die essentielle Rolle von Datenvorbehandlung und Chemometrik zur Extraktion von sinnvollen Informationen aus den vorliegenden Daten.
Die hohe Massengenauigkeit der aufgenommenen Daten ist f¨ur die sichere Peakzuord-nung besonders wichtig. Dennoch kann sie durch verschiedene Faktoren gest¨ort wer-den, woraus Massefehler resultieren. Wir stellen im ersten Teil der Arbeit eine neue Methode zur Rekalibration vor, die ohne Lock-Masse (Sperrmasse) auskommt und eine signifikante Reduktion von Masseverschiebungseffekten in MSI-Daten erm¨oglicht. Diese Methode bezieht ¨Ahnlichkeiten zwischen Paaren in den Peaklisten ein und nutzt den r¨aumlichen Kontext auf drei verschiedenen Wegen, um die Massenkorrektur iterativ durchzuf¨uhren. Die Anwendung unserer Methode auf verschiedene Datenstze zeigte eine betr¨achtliche Reduktion von Masseverschiebungen. Weiterhin stellen wir ein Java-basiertes Tool MSICorrect vor, das einerseits unseren Rekalibrationsansatz beinhaltet und gleichzeitig Datenvisualisierung erlaubt.
Im zweiten Teil wird ein nicht-¨uberwachter Ansatz vorgestellt, der die Ionenintensit¨ atska-rten nach der H¨aufigkeit ihrer r¨aumlichen Muster ordnet. Gegenw¨artig wird die Analyse
vi
von MSI-Daten vorrangig mithilfe von Visualisierung der Massespeziesverteilung anhand der Ionenintensit¨atskarten oder mittels Methoden zum Data-Mining durchgef¨uhrt. Den-noch sind diese herk¨ommlichen Herangehensweisen sehr herausfordernd und arbeitsin-tensiv, wenn ein ¨Uberblick ¨uber die gemessenen Massen gewonnen oder die Verteilung von unbekannten Verbindungen untersucht werden sollen. Daher besteht eine akute Nachfrage an Methoden, die Non-Target- und explorative MSI-Datenanalysen erm¨ ogli-chen. Die in der vorliegenden Arbeit vorgestellte Methode ist unser erster Vorstoß in dieses Forschungsgebiet. Sie ermittelt basierend auf der H¨aufigkeit der enthaltenen r¨aumlichen Muster einen Wert f¨ur jede Ionenintensit¨atskarte und ordnet sie anhand dessen anschließend in eine Rangliste ein. Um festzustellen, welche Massen ¨ahnliche Verteilungen aufweisen, nutzt unsere Methode auf r¨aumlicher ¨Ahnlichkeit basierende Gruppierung. So k¨onnen Listen mit Massen ¨ahnlicher Verteilungsmuster generiert wer-den. Die Ergebnisse aus diesen Vorgehensweisen zeigen eine gute ¨Ubereinstimmung mit visuellen Beobachtungen.
Im letzten Teil der Arbeit demonstrieren wir die Anwendung eines Workflows zur Daten-vorbehandlung und zur multivariaten Analyse auf einen realen biologischen Datensatz. Eine optimale Datenvorbehandlung ist der Schl¨ussel, um eine zuverl¨assige statistische Interpretation zu erm¨oglichen. Es ist entscheidend, anhand der tats¨achlich vorliegenden Daten zu beurteilen, welche Algorithmen zur Datenvorbehandlung und zur multivari-aten Analyse ausgew¨ahlt werden sollten. Wir demonstrieren diesen Sachverhalt durch Anwendung des kompletten Workflows auf einen hochaufgel¨osten MSI-Datensatz einer Laubblattoberfl¨ache der Westlichen Balsampappel (Populus trichocarpa). Es konnte gezeigt werden, dass dieser Workflow dabei hilft die chemische Spezifit¨at auf der Laub-blattoberfl¨ache hervorzuheben und zu visualisieren.
Die in dieser Arbeit vorgestellten Berechnungsmethoden befassen sich mit verschiedenen Problemen, die bei der Analyse von MSI-Daten auftreten. Die wesentlichen Vorteile unserer Rekalibrierungsmethode bestehen darin, dass die Massekorrektur gegen¨uber Ausreißern robust und außerdem unabh¨angig von einer Lock-Masse (externer oder in-terner Kalibrant) ist sowie auch auf Datens¨atze angewendet werden kann, die einen variierenden Grad an Masseverschiebungen ¨uber die gesamte Probe aufweisen. Un-sere r¨aumliche Musterextraktion und unser Ansatz zum Image-Ranking erlauben es, große MSI-Datens¨atze ohne Expertenwissen zu untersuchen. Weiterhin unterst¨utzt der vorgestellte Workflow zur Datenanalyse Wissenschaftlern darin, angemessene Datenvor-behandlungen und statistische Methoden f¨ur die jeweiligen MSI-Daten auszuw¨ahlen. Somit kann die zuk¨unftige Anwendung der hier vorgestellten Methoden dazu beitragen, die Massengenauigkeit zu verbessern und gleichzeitig die zuverl¨assige Peakzuordnung zu erm¨oglichen. Weiterhin bergen unsere Methoden ein großes Potential f¨ur die Anwen-dung bei Non-Target-Analysen, insbesondere f¨ur die Identifizierung bisher unbekannter Biomarker.
To my grandparents
Malini and Madhav Sarwate
whose selfless mentoring and inspiration put me on the path
to where I am today
Acknowledgments
It takes a village to raise a PhD student!
It was Thursday, January 17th, 2013, when I arrived in snow-cladded Jena to start my doctoral studies at the Lehrstuhl f¨ur Bioinformatik, Friedrich Schiller University. Looking back over all these years, I can certainly say that I learned a lot; experienced a new culture that widened my perspective, gained scientific knowledge as well as worked and made friends with some amazing people around me, who still continue to inspire and support me in my journey ahead. This thesis appears in its current form due to the assistance and valuable guidance of several people, both on academic and personal front. I would therefore like to offer my sincere thanks to all of them.
I would primarily like to thank my supervisor Prof. Dr. Sebastian B¨ocker for accepting me as a PhD student within his group and for all his invaluable mentoring, insightful discussions and critical comments, during my PhD pursuit. I would also like to offer my sincere thanks to him for providing me manifold opportunities for interdisciplinary collaborations as well as financial aid to attend various workshops and conferences. I would also like to express my deepest gratitude to my second supervisor Dr. Aleˇs Svatoˇs for his intellectual input, continuous encouragement throughout the course of my PhD as well as for a few months of financial aid during the final stages of my PhD work. Thanks also to Dr. Filip Kaftan (MPI-CE, Jena) for a successful collaboration and for providing me multiple datasets from time to time. Further thanks goes to former diploma student Phillip Kynast, who laid the initial foundation for the recalibration algorithm that I have worked on during my PhD. I would also like to thank my other collaborators - Prof. Wilhelm Boland and Mina Dost (MPI-CE Jena, Germany) for sharing their scientific vision and considering me capable to design the analysis pipeline for their imaging data.
I have also greatly benefited from many fruitful and inspiring discussions with my present and former colleagues at the Lehrstuhl f¨ur Bioinformatik, specially Franziska Hufsky, Martin Engler, Markus Fleischauer, Marcus Ludwig, Kai D¨uhrkop, Tim White and Sascha Winter. I would especially like to thank my office mates Markus Fleischauer and Marcus Ludwig for a fun and wonderful camaraderie since the time I started my PhD. I am also thankful to them for being ever-ready to help me with technical issues, non-scientific issues and with German translations. A special thanks also goes to Kathrin Schowtka for taking care of all the bureaucratic and administrative formalities.
Moreover, I am very grateful for the generous financial support received from the Inter-national Max Planck Research School, the Jena School for Microbial Ecology, the Max Planck Society and the University of Jena. I would also like to gratefully acknowledge the training sessions provided by the International Max Planck Research School and the Jena Graduate Academy that helped me gain additional skill sets.
I warmly appreciate the time and effort of Kumar Saurabh Singh, Anne-Christin Warsku-lat, Franziska Hufsky, Tim White and Riya Christina Menezes for proofreading parts of this thesis and giving advices to improve legibility. A special thanks to Christoph Zimmer and Anne-Christin Warskulat for helping me translate the abstract to German. I am immensely grateful to my friends here in Jena: Karen, Anne-Christin, Jelena, Verena, Garima, Dinesh, Rajarajan, Arpita, Kamlesh, Priya, Rakesh, Govind and Sneha, for keeping me sane and for being there to listen and share all the highs and lows of this journey. A big thank you for all the supportive hugs during the trying times.
x
Finally, I owe my deepest gratitude to my grandparents, my mentors, without whom this would have not started in the first place. My parents Jyoti and Bhalchandra Kulkarni deserve a particular note of thanks for their endless support and love, for never ques-tioning me no matter how implausible my decisions seemed and for strongly believing in my dreams and letting me achieve them. I feel immensely lucky to have such a backing! I am also very thankful to my in-laws as well as my extended family for being very supportive.
Last, but not the least, I’m truly grateful to mypartner in science and in life, Saurabh. For just everything. We made it possible despite the distance!
Contents
Preface xiii
1 Introduction 1
1.1 Emerging technologies to visualize and explore biological systems . . . 1
1.2 Contribution and scope of this thesis . . . 2
2 An overview of analytical and technological concepts 5 2.1 Biomolecules . . . 5 2.2 Mass spectrometry . . . 6 2.2.1 Sample inlet . . . 7 2.2.2 Ion source . . . 8 2.2.3 Mass analyzer . . . 8 2.2.4 Detector . . . 11 2.2.5 Mass spectrum . . . 11
2.3 Mass spectrometry imaging . . . 11
2.3.1 Techniques . . . 12
2.3.2 Data features, computational aspects and visualization . . . 16
2.3.3 Applications of mass spectrometry imaging . . . 17
3 Computational processing and analysis of MSI data 19 3.1 Overview of the data analysis workflow . . . 19
3.2 Data import and conversion . . . 20
3.3 Spectral data preprocessing . . . 20
3.3.1 Smoothing . . . 21
3.3.2 Baseline correction . . . 22
3.3.3 Normalization . . . 23
3.3.4 Peak picking . . . 25
3.3.5 Spectral recalibration . . . 26
3.4 Dimensionality reduction and unsupervised data mining . . . 26
3.4.1 Component analysis . . . 27
3.4.2 Cluster analysis . . . 29
3.5 Biological interpretation and further studies . . . 32
3.5.1 Molecular identification . . . 32
3.5.2 Supervised classification . . . 33
3.5.3 Combination with other imaging modalities . . . 33
4 Recalibration of mass spectrometry imaging data 35 4.1 Mass shifts and their correction . . . 35
4.2 Previous contributions . . . 36
4.3 Lock mass-free recalibration . . . 37
4.3.1 Spectral similarity measure . . . 38
4.3.2 Spectral ordering approaches . . . 38
4.3.2.1 Minimum spanning tree ordering . . . 38
4.3.2.2 Topological greedy ordering . . . 39 xi
xii CONTENTS
4.3.2.3 Crystal growth ordering . . . 40
4.3.3 Recalibrating a pair of peaklists . . . 41
4.3.4 Generation of consensus spectrum . . . 42
4.3.5 Final correction . . . 43
4.4 Evaluation of mass shift correction . . . 43
4.4.1 Experimental datasets . . . 43
4.4.2 Data acquisition and processing . . . 43
4.4.3 Recalibration accuracy and performance . . . 44
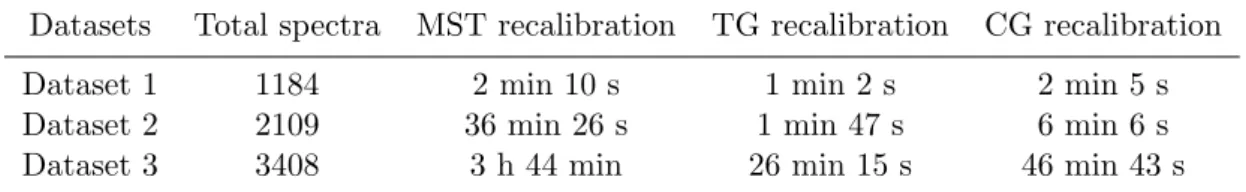
4.4.4 Evaluation of running times . . . 47
5 MSICorrect: Mass spectrometry imaging data recalibration tool 49 5.1 Graphical user interface . . . 49
5.2 Data import . . . 51
5.3 Lock mass-free recalibration . . . 51
5.4 Visualization of recalibration results . . . 52
6 Towards an automated method to characterize biologically relevant spatial patterns in MSI data 53 6.1 Image processing and pattern extraction . . . 53
6.2 Previous contributions . . . 54
6.3 Our pattern extraction and image ranking approach . . . 54
6.3.1 Image Content score for an ion intensity map . . . 55
6.3.2 Selection of an image threshold . . . 56
6.3.3 Spatial similarity-based grouping of ion intensity maps . . . 57
6.4 Evaluation of our pattern extraction and image-ranking approach . . . 58
6.4.1 Experimental datasets . . . 58
6.4.2 Method performance . . . 59
6.4.3 Evaluation of running times . . . 62
7 Preprocessing and multivariate analysis of TOF-SIMS imaging data 65 7.1 Introduction . . . 65
7.2 TOF-SIMS imaging . . . 66
7.3 Data processing and analysis . . . 66
7.3.1 Data preprocessing . . . 68
7.3.2 Multivariate analysis and clustering . . . 68
7.4 Results . . . 69
8 Conclusion 77
A Supplementary information for Chapter 4 97
B Supplementary information for Chapter 6 105
Preface
This dissertation covers large parts of my research in method development and analysis of mass spectrometry imaging data, for the last four years. During this time, I was working at the Bioinformatics Group of Professor Sebastian B¨ocker at the Friedrich-Schiller Universit¨at, Jena and for a short period at the Mass Spectrometry Group of Dr. Aleˇs Svatoˇs at the Max Planck for Chemical Ecology, Jena. My research was financed by a scholarship from the International Max Planck Research School, Jena and later by the Jena School of Microbial Ecology, the Max Planck Society and university’s basic funding.
Most of the results presented in this work are published [1–3] and have been achieved in cooperation with my supervisor Sebastian B¨ocker and our main collaborators Aleˇs Svatoˇs, Filip Kaftan, Wilhelm Boland, Mina Dost and former diploma student Philipp Kynast. I also participated in developing a method to read and create ion intensity maps from the data acquired using laser ablation electrospray ionization mass spectrometry imaging of non-flat biological samples [4]. This work was performed in collaboration with Aleˇs Svatoˇs and Benjamin Bartels. I was also involved in analyzing bacterial metabolomics data generated from liquid extraction surface analysis combined with high resolution mass spectrometry. This work was performed in collaboration with Aleˇs Svatoˇs, Paolina Garbeva and Riya Christina Menezes.
This thesis consists of seven chapters. The main results of this thesis are presented in Chapters 4,5, 6 and 7.
Chapter 4 presents a new recalibration method for mass spectrometry imaging data and has been published [1]. Sebastian B¨ocker had the basic idea for the method and I participated in developing it further. The method encompasses three mass spectral ordering approaches. One of the ordering approaches was initially developed by Philipp Kynast for his diploma thesis [5], but later was improved and re-implemented by me, along with developing and implementing the other two approaches. The approach for recalibrating two mass spectra is based on the Maximum Line-Pair stabbing algorithm developed by B¨ocker and M¨akinen [6]. Evaluation of the recalibration method was performed by me on multiple imaging datasets provided by Aleˇs Svatoˇs and Filip Kaftan. The recalibration method was presented by me at the 3rd Mass Spectrometry Imaging Conference (OurCon 2015).
Chapter 5 presents a tool, named MSICorrect, for visualization and recalibration of mass spectrometry imaging data. For recalibration, the tool implements the method described in Chapter 4. Implementation of the graphical user interface and different data visualization functions was performed by me. Furthermore, I also performed the evaluation of MSICorrect using the datasets provided by Aleˇs Svatoˇs and Filip Kaftan. Chapter 6 presents a simplistic method to computationally identify spatial patterns visible in ion intensity maps generated using mass spectrometry imaging data in a un-supervised manner. I designed the basic concept of the approach with valuable inputs from Sebastian B¨ocker and my colleague Tim White, which I also implemented. The complete evaluation of the approach was performed by me using publicly available mass spectrometry imaging datasets.
In Chapter 7, a use-case of a typical mass spectrometry imaging data analysis work flow [3] is described. This work was performed in collaboration with Aleˇs Svatoˇs, Wil-helm Boland and Mina Dost, wherein the data was provided by Mina Dost. I designed the complete analysis pipeline, which utilizes existing data processing and chemometric
xiv CONTENTS
approaches. I also analyzed the acquired data using the designed pipeline to achieve biological conclusions.
For the remainder of this thesis, I will use “we” as the first person pronoun, as it is common in scientific literature. This may be interpreted as “the reader and I” or as “my collaborators and I”, whichever suits best in the situation.
Publications resulting from this work
Large parts of the research presented in this thesis can also be found in the following publications:
Published/Accepted
• P. Kulkarni, M. Dost, O.D. Bulut, A. Welle; S. B¨ocker, W. Boland, A. Svatoˇs. Secondary ion mass spectrometry imaging and multivariate data analysis reveal co-aggregation patterns of Populus trichocarpa leaf surface compounds on a mi-crometer scaleThe Plant Journal,Accepted for publication Oct 2017.
• P. Kulkarni, F. Kaftan, P. Kynast, A. Svatoˇs, S. B¨ocker. Correcting mass shifts: A lock-mass-free recalibration procedure for mass spectrometry imaging dataAnal Bioanal Chem, 405, 7603-7613, 2015.
• F. Kaftan, V. Vrkoslav, P. Kynast,P. Kulkarni, S. B¨ocker, J. Cvaˇcka, M. Knaden, and A. Svatoˇs. Mass Spectrometry Imaging of Surface Lipids on IntactDrosophila melanogaster flies J Mass Spectrom, 49, 223-232, 2014.
Submitted
• F. Kaftan,P. Kulkarni, M. Knaden, S. B¨ocker, S, A. Svatoˇs. Drosophila melanogaster chemical ecology revisited: 2-D distribution maps of sex pheromones on whole vir-gin and copulated flies by mass spectrometry imavir-gingSubmitted to BMC Biology, 2017.
Other publications not part of this thesis
• B. Bartels, P. Kulkarni, S. B¨ocker, A. Svatoˇs. Mapping metabolites from rough terrain: laser ablation electrospray ionization on non-flat samples RSC Advances, 7, 9045-9050, 2016.
Chapter 1
Introduction
Science is to see what everyone else has seen, but think what no one else has thought.
– Albert Szent-Gyorgyi
1.1
Emerging technologies to visualize and explore
biologi-cal systems
In the early 1950s, when Watson and Crick identified the structure of DNA, molecular-level understanding of biology started emerging. Genome-based studies became the main focus of life sciences post this. Exactly 50 years after the discovery of DNA, with the completion of the Human Genome Project [7] in April 2003, it however be-came clear that complex cellular processes are regulated more on other levels than the DNA sequence alone. This realization triggered the rapid growth of numerous fields in molecular biology that together are now termed as “omics”technologies. This omics cascade [8] encompasses within itself: genomics, focusing on the systematic study of an organism’s genome; transcriptomics which studies the global change of gene expression at mRNA level [9]; proteomics that involves systematic identification of all proteins ex-pressed in a cell or tissue [10] and lastly metabolomics that involves characterization of the metabolome of an organism.
Metabolome is the final downstream product of the genome and is considered closest to the phenotype [11]. Analogous to the terms ‘genome’, ‘transcriptome’ and ‘proteome’, the metabolome refers to the complete set of small molecules, termed asmetabolites, pro-duced by a cell, as a result of its metabolism. These include, but are not limited to lipids, sugars, metabolic intermediates, products of biochemical reactions as well as building blocks including proteins, nucleic acids and cell membranes [12]. The metabolome is a highly complex and dynamic system where the concentration of each metabolite depends strictly on changes in the physiological conditions of the cell, induced in response to en-vironmental or developmental stimuli and many such factors. Studying the metabolome can help in providing comprehensive and simultaneous understanding of the changes occurring in a system at the cellular level, in turn aiding in the characterization of at-tractive candidates to understand disease phenotypes [13]. However, the heterogeneity of the metabolome of an organism is much more complex, when compared to combi-nations of four nucleotide bases in the DNA sequence and 20 amino acids in a protein. This complexity is further enhanced when a wide variety of small molecules are produced through metabolism, having diverse atomic configurations.
With inception of the omics era, there has been an ever increasing demand to iden-tify and characterize variation within biological systems. This has led to the advent of several high-throughput screening techniques with essential attributes like high sen-sitivity, throughput, robustness, linear range of quantification and cost efficiency. Ge-nomics and transcriptomics studies routinely use well-established microarray and next-generation sequencing technologies whereas core proteomics technologies include mass
2 1. Introduction
spectrometry(MS)-based methods to define the protein sequence, study protein:protein interactions and post-translational modifications [14]. As for metabolomics, owing to its complexity, it is essential to use strategies that have a wider coverage in terms of the type and number of metabolites analyzed. MS-based analysis following chromatographic separation and Nuclear Magnetic Resonance (NMR) spectroscopy have played a central role in metabolomics [15], owing to their high sensitivity and resolution, enabling fast identification of a wide range of species. Although NMR allows absolute quantification and precise structural determination in a non-destructive manner, it has shown to have low sensitivity when compared to MS-based techniques [16]. This has allowed MS-based approaches to emerge as the foremost technology of the time, for metabolomics [17]. MS-based metabolomics can provide highly valuable information for a wide range of metabolites, aiding in novel compound discovery to clinical application. However, one needs to remember that in order to understand a biological system in exquisite detail, it is also important to study the molecular entities in their spatial context, owing to their dynamic nature as well as high temporal and spatial variability. And, as the old adage goes; “a picture is worth a thousand words”, is no less true here. In regards to metabolomics, a picture can act as an apt means to mirror the intrinsic complexity and convey detailed and immediate information about the distribution and localization of metabolites on a biological sample. Imaging techniques like fluorescence microscopy, atomic force microscopy, positron tomography, infrared and Raman imaging have been used as fundamental tools in molecular imaging to investigate molecular distributions bothin vivo andin vitro. These techniques are capable of generating images with spatial resolution sometimes approaching the atomic scale. However, most of these techniques require analyte pre-selection, labeling or specific markers and are not suitable to detect a wide range of compounds, thereby limiting their utility for molecular discovery [18]. Mass spectrometry-based imaging (MSI) techniques offer distinct advantages over these methods.
Application of the MSI technique commenced in 1997, with the pioneering work per-formed in the laboratory of Professor Richard M. Caprioli. Here they applied MSI to simultaneously study the localization of hundreds of peptides in a biological tissue sam-ple, without prior knowledge and without labeling [19]. The allure of MSI is its ability to collect molecular ‘snapshots’ of a given biological sample, in the form of mass spectra from every single coordinate position on the sample and superimpose this molecular information onto optical, fluorescence or histological images. Developments in instru-mentation have further improved this technique that has led to the current widespread application of MSI in different areas of biological sciences. Since MSI generates molec-ular images showing the distribution of ion species on the imaged sample, it enables to connect observations at the phenotypic level with specific changes at the chemical level [20].
Routine metabolomics analysis using MS itself generates avalanches of biological data, often up to multiple gigabytes, presenting immense problems in terms of its use. When using MSI, this complexity is further enhanced in terms dimensionality, rendering a direct manual analysis extremely challenging and practically infeasible. This makes the analysis of such data highly dependent on modern bioinformatics approaches.
1.2
Contribution and scope of this thesis
Converting multi-dimensional MSI data into information requires efficient computational methods. As the popularity of MSI is increasing, the need for computational methods
1.2 Contribution and scope of this thesis 3
tailored to the special needs of the field, is surging as well. Apart from commercial software like SCiLSLab (SCiLS, Bremen, Germany) or the ones bundled with mass spectrometers, open source packages like MALDIquant by Gibbet al., CARDINAL by Bemis et al. and many more are also available. These tools mainly incorporate meth-ods for preprocessing, visualization and multivariate statistical analysis so as to identify important features in the MSI data. Since this field is still relatively young, there is substantial scope to develop novel methods that can address additional challenges that arise when working with MSI data. Several groups are developing efficient approaches to aid in data compression [21], spatial segmentation [22], normalization [23] and also im-proving standard methods like principal component analysis to accommodate the spatial nature of MSI data [24]. These new methods can be integrated within existing prepro-cessing pipelines to help in precise identification, feature selection and in improving the overall analysis performance.
In this thesis, we focus on one such issue: mass accuracy. To aid in accurate compound annotation, it is essential to have high mass accuracy in MSI data. But, this can be compromised due to several factors leading to mass errors. In this direction, we develop and deploy a computational approach that is helpful in reducing mass shifts in MSI data.
Further, taking our first few steps towards automated feature identification, we present a basic approach that performs unsupervised feature identification in high-dimensional MSI data. We then discuss the application of a data analysis workflow to a real world MSI dataset, highlighting the importance of method selection, based on the nature of the data.
To present the methods and the analysis pipeline, this thesis is structured as follows: In Chapter 2, we start with introducing the main analytical and technological concepts of MS-based approaches. Chapter 3 covers the computational aspects, data preprocessing workflows and chemometric methods that are commonly employed in analyzing and interpreting MSI datasets.
In Chapter 4, we describe our computational recalibration method, that helps in reducing mass shifts in the data. Our method performs recalibration on the MSI spectra without the use of any reference spectrum or presence of any external or internal calibrant, making the method completely independent of these factors. We then evaluate the performance of our method by applying it to reduce mass shifts present in three MSI datasets and further discuss the performance of our method in terms of amount of mass shift correction and processing time.
In Chapter 5, we present our MSI data recalibration and visualization tool,MSICorrect. It is an easy-to-use, Java-based application, which provides an organized interface to vi-sualize MSI data for user-selected mass values in the form of pseudo-colored ion intensity maps. Apart from this, the tool offers the functionality to reduce mass shifts in the data, visualize the amount of mass shift correction performed and allows to easily export the corrected mass spectra. MSICorrect implements the recalibration method described in Chapter 4. In this chapter, we describe the tool architecture and provide technical details on the implementation.
In Chapter 6, we present our very first attempt and the principle concept to develop a computational method for characterizing spatial patterns in large MSI datasets, in an unsupervised manner. We present our simplistic approach in a step-wise manner to report significant spatial patterns in ion intensity maps and rank the maps based on a score. Our method further allows grouping mass values based on their similar spatial
4 1. Introduction
distribution patterns. We then evaluate our approach using two publicly available MSI datasets.
Chapter 7 demonstrates the application of a standard MSI data analysis workflow to a high-resolution biological MSI dataset. This use-case provides a detailed insight into the critical selection and application of specific data preprocessing and multivariate analysis methods to understand the chemistry of small structures on the adaxial leaf surface of Black cottonwood (Populus trichocarpa). The applied approach revealed a set of unique crystal formation patterns on the leaf surface.
Finally, in Chapter 8, we conclude this thesis with a summary of the findings of our research work and some suggested possible future directions of the study.
Chapter 2
An overview of analytical and
technological concepts
In this chapter we provide an introduction to the theoretical, analytical and biological aspects which are a prerequisite to understand the work presented in this thesis. We first provide a brief introduction to biomolecules (Section 2.1), since data used and the analysis methods presented in this thesis revolve around this biological unit. We then introduce mass spectrometry (Section 2.2) which is a unique analytical technology with the capability to measure individual molecular species in complex samples. We then go on further to introduce mass spectrometry imaging (Section 2.3). It is a powerful molecular imaging technology, that provides an extension to the existing capabilities of mass spectrometry by making region-specific molecular measurements directly from the biological sample. Along with explaining the basic principles and work flow of these two techniques, we outline the common technical setups and explain the nature of the acquired imaging data (Section 2.3.2). We conclude this chapter by providing a broad overview of the current applications of mass spectrometry imaging (Section 2.3.3).
2.1
Biomolecules
It is important to characterize the complex structure, behavior and diversity found in living forms. To study the functional processes, it is crucial to have an understanding of the biology at a molecular level.
Atoms are the smallest particles that are responsible for the characteristic properties of solids, liquids and gases. Atoms consist of anucleusandelectrons. The electrons revolve around the nucleus and bear a negative charge. The nucleus is composed of protons, that have a positive charge equal in magnitude to the negative charge of an electron and neutrons, that have no charge but have the same mass as protons. The total number of protons in an atom of an element indicates theatomic number of that element, whereas themass number is the total number of neutrons and protons present in the atom. The number of neutrons determines the isotope. Most elements are composed of more than one naturally occurring isotope. These have the same atomic number but a different mass number due to difference in the number of neutrons.
When two or more atoms are held together by chemical bonds, they form a larger entity known as a molecule. Molecules are electrically neutral as they contain equal number of protons and electrons. When an atom or a molecule has a lower or higher number of electrons than the number of protons, then such a particle is known as an ion. An ion may be negatively or positively charged. The molecular formula indicates the total number of atoms of each element in a molecule of the sample.
Molecular mass can be calculated from its molecular formula using three different ways [25, 26]:
1. Average mass: It is the sum of weighted average of masses of all the naturally occurring stable isotopes for each element in the compound.
6 2. An overview of analytical and technological concepts
2. Monoisotopic mass: It is calculated using the exact mass (the theoretical or true mass) of the most abundant isotope of each element in the compound.
3. Nominal mass: It is the sum of integer masses of the most abundant isotope of each element in the compound. Nominal mass and the mass number of an element have the same value.
The unit of mass is Dalton (Da), also known earlier as unified atomic mass (u). It is defined as one-twelfth the mass of a neutral carbon atom (12C), in its ground state. Molecules are the building blocks of nature. While the smallest molecule consists of two atoms, the large molecules (also known as macromolecules) are complex and are com-posed of several thousands of atoms. There are certain molecules that are the building blocks of living organisms and are essential for their survival, growth and maintenance. These are known as biomolecules. These include macromolecules like proteins, carbo-hydrates, lipids and nucleic acids as well as small molecules like primary and secondary metabolites and natural products.
With advancements in technology, different methods have been developed to study this molecular machinery. Based on the research goal, the types of analysis can be broadly classified as follows:
1. Qualitative analysis: Deals with the identification of analytes present in the sam-ple.
2. Quantitative analysis: Aims to determine the amount of analytes present in the sample.
3. Structural analysis: Aims to elucidate chemical structures.
Mass spectrometry is an analytical technique that plays an important role in the different types of analyses defined above. Section 2.2 provides insights into this technique.
2.2
Mass spectrometry
Mass spectrometry (MS) is a powerful analytical technique that separates gas phase ions extracted from a sample, based on their mass-to-charge ratio (m/z) and detects them qualitatively and quantitatively using their respective m/z and abundance. The m/z represents mass of the ion divided by its charge number. The number of electrons added or removed is the charge number of the ion. Mass spectrometry should not be confused with spectroscopy which deals with absorption of electromagnetic radiations. The basic variable parameter in spectroscopy is wavelength whereas in mass spectrometry it is m/z [26, 27]. With advancements in technology, this technique has grown further to offer unequaled sensitivity, speed and detection limits, as compared to other analytical methods. The important role of MS as an analytical tool is well recognized due to which this technique is routinely used in the qualitative, quantitative and structural analysis of peptides and proteins [28], carbohydrates [29], nucleic acids [30], lipids [31], drugs [32] and metabolites [8].
A standard MS experiment is performed using an instrument known as a mass spec-trometer and usually involves the following steps - Sample introduction into the mass spectrometer, analyte ionization, mass analysis, ion detection and recording, data pro-cessing and interpretation of results [27, 33]. The mass spectrometer is usually operated
8 2. An overview of analytical and technological concepts
sufficient vapor pressure, then the sample is directly ionized from the condensed phase. Some of the routinely used sample introduction techniques are direct vapor inlet, gas chromatography, liquid chromatography, direct insertion probe and direct ionization of the sample [34].
2.2.2 Ion source
The purpose of an ion source is to generate charged gas phase ions from the sample injected. This charge can be either positive or negative in polarity. This is done by evaporation of solid samples, vaporization of liquids, atomization of gaseous compounds and ionization of atoms and molecules so as to generate ions that can be sent to the mass analyzer. In all types of ion sources, during the ionization process singly or multiply charged atomic ions are formed. The most important considerations while using an ionization technique are the internal energy transferred during the ionization process and the physico-chemical properties of the analyte that has to be ionized. Depending on the amount of energy that is added to the molecules during ionization, the ionization technique can either induce little or no fragmentation that only produces ions of the molecular species, also calledsoft ionization, or result in extensive fragmentation, which is known ashard ionization.
2.2.3 Mass analyzer
Once ions are formed in the ion source, they are accelerated into the mass analyzer by an electric field. The main function of a mass analyzer is to separate these ions based on theirm/z values in order to be detected. Mass analyzers can either be continuous or pulsed type. Continuous mass analyzers include quadrupole filters and magnetic sectors whereas pulsed analyzers include time-of-flight, ion cyclotron resonance and quadrupole ion trap mass spectrometers. Each mass analyzer has its own advantages and limitations and there is no single mass analyzer optimal for all situations.
The choice of which analyzer to use is critical and usually involves consideration of the mass range, scan speed, mass accuracy, mass resolving power and abundance sensitiv-ity [35, 36]. Before we get into the details of the commonly used mass analyzers, it is important to get acquainted with the following terminologies:
Mass range determines the limit of m/z over which the mass analyzer can measure ions. It is the difference between the highest and the lowest measurablem/z .
Scan speed describes how fast a mass analyzer can record mass measurements over a particular mass range. It is expressed in mass units per second (u s-1) or in mass units per millisecond (u ms-1). A fast scan speed is desirable when a rapidly changing system is being analyzed whereas a slow scan speed can be used to obtain precise mass measurements.
Mass accuracy ∆mac is a measure of the closeness of the observed mass to the true
mass of the analyte. It is defined as the difference between the exact mass1 (ma) of an
ion and its observed peak centroidm/z (mexp) and is usually quoted inparts per million
(ppm) (see Figure 2.2(a)). This can be expressed in the form of Equation 2.1.
∆mac=|ma−mexp| (2.1)
1Exact mass is the calculated mass of a molecular ion or molecule whose elemental formula,
2.2 Mass spectrometry 9 m/z Intensity m Δm m+Δm Full width at half maximum 10% valley m/z Intensity Exact
mass Observed mass
Mass accuracy
Precision
(a) (b)
Figure 2.2: Illustration of the measurement of mass accuracy and mass resolution.
(a)Plot representing measurement of mass accuracy which is the difference between the exact
mass of an ion (inblue) and the observed mass (experimentally measured peak centroid, inred).
(b) Plot displaying the most common measures to calculate mass resolution are full width at
half maximum (FWHM) and 10% valley.
It should be noted that mexp or the experimentally determined mass is also known as
the accurate mass2.
The accuracy of a single reading is described using the mass measurement error. It is always desirable to have a high mass accuracy since this increases the likelihood of uniquely identifying the elemental compositions of the measured ions. Another term related to mass accuracy isprecision. It is the repeatability of the measurement reflecting random error. A set of measurements is considered to be precise if these errors are low.
Mass resolving power is the ability of the mass analyzer to separate one mass from an adjacent mass differing by a small increment. Mass resolution (R) is defined as the observed m/z divided by the smallest difference ∆(m/z) for two ions that can be
separated. It is important that the procedure using which∆(m/z) was measured and the
m/z value at which the measurement was made is reported [37]. The mass resolution can be calculated using Equation 2.2.
R= m/z
∆(m/z) (2.2)
where ∆(m/z) is either the peak width which is a specified fraction of the maximum
peak height or the spacing between two equal-intensity peaks that are separated by a valley which at its lowest point is 10% of the height of either of the peaks. Mostly three values for peak width are used 50%, 5% or 0.5%. A common standard is the definition of resolution based upon∆(m/z) defined as the Full Width of the peak at Half its Maximum
height (FWHM). A poor mass resolution leads to the inability to determine the peak position accurately in the presence of nearby peaks. A diagrammatic representation of the 10% valley and FWHM to calculate mass resolution is shown in Figure 2.2(b).
Abundance sensitivity is the degree to which the signal arising from a mass peak contributes to the adjacent masses. It is defined as the signal contribution of the tail of a peak at one mass lower and one mass higher than the actual analyte peak [38]. If the
2Accurate mass is the mass of a molecular ion or molecule determined experimentally measured to a
10 2. An overview of analytical and technological concepts
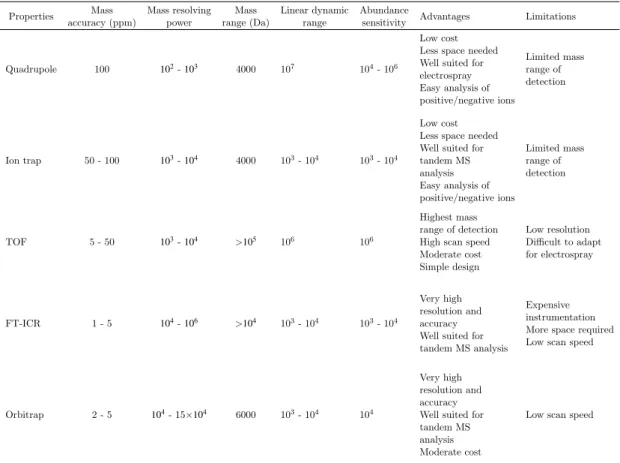
Table 2.1: Comparison of some of the popularly used mass analyzers. The listing of figures of
merit of all the mass analyzers are taken from MucLuckeyet al.[39] and Hart-Smith et al.[36].
Properties Mass accuracy (ppm) Mass resolving power Mass range (Da) Linear dynamic range Abundance
sensitivity Advantages Limitations
Quadrupole 100 102-103 4000 107 104- 106
Low cost Less space needed Well suited for electrospray Easy analysis of positive/negative ions Limited mass range of detection Ion trap 50 - 100 103-104 4000 103- 104 103- 104 Low cost Less space needed Well suited for tandem MS analysis Easy analysis of positive/negative ions Limited mass range of detection TOF 5 - 50 103-104 >105 106 106 Highest mass range of detection High scan speed Moderate cost Simple design Low resolution Difficult to adapt for electrospray FT-ICR 1 - 5 104-106 >104 103- 104 103- 104 Very high resolution and accuracy Well suited for tandem MS analysis
Expensive instrumentation More space required Low scan speed
Orbitrap 2 - 5 104- 15×104 6000 103- 104 104
Very high resolution and accuracy Well suited for tandem MS analysis Moderate cost
Low scan speed
Values presented in the table may vary with hybrid configurations from different instrument manufac-tures; please refer the manufacturer’s technical specification.
mass analyzer has a poor abundance sensitivity, it will often prohibit the measurement of a small peak next to a major interfering peak.
Table 2.1 compares some of the popular mass analyzers. Below we describe the time-of-flight mass analyzer in detail as the imaging datasets used in this thesis have been acquired using this analyzer type.
Time-of-flight analyzer
Time-of-flight (TOF) analyzers are based on the concept that ions with the same kinetic energy but different mass (m) travel with different velocities (v). This can be represented as:
eV =1
2mv
2 (2.3)
Here e is the electric charge and V is the accelerating potential. In these types of analyzers, ions are accelerated through a fixed length region (D) known as a flight tube towards the detector. In the absence of a magnetic or electric field these ions begin to separate according to their masses and have differing velocities. Lighter ions arrive earlier than the heavier ones and hence are recorded first.
2.3 Mass spectrometry imaging 11
In such analyzers, the flight time (t) for ions is proportional to the square root of their masses (m):
t=( m
2eV
)12
D (2.4)
One of the main advantages of TOF analyzers is that the upper mass range has no limit, making it suitable for soft ionization techniques. They also have a high scan speed and a high transmission efficiency that leads to a very high sensitivity. However, linear TOF analyzers suffer from a poor mass resolution. This is because in these analyzers, the travel timet is proportional to the square root of the massm, due to which, as the mass increases it leads to the decrease in the∆t for a given∆m/z. This issue can be addressed
by having a high acceleration and long flight tubes, since they increase the difference between the different m/z ratios. The issue of poor resolution has now substantially improved with further advances in technology [40].
2.2.4 Detector
Once the ions are separated according to their m/z in the mass analyzer, they reach the detector where they get detected and are transformed into a signal which is then recorded. Since the number of ions coming to the detector at a particular instant is usually quite small, it becomes necessary to perform amplification in order to record a usable signal. Ideally, the electric signal generated from the incident ions is proportional to their abundance. However, instruments in real time cannot provide this proportion-ality for all the masses.
Depending on the type of the detector used, ion detection is based either on charge of the ions, their mass or their velocity [35]. Some of the most common detectors used in a MS setup are: Faraday cup; which is based on the measurement of direct charge current that is produced when an ion hits a surface, andelectron multipliers; that are based on the kinetic energy transfer of ions when they hit a surface that in turn generates secondary electrons, which are amplified further to give an electronic current. However, these detectors have a limitation that their efficiency generally decreases as them/z increases. The new age detectors likeinductive detectorsandcryogenic detectors address this issue.
2.2.5 Mass spectrum
After ion detection, the received signals are sent to a computer-aided data system where the m/z ratios are stored together with their relative abundance measures which is presented in the form of amass spectrum. It is a two-dimensional representation of the m/z which is represented on the x-axis and its corresponding signal intensity which is represented on the y-axis. A mass spectrum can also be represented as a tabular list with 2 columns - m/z and intensity, as analog (profile) form where each peak has a height and a width and is displayed in a continuous manner or as digital (centroided) formwhere each peak corresponding to a specific ion is represented as a vertical line [41]. This vertical line is drawn through the centroid of each peak profile, where the height represents the signal intensity.
2.3
Mass spectrometry imaging
Mass spectrometry can provide us with qualitative, quantitative as well as structural information about the sample analyzed. However, within complex biological systems
12 2. An overview of analytical and technological concepts
it is also important to understand the spatial context in which molecular changes take place. This spatial information often helps in understanding the biological functions performed by different biomolecules and also can help in determining disease biomarkers. A standard MS experiment does not provide this spatial information. Mass Spectrometry Imaging (MSI) has emerged as an enabling technique to address this issue. The terms mass spectrometry imaging andimaging mass spectrometry are used interchangeably in a number of publications. However, in this thesis, we will only use mass spectrometry imaging or simply MSI.
MSI is a label-free analytical technique enabling investigation of the spatial arrangement and relative chemical concentration of different compounds in biological samples, with a high chemical specificity, in a broad mass range. Given a biological sample, MSI measures high dimensional mass spectra at each spatial position (also referred to as pixel) on the sample surface. These mass spectra are later reconstructed to form a hyperspectral image displaying the spatial biochemical composition within the sample of both known and unknown molecules [42, 43].
There are four main steps involved in a typical MSI workflow. First is sample preparation which highly depends on the ionization technique employed (discussed in Section 2.3.1). Ionization is performed at defined spots on the sample surface in such a way that the com-plete sample is rastered. Ions from every spot reach the mass analyzer and are recorded individually. The acquired mass spectrum is associated with a coordinate position on the sampled biological section. This is followed by data processing and visualization in the form of 2-dimensional (2-D) ion intensity maps (explained in Section 2.3.2) [44]. Based on the goal of the experiment and how data acquisition is performed, MSI exper-iments can be classified into two different types [45–47]:
1. Microprobe
In this mode, a highly focused laser beam is used to analyze a small, localized spot of the biological sample and a complete mass spectrum is recorded for the specific coordinate position on the sample. The beam is then focused on the next spot and mass spectrum is recorded for it. This process is repeated until the complete array of spots on the entire sample surface is sequentially examined in x and y directions.
2. Microscope
In this mode, ions from a large sample area on the biological section are des-orbed simultaneously. Then the ion optics of the instrument projects the ionized substances from this area to a position sensitive detection system such as a micro-channel plate. These detectors register the signal of a specificm/z over the whole sample area, at once as well as retain the spatial information.
The microprobe mode is more widely applied and the datasets used in this thesis are acquired using this approach. A schematic of a typical MALDI-MSI experiment using the microprobe mode is shown in Figure 2.3.
2.3.1 Techniques
A typical MSI experiment is usually performed using a standard mass spectrometer. As discussed in Section 2.2, a mass spectrometer contains an ion source where the ionization of the analyte is performed. The selection of the ion source to be used is largely based on the goal of the experiment and the sample properties. Some of the commonly
14 2. An overview of analytical and technological concepts
Table 2.2: Comparison of commonly applied MSI techniques. The listing of figures of merit of
the ionization techniques are taken from Wuet al.[48], Nemeset al.[49], Esquenazi et al.[44]
and Bodzon-Kulakowskaet al.[50].
Ion source Type of ionization Ionization source Sensitivity and resolution Mass
range (Da) Limitations
Commonly analyzed analyte classes
MALDI Soft Laser beam fmol - zmol,
10 - 100µm 0 - 100000
Matrix signals may interfere with the low m/zregion
Lipids, proteins, peptides
SIMS Hard Primary ion
beam Varies withm/z, 10 nm - 100µm 0 - 1000 Low sensitivity for high masses (>1000 Da) Small molecules
DESI Soft Solvent
spray
fmol - pmol,
40 - 400µm 0 - 2000
Has an analyte washing effect
Small molecules, lipids, peptides
LAESI Soft Mid-infrared
laser beam
8 - 25 fmol, less than
20 - 200µm 0 - 2000
Water content in the sample affects ablation characteristics and ionization
Small molecules, lipids, peptides, proteins
used ionization techniques for MSI are Matrix Assisted Laser Desorption/Ionization (MALDI), Secondary ion mass spectrometry (SIMS), Desorption electrospray ionization (DESI) and Laser ablation with electrospray ionization (LAESI). Table 2.2 shows the main features of these ionization techniques.
In this section, we will discuss MALDI and SIMS, that are relevant for this thesis.
Matrix assisted laser desorption/ionization MSI
Matrix Assisted Laser Desorption/Ionization MSI or MALDI-MSI is currently the most widely used MSI technique [44, 46, 50]. In this technique, the sample usually a bio-logical tissue, is thinly sliced approximately 5-20 µm thick and mounted on a MALDI target plate (for imaging intact biological samples which are three dimensional in na-ture, as discussed by Kaftan et al.[2], special MALDI target plates with profiled holes are also used). The target plate containing the tissue slice is then evenly coated with a matrix. This homogeneous matrix layer usually consists of small organic molecules that can absorb majority of the laser energy incident on it. Once the solvent in the matrix is evaporated, it leads to the crystallization of the matrix and incorporation of the analyte molecules into the growing crystals. This plate containing the crystals is subsequently irradiated with a laser beam typically with micron and sub-micron di-mensions, by rastering across the surface. This leads to the desorption and ionization of the matrix and analyte molecules. In positive ionization mode, singly protonated molecular ions [M+H]+ are generated from analytes in the sample, whereas in negative ionization mode singly de-protonated ions [M-H]− are generated [51–53]. These ions are subsequently separated by a mass analyzer based on their masses. A schematic of the MALDI process is depicted in Figure 2.4(a) [54]. The TOF analyzer (discussed in Section 2.2.3) is popularly used for MALDI-MSI studies.
Based on the goal of the study, the choice of matrix is important. Different matrices enable the ionization and desorption of different types of biomolecules, as summarized in Table 2.3.
This ionization approach has a high mass range (100,000 Da) and is capable of producing intact higher molecular weight ions since they get incorporated into the matrix crystals and do not get fragmented [46]. This makes MALDI-MSI very useful for recording intact biomolecules specially peptides, proteins and lipids.
2.3 Mass spectrometry imaging 15
Table 2.3: Matrices commonly used in MALDI-MSI [55–57].
Biomolecule type Matrix used for MALDI-MSI
Metabolites 9-Aminoacridine (9-AA)
Lipids
2,5-Dihydrobenzoic acid (DHB) 2,6-dihydroxyacetophenone (DHAP) p-nitoroaniline (PNA)
9AA
Peptides α-Cyano-4-hydroxycinnamic acid (CHCA)
DHB
Proteins Sinapinic acid (SA)
CHCA
Nucleic acids, small sugar molecules 1,8-bis(dimethyl-amino)naphthalene (DMAN) Organic acids, amino acids 1,5-diaminonapthalene (DAN)
Secondary ion mass spectrometry imaging
Secondary ion mass spectrometry (SIMS) is a destructive analytical technique that is used to analyze the composition and structural layers of biological tissues. This tech-nique utilizes a highly focused and energetic primary ion beam (e.g. Ar+, Xe+, Cs+, Ga+, In+) of about 5-25 KeV to bombard the sample surface that induces multiple collisions with atoms and molecules on the surface [58]. This results in the emission of mostly neutral but also charged secondary ions. This process is also known as sputter-ing. These secondary ions are then introduced into a mass analyzer after acceleration using a high voltage acceleration system. The SIMS ionization process is shown in Fig-ure 2.4(b). The most commonly used analyzer along with SIMS is the TOF analyzer (Section 2.2.3).
One of the main features of SIMS technique is the extensive fragmentation of molecules on the sample surface, as compared to MALDI (Section 2.3.1). This happens because, the energy of the primary ions deposited into the sample surface is substantially higher than the energy deposited by the laser beam in the case of MALDI. Also, because of this extensive fragmentation, the SIMS mass spectra are usually complex and the mass range is limited to ∼m/z 1000 Da.
SIMS usually requires minimum sample preparation. Specifically for SIMS imaging the sample preparation usually just involves mounting of the biological tissue section on a glass slide coated with indium tin oxide [46]. SIMS imaging can analyze a wide range of samples however it is favorable to have a flat sample surface, so as to avoid the adverse effect of surface topology on the generation of secondary ions and mass measurement [42]. Because of the small size of primary ion beam, SIMS offers a high spatial resolution of about 10 nm, making it possible to image the cellular and sub-cellular distribution of a variety of compounds in the sample. However, it is only suitable for the analysis of small molecules, because the secondary ion yield in SIMS decreases rapidly and non-linearly with increasing mass, hence offering low sensitivity for higher mass ions [51, 59]. With advancement in technology, different modifications for SIMS have been developed so as to enhance ionization and large molecule detection capabilities.
2.3 Mass spectrometry imaging 17
map [50, 62]. The more is the number of pixels from which the mass spectra is acquired, the better is the lateral resolution of the analysis. This means that, on increasing the spatial resolution, smaller and more detailed features of the sample can be seen on the acquired image. But a higher spatial resolution also leads to an increase in the volume of data acquired. There are a number of factors that determine the lateral resolution. These are: spot size which denotes the size and shape of a single spot from which a single acquisition is performed,raster size or step size which is the distance between two consecutive spots and pixel size and density of pixels which determines the ability to distinguish two features. Most commercially available instruments offer spot size of 10-200 µm [63].
3. Depth resolution is specifically considered while performing SIMS imaging (dis-cussed earlier in Section 2.3.1). SIMS provides in-depth information on the atomic constituents of the sample. The sputtering process gradually erodes the sample surface and provides information on the first few mono-layers below the initial sur-face, also known as thedepth profile. The quality of this depth profile is measured by the depth resolution. It is described in terms of the ability to discriminate between atoms in adjacent thin layers [45, 64]. The depth resolution achievable depends on nature of the primary ion beam used, the depth below the surface and the uniformity of sputtering by the ion beam.
Due to the massive size of data produced in a single experiment, it is tedious to per-form manual analysis. Many free as well as commercial data processing, data mining and visualization software have been developed to aid in the analysis of this data. A compre-hensive list is available here: http://ms-imaging.org/wp/sotware-tools/. Standard data processing steps and analysis pipelines have been discussed in Chapter 3.
Data description and representation
Below we provide a standard notation to describe MSI data that is used throughout this thesis.
A single MSI dataset is stored as a 2-D matrix. Letters in upper case, bold font, denote matrices and letters in the lower case, bold font, denote vectors. Letters in italic font, denote scalars. The matrix transpose is denoted by an apostrophe. All indices are taken to run from one to their capital versions. Each spectrum is a row vector and intensities of the distribution of an ion across all the pixels is a column vector in the data matrix. The term sample denotes a single mass spectrum from the MSI dataset and the term variable denotes the mass (m/z) of a single ion.
2.3.3 Applications of mass spectrometry imaging
MSI is now commonly applied for the analysis of a wide variety of biological systems ranging from intact whole-body samples like insects [2], complex whole-body tissue sec-tions [65, 66] to specific biological tissue samples and single-cells [67, 68]. It is also being increasingly used for the study of disease pathology, tissue-based disease classi-fication, biomarker identiclassi-fication, molecular expression and drug resistance patterns in diseases like cancer [69, 70], Alzheimer’s disease [71], Parkinson’s disease [72], muscular dystrophy [73] and kidney disease [74].
Although, existing clinical imaging methods like immunostaining and fluorescence-based techniques are popularly used to study the spatial localization of biological substances, these techniques are highly specific and usually allow the visualization of only a single
18 2. An overview of analytical and technological concepts
class of analyte per sample. Also, techniques such as magnetic resonance imaging provide only structural information. On the contrary, MSI allows for the label-free discovery of multiple classes of biomolecules present in the sample in a single run [75]. To add value to the results, many experiments now apply a multimodal approach and combine results obtained from multiple MSI techniques as well as other classical histological techniques [76, 77]. This allows to correlate the molecular and spatial data obtained from MSI to the structural information obtained from conventional clinical techniques.
Chapter 3
Computational processing and
analysis of MSI data
As discussed in Chapter 2, the principal goal of an MSI experiment is to determine the chemical specificity and the spatial distribution of molecules which can then be correlated to the underlying biology of the sample analyzed. A single MSI dataset may contain hundreds to thousands of mass spectra, each containing signals from hundreds to thousands of mass peaks. To aid in the analysis of such high-dimensional data, robust computational algorithms are important to enable extraction and visualization of relevant information from the data.
In this chapter, Section 3.1 introduces a standard data processing workflow employed in analyzing MSI data. In Sections 3.2 and 3.3, we describe the file formats used post ac-quisition and explain the preprocessing steps necessary before analyzing the data. Later, in Section 3.4, we explain multivariate data analysis (MVA) approaches specifically fo-cusing on unsupervised techniques, that can help in interpreting multi-dimensional MSI data and can extract distinct correlations within ion distributions. To conclude, in Sec-tion 3.5, we briefly discuss supervised classificaSec-tion and the emerging trend of combining and interpreting data from different imaging modalities to aid in areas like biomarker identification.
Selection and application of the unsupervised multivariate data analysis methods ex-plained here is presented as a case study in Chapter 7, where we analyze co-aggregation patterns found on the leaf surface of Populus trichocarpa using TOF-SIMS imaging.
3.1
Overview of the data analysis workflow
For analyzing MSI data, when the aim is to study specific ions of interest, the simplest method is to visualize the spatial distribution of each ion. This can be done by con-structing 2-D ion intensity maps (explained in Section 2.3.2). These maps can then be compared with optical images of the tissue section that has been analyzed. For more complex analysis like biomarker discovery, where significant molecular information or characteristic signals are not known a priori and the goal is to study correlations be-tween hundreds of detected molecules, manual analysis of data is impractical. In such cases, exploratory analysis of MSI data is important to understand the underlying spatial patterns and identify significant mass features in the data.
The steps used for analyzing such data depends on the goal of analysis or the biological question. Figure 3.1 illustrates a typical data analysis pipeline that can be applied to MSI data [63, 78–80].
Every single step has subdivisions and the methods applied for each step should be chosen wisely as this can impact on the quality or effectiveness of the subsequent steps and can highly influence the results generated.
We explain individual steps comprising the data analysis workflow in the next sections.
20 3. Computational processing and analysis of MSI data
Data import and conversion Spectral data preprocessing Smoothing Normalization Peak picking Recalibration Component analysis Cluster analysis
Dimensionality reduction and unsupervised data mining
Biological interpretation and further studies
Molecular identification Supervised classification
Combination with other imaging modalities Baseline correction
Figure 3.1: Typical pipeline for the interpretation of a MSI dataset. The workfl