LnCompare: gene set feature analysis for human long
non-coding RNAs
Joana Carlevaro-Fita
1,2,†, Leibo Liu
3,†, Yuan Zhou
4, Shan Zhang
3, Panagiotis Chouvardas
1,2,
Rory Johnson
1,2,*and Jianwei Li
3,*1Department of BioMedical Research (DBMR), University of Bern, Bern 3008, Switzerland,2Department of Medical
Oncology, Inselspital, University Hospital and University of Bern 3010, Switzerland,3Institute of Computational Medicine, School of Artificial Intelligence, Hebei University of Technology, Tianjin 300401, China and4Department of Biomedical Informatics, School of Basic Medical Sciences, Peking University, Beijing 100191, China
Received March 05, 2019; Revised May 02, 2019; Editorial Decision May 02, 2019; Accepted May 06, 2019
ABSTRACT
Interest in the biological roles of long noncoding RNAs (lncRNAs) has resulted in growing numbers of studies that produce large sets of candidate genes, for example, differentially expressed between two conditions. For sets of protein-coding genes, on-tology and pathway analyses are powerful tools for generating new insights from statistical enrich-ment of gene features. Here we present the LnCom-pare web server, an equivalent resource for study-ing the properties of lncRNA gene sets. The Gene Set Feature Comparison mode tests for enrichment amongst a panel of quantitative and categorical fea-tures, spanning gene structure, evolutionary conser-vation, expression, subcellular localization, repeti-tive sequences and disease association. Moreover, in Similar Gene Identification mode, users may identify other lncRNAs by similarity across a defined range of features. Comprehensive results may be down-loaded in tabular and graphical formats, in addition to the entire feature resource. LnCompare will em-power researchers to extract useful hypotheses and candidates from lncRNA gene sets.
INTRODUCTION
Long non-coding RNAs (lncRNAs) are a numerous yet poorly understood class of genes with growing biological and biomedical interest. Their regulatory roles (1) and tis-sue specificity (2,3) make them promising biomarkers and therapeutic targets (4,5). High-throughput studies on dis-ease or biological systems routinely produce sets of tens to thousands of lncRNA candidates (6). Some examples of such sets are lncRNAs exhibiting differential expression
be-tween conditions (7), association with a disease (8) or whose perturbation by CRISPR-Cas9 leads to phenotypic changes (6,9). Important bottlenecks arise in assessing the quality of such sets, and generating functional and mechanistic hy-potheses from them (6,7,10,11).
Controlled ontologies describing gene functions or their products’ characteristics, most notably Gene Ontology and Kyoto Encyclopedia of Genes and Genomes (12–14), are powerful and widely used tools for inspecting sets of protein-coding genes (PCGs) (15–18). Unfortunately, func-tional labels have not yet been directly assigned to lncRNAs, making them inaccessible to ontology analyses. As a result, lncRNA candidate sets cannot be mined for biological in-sights to the degree which we have come to expect for PCGs. In a similar way, there are a range of tools designed to iden-tify other PCGs with various degrees of similarity to a gene of interest (19–22), but none are available for lncRNAs. In summary, there is a need for tools to analyse lncRNA gene lists and functionally prioritize candidates for further study. To date, most methods dedicated to revealing functional insights from lncRNA sets rely on the biological properties of PCGs with correlated expression across tissues (5). For example, LncRNA2Function and Co-LncRNA web servers perform functional enrichment analysis on the co-expressed coding genes of the input lncRNAs (23,24). Lnc-GFP and LncRNAs2Pathways (23,25) follow a similar strategy but introducing more sophisticated graph theory algorithms on co-expression networks. Finally, FARNA (26) consid-ers transcription factor (TF)-lncRNA associations to pre-dict lncRNA functions. However, none of these resources directly explores the features of lncRNA genes and prod-ucts.
To address this need, we have developed LnCompare, a web server that compares lncRNA genes across a range of features. LnCompare is based on a comprehensive feature set with more than 100 attributes covering diverse aspects,
*To whom correspondence should be addressed. Tel: +41 31 6324098; Email: [email protected]
Correspondence may also be addressed to Jianwei Li. Tel: +86 22 60435864; Fax: +86 22 60435867; Email: [email protected] †The authors wish it to be known that, in their opinion, the first two authors should be regarded as Joint First Authors.
C
The Author(s) 2019. Published by Oxford University Press on behalf of Nucleic Acids Research.
This is an Open Access article distributed under the terms of the Creative Commons Attribution Non-Commercial License
(http://creativecommons.org/licenses/by-nc/4.0/), which permits non-commercial re-use, distribution, and reproduction in any medium, provided the original work is properly cited. For commercial re-use, please contact [email protected]
source:
https://doi.org/10.7892/boris.134311
W524 Nucleic Acids Research, 2019, Vol. 47, Web Server issue
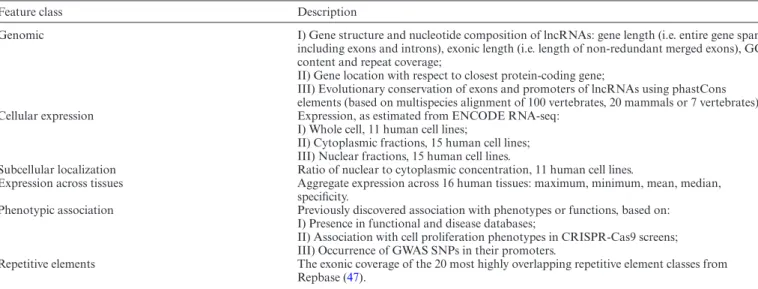
Table 1. Classification and summary of lncRNA features included in LnCompare database
Feature class Description
Genomic I) Gene structure and nucleotide composition of lncRNAs: gene length (i.e. entire gene span including exons and introns), exonic length (i.e. length of non-redundant merged exons), GC content and repeat coverage;
II) Gene location with respect to closest protein-coding gene;
III) Evolutionary conservation of exons and promoters of lncRNAs using phastCons elements (based on multispecies alignment of 100 vertebrates, 20 mammals or 7 vertebrates). Cellular expression Expression, as estimated from ENCODE RNA-seq:
I) Whole cell, 11 human cell lines;
II) Cytoplasmic fractions, 15 human cell lines; III) Nuclear fractions, 15 human cell lines.
Subcellular localization Ratio of nuclear to cytoplasmic concentration, 11 human cell lines.
Expression across tissues Aggregate expression across 16 human tissues: maximum, minimum, mean, median, specificity.
Phenotypic association Previously discovered association with phenotypes or functions, based on: I) Presence in functional and disease databases;
II) Association with cell proliferation phenotypes in CRISPR-Cas9 screens; III) Occurrence of GWAS SNPs in their promoters.
Repetitive elements The exonic coverage of the 20 most highly overlapping repetitive element classes from Repbase (47).
including gene structure, nucleotide composition, evolu-tionary conservation, cell and tissue expression, subcellu-lar localization, tissue specificity, repetitive sequence con-tent and phenotypic association. Based on these features, LnCompare has two main functionalities. First, Gene Set Feature Comparisonidentifies statistically-enriched features of lncRNA sets, in a similar way as is presently done for PCGs (17,18,27,28). Second,Similar Gene Discovery func-tionality seeks to identify other similar genes for a given gene-of-interest, based on user-defined features.
LnCompare is freely available athttp://www.rnanut.net/ lncompare/
MATERIALS AND METHODS
Compilation of lncRNA features
We collected and processed various lncRNA datasets from public databases and in-house computational analysis. Al-together these comprise 109 gene/transcript attributes for the GENCODE v24 human lncRNAs annotation (15 941 genes). These features can be classified into six main classes (see Table1):
All data has been compiled at the level of lncRNA genes, not transcripts. For certain features, we utilized an exonic projection of all annotated transcripts from each gene, and estimated the corresponding feature accordingly––for ex-ample, GC content or phastCons overlap. Detailed infor-mation on every feature and its source are available in Sup-plementary Table S1, and provided as additional informa-tion at the web server. A comprehensive list of features may be found in Supplementary Table S1, and the entire table of lncRNA features for the GENCODE v24 annotation can be downloaded in the ‘Download’ tab in LnCompare. Statistical analysis
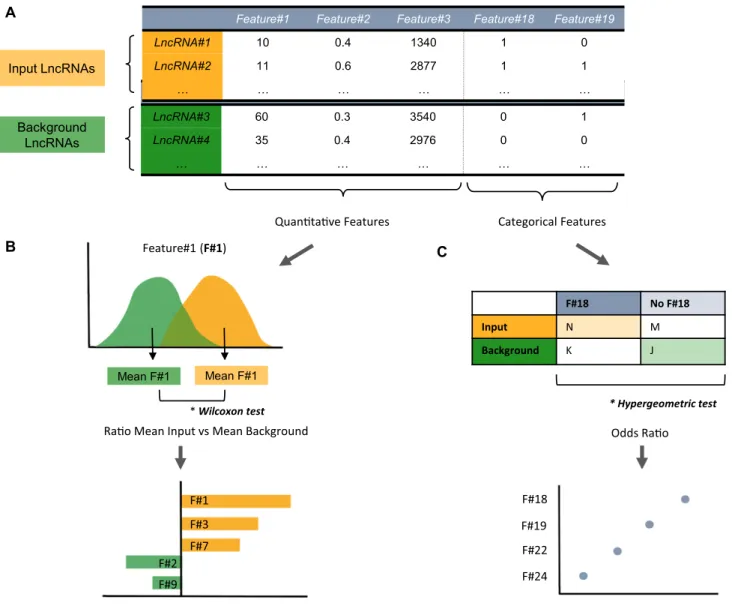
InGene Set Feature Comparisonmode, LnCompare consid-ers both quantitative and categorical features (Figure1A). By default, the background set is defined as the entire GEN-CODE annotation. The Wilcoxon test is used to compare
quantitative features between the input gene set and the background set (Figure1B). For categorical features, the hypergeometric test is applied, and the detailed formula was described in our previous work (29) (Figure1C). By default, the quantitative features are sorted by the absolute loga-rithm ratio of the average feature values between the input versus background, in order to highlight the features where the input lncRNA list and the background show the most prominent divergence. Similarly, the odds ratio is used to rank most enriched categorical features.
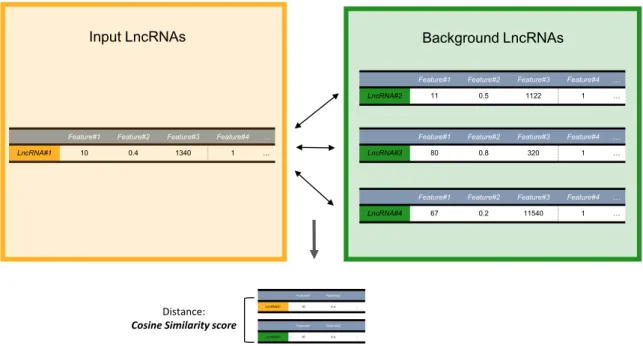
In Similar Gene Discovery, LnCompare performs sim-ilarity calculation between two lncRNAs based on their features (Figure2). After comparing several methods (e.g. Pearson correlation, Euclidian distance etc.), the cosine similarity was finally adopted:
Similarity =cos (θ) = A·B
A B
where A and B are the feature vectors of two LncRNAs, with N/A values dropped. By definition, it is the point mul-tiplication of A and B, divided by the product of the norm of the two vectors. To enable a flexible similarity calculation, users can either use all features, or else a defined subset of features (Supplementary Table S1). Higher cosine similarity indicates greater similarity.
In addition, for more robust results, we employed mutual rank, which has been successfully applied to establish gene co-expression networks (30):
Rank =Rank(Simiarity)A in B·Rank(Similarity)B in A Where the Rank(Similarity)A in Bdenotes the rank of
sim-ilarity between A and B among the similarities of B to all other lncRNAs, and Rank(Similarity)B in Ais defined in
ilar fashion. Lower mutual rank values indicate greater sim-ilarity.
Server implementation
The web server is built on a Linux server using the Apache+MySQL+PHP framework. All graphical
visual-A
B C
Figure 1. Gene Set Feature Comparisonmodule workflow. (A) LnCompare is based on a dataset of quantitative and categorical features of lncRNAs. For a given analysis, LnCompare divides input lncRNAs (yellow) and background lncRNAs (green). (B) For each quantitative feature, the distribution of input and background lists are compared by Wilcoxon test. Below are shown the results, displayed in the web server as a barplot. Each bar represents a feature, and length in thex-axis denotes the ratio of the mean input value and the mean background value. (C) For every categorical feature, LnCompare performs a hypergeometric test (upper panel), which is summarized in a bubble plot (lower panel). Features are distributed across they-axis, while thex-axis displays the odds ratio obtained from the hypergeometric test. Circle radius reflects theP-value from the hypergeometric test.
izations are enabled by the open source G2 package (https: //antv.alipay.com/), whilst the display and download of tab-ular results was established with the JavaScript plugin vis (http://visjs.org/).
DESCRIPTION OF WEB SERVER
LnCompare web server performs gene set or single gene comparisons of lncRNAs based on diverse features. It is based on the GENCODE version 24 human annotation (31), and therefore only genes with Ensembl ‘ENSG. . . ’ identifiers belonging to this annotation are assessed. In cases where a supported non-GENCODE identifiers are provided, LnCompare will attempt to map it to GEN-CODE. Supported identifiers comprise Gene symbols, Ref-Seq IDs and Ensembl transcript IDs, whose mappings to
GENCODE are based on the Ensembl ID mapping file. When successfully mapped, this gene will be included in subsequent analyses. When not successful, unrecognized IDs, including out-of-date Ensembl entries, are ignored in analyses. The number of successfully found IDs is reported in the results page.
For all analyses, users can populate forms with three dif-ferent sets of example data using buttons. These are: the ‘Simple Example’ list of six randomly-selected lncRNAs; the ‘CLC’ list of 122 cancer-related lncRNAs (32); the ‘Cell Cycle Example’ of 117 lncRNAs that are differentially ex-pressed between G1S and G2M cell-cycle stages in HeLa cells (33).
LnCompare has two modules, described below. A com-plete tutorial for both modules can be found in the ‘Help’ tab.
W526 Nucleic Acids Research, 2019, Vol. 47, Web Server issue
Figure 2.Similar Gene Discoverymodule workflow.The module compares either one gene or several input genes versus a list of background genes (‘1-to-N’ and ‘M-to-N’, respectively). The yellow box represents the input genes; the green box represents the background genes. Similarity comparisons are based on the distance between the two gene feature vectors, calculated by two different methods: cosine similarity and mutual rank.
Gene set feature comparison
Gene Set Feature Comparisonmodule aims to identify fea-tures that characterize a user-provided gene set. This in-put gene set is compared to a defined background gene set, across each feature (Figure1A). By default, background is the entire GENCODE annotation, although the user can provide alternative background sets.
The feature-comparison analysis runs differently for quantitative and categorical features. For quantitative fea-tures, statistical significance is assessed by Wilcoxon test, while for categorical features the hypergeometric test is used (Figure1B and C). Results are displayed separately.
For quantitative features, LnCompare returns a sum-mary plot with logarithm ratios of the mean feature val-ues for the input and the background sets. For categorical features, equivalent plots display the odds ratio (Figure1B and C). In addition, corresponding P-values, Benjamini– Hochberg false discovery rates (FDR) (34) and a link to a boxplot (or barplot for categorical features) can be found in tabular format (for an example see Figure3). Additional information on each feature can be accessed from the ‘?’ button in the table. For both quantitative and categori-cal features, the user can apply several different cutoffs to the data displayed: the top ten features, ranked by mean ratio/odds ratio (for quantitative and categorical features, respectively), features withP<0.05, features with FDR< 0.05, or all possible comparisons). Graphical and tabular results can be directly downloaded from the website.
Similar gene discovery
LnCompare offers two approaches to compare similarity of lncRNA genes using cosine similarity method: (i) 1-to-N comparison: computes the similarity of one user-provided
lncRNA to all remaining GENCODE lncRNAs; (ii) M-to-N comparison: computes the similarity of every lncRM-to-NA from list M to every one in list N (Figure2). The user must provide two lists of Ensembl gene IDs (up to a maximum of 100 in each). After specifying the type of analysis desired (1-to-N or M-to-N) and entering the gene IDs, the user can choose which subsets of lncRNA features to be used for sim-ilarity analysis (from the feature classes described above (see ‘Materials and Methods’ section).
For both types of similarity analysis, graphical and tabu-lar outputs display the top 10, 20 or 50 cosine scores (speci-fied by the user) together with the corresponding gene IDs. The table also contains the relative rank the score repre-sents among the partners for lncRNA1 and lncRNA2 lists, respectively (i.e. first number indicates the ranking number for that pair among all possible partners of lncRNA from lncRNA1 list, and the second number indicates the same for lncRNA from lncRNA2 list).
When all the feature classes are selected, LnCompare also provides a mutual rank similarity results section. In this case, graphical and tabular formats show how reciprocal the similarity is between the two genes, with a mutual rank score (see ‘Materials and Methods’ section for more de-tails). Again, the user can select how many output compar-isons should be displayed (top 10, 20 or 50 scores). All the tables from this module are available for download.
EVALUATION OF WEB SERVER; A CASE STUDY US-ING CANCER-RELATED GENES
We tested the performance of LnCompare using a set of 122 experimentally validated cancer lncRNAs from the Cancer LncRNA Census (CLC) (32). CLC genes are curated based on experimentally validated functional roles in tumorige-nesis or cancer-related cellular phenotypes, and hence is a
A
B
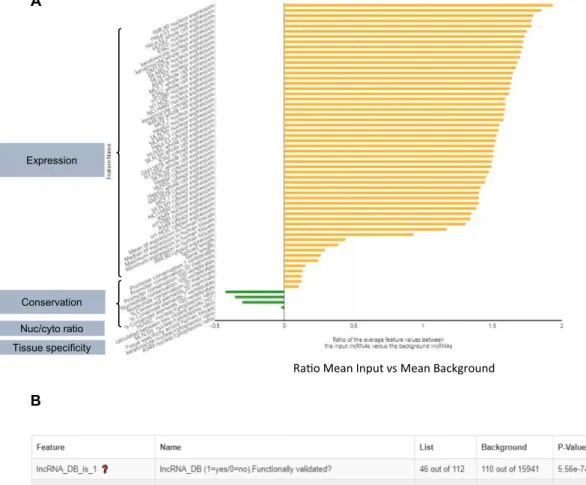
Figure 3. Results fromGene Set Feature Comparisonanalysis of CLC (A) Graphical results displaying features that are significantly different between CLC and background lncRNAs (FDR<0.05). Feature labels are shown on they-axis and grey boxes on the left summarize their content. Thex-axis indicates the ratio between the mean of CLC genes (input) and background genes for each feature. (B) Table obtained from the same analysis for categorical features. ‘Feature’ and ‘Name’ indicate and describe the feature tested, ‘List’ and ‘background’ show the number of CLC and background genes associated with the feature, respectively. ‘P-value’, ‘FDR’ and ‘Odds Ratio’ from hypergeometric test are also shown in the table.
useful positive control set of lncRNA genes. The CLC genes make a good test case, since they are known to be charac-terized by a range of features such as high expression in tu-mours, spliced length and evolutionary conservation (32). Assessing CLC we want to represent two possible scenar-ios: (i) the user has no prior knowledge of a gene set, and wishes to assess their potential functionality; (ii) The user is aware that this is a set of important lncRNAs, and wishes to study their particular features.
Running the Gene Set Feature Comparisonmodule, we searched for specific features of CLC genes compared to background (all other lncRNAs). Using a cutoff of FDR< 0.05, we observe several quantitative and qualitative traits to be significantly enriched in CLC lncRNAs (Figure3A). These include high average expression across numerous hu-man cell lines and tissues. CLC genes, on average, also show high exon and promoter conservation across mammals and
vertebrates (Figure3A). Moreover, the CLC set is signifi-cantly enriched with lncRNAs from functional and disease databases (Figure3B). Together, these attributes are consis-tent with the input gene set being enriched withbona fide
functional lncRNAs (32), and points to features (e.g. high expression) that are shared by both cancer-related lncRNAs and PCGs (35,36).
Interestingly, theGene Set Feature Comparison also re-ports CLC genes to be on average closer in genomic dis-tance to PCGs, and significantly more likely to be diver-gently transcribed from protein coding genes (Figure3B). This may reflect a common molecular mechanism among CLC lncRNAs to be further studied. In contrast, it may result from a bias in literature to focus on lncRNAs that lie close to PCGs. Such ascertainment biases are an impor-tant confounding factor that should be borne in mind when interpreting these results. At last, we also observe that the
W528 Nucleic Acids Research, 2019, Vol. 47, Web Server issue
CLC set tends to be less tissue specific, more cytoplasmic (their nuclear/cytoplasmic ratio is significantly lower) (Fig-ure3A), and enriched with hits from proliferation CRISPR screens (Figure3B).
Similar Gene Discovery‘M-to-N’ functionality may com-plement the above analysis to interrogate unknown lists of genes and help to prioritize candidates based on similarity to known lncRNAs. For example, to select potential cancer-associated lncRNAs for experimental validation from a list of novel candidates, one can assess their similarity to CLC genes.
In addition,Similar Gene Discovery‘1-to-N’ functional-ity makes it possible to search for the most similar genes to a given lncRNA, in order to discover new, functionally-related lncRNAs. For example, in searching for lncR-NAs similar to the X-inactive specific transcript, XIST
(37), LnCompare reports the maternally-expressed gene 8 (MEG8) to be the most similar (cosine similarity 0.9). Interestingly, both genes are associated with imprinting, are expressed during early development and have nuclear-restricted localization (38–40). Moreover,MEG8has been reported to interact with chromatin-binding proteins and repressor complexes (41,42). An important caveat is the fact that some lncRNAs are present in the functional database lncRNAdb, and this will influence the similarity analysis re-sults without necessarily representing biological similarity. In order to eliminate this possible confounder, we removed the phenotype-associated feature class and repeated the analysis. This analysis now identifiesENSG00000272872as the most similar toXIST. This lncRNA has been linked to various cancers in the lncRNADisease v2.0 database (43), making it an interesting candidate to study.
DISCUSSION
In recent years there has been a dramatic acceleration in the volumes of lncRNA gene candidates emerging from ge-nomic studies. However, we remain broadly ignorant about molecular mechanisms and biological roles of these genes. Classical methods to describe newly discovered genes or to assess gene sets are inefficient for lncRNAs. This has created a need for tools to study the properties of lncRNA sets, in order to formulate new hypotheses from or gauge the suc-cess of high-throughput experiments.
To meet this need, we have curated a comprehensive fea-ture set covering diverge quantitative and categorical as-pects of lncRNAs from the GENCODE annotation. Using these features, LnCompare searches for those that are sig-nificantly over- or under-represented in an input set com-pared to background. In a set of lncRNAs with known roles in cancer (35), LnCompare identifies a range of char-acteristic features, including elevated expression and evolu-tionary conservation. Moreover, it also identifies other at-tributes including higher cytoplasmic localization and ubiq-uitous expression. These features may guide researchers to focus on potential molecular activities related to cytoplas-mic processes, in contrast to most studies that concentrate on lncRNAs’ roles in chromatin regulation (44–46). More-over, LnCompare assesses similarity between genes, which can be a powerful strategy to identify new genes playing similar roles to known examples. Conversely, such similarity
analysis could be used to predict the roles of novel lncRNAs by similarity to known genes. We anticipate that LnCom-pare will be useful to the many colleagues who presently study lncRNAs at the global scale and wish to extract more biological insights from their data.
SUPPLEMENTARY DATA
Supplementary Dataare available at NAR Online.
ACKNOWLEDGEMENTS
We acknowledge administrative support from Deborah Re and Silvia Roesselet (DBMR).
FUNDING
National Natural Science Foundation of China [81672113]; Swiss National Science Foundation through the National Center of Competence in Research (NCCR) ‘RNA & Dis-ease’; Medical Faculty of the University and University Hospital of Bern; Helmut Horten Stiftung. Funding for open access charge: Core funding.
Conflict of interest statement.None declared.
REFERENCES
1. Marchese,F.P., Raimondi,I. and Huarte,M. (2017) The
multidimensional mechanisms of long noncoding RNA function. Genome Biol.,18, 206.
2. Derrien,T., Johnson,R., Bussotti,G., Tanzer,A., Djebali,S., Tilgner,H., Guernec,G., Martin,D., Merkel,A., Knowles,D.G.et al. (2012) The GENCODE v7 catalog of human long noncoding RNAs: analysis of their gene structure, evolution, and expression.Genome Res.,22, 1775–1789.
3. Mercer,T.R., Dinger,M.E., Sunkin,S.M., Mehler,M.F. and Mattick,J.S. (2008) Specific expression of long noncoding RNAs in the mouse brain.Proc. Natl. Acad. Sci. U.S.A.,105, 716–721. 4. Bonetti,A. and Carninci,P. (2017) From bench to bedside: the long
journey of long non-coding RNAs.Curr. Opin. Syst. Biol.,3, 119–124.
5. Sun,M. and Kraus,W.L. (2015) From discovery to function: the expanding roles of long noncoding RNAs in physiology and disease. Endocr. Rev.,36, 25–64.
6. Liu,S.J., Horlbeck,M.A., Cho,S.W., Birk,H.S., Malatesta,M., He,D., Attenello,F.J., Villalta,J.E., Cho,M.Y., Chen,Y.et al.(2017) CRISPRi-based genome-scale identification of functional long noncoding RNA loci in human cells.Science,355, aah7111. 7. Ounzain,S., Micheletti,R., Beckmann,T., Schroen,B., Alexanian,M.,
Pezzuto,I., Crippa,S., Nemir,M., Sarre,A., Johnson,R.et al.(2015) Genome-wide profiling of the cardiac transcriptome after myocardial infarction identifies novel heart-specific long non-coding RNAs.Eur. Heart J.,36, 353–368.
8. Gao,Y., Wang,P., Wang,Y., Ma,X., Zhi,H., Zhou,D., Li,X., Fang,Y., Shen,W., Xu,Y.et al.(2019) Lnc2Cancer v2.0: updated database of experimentally supported long non-coding RNAs in human cancers. Nucleic Acids Res.,47, D1028–D1033.
9. Kashi,K., Henderson,L., Bonetti,A. and Carninci,P. (2015) Discovery and functional analysis of lncRNAs: Methodologies to investigate an uncharacterized transcriptome.Biochim. Biophys. Acta,1859, 3–15. 10. Zhu,S., Li,W., Liu,J., Chen,C.-H., Liao,Q., Xu,P., Xu,H., Xiao,T.,
Cao,Z., Peng,J.et al.(2016) Genome-scale deletion screening of human long non-coding RNAs using a paired-guide RNA CRISPR–Cas9 library.Nat. Biotechnol.,34, 1279–1286. 11. Ali,M.M., Akhade,V.S., Kosalai,S.T., Subhash,S., Statello,L.,
Meryet-Figuiere,M., Abrahamsson,J., Mondal,T. and Kanduri,C. (2018) PAN-cancer analysis of S-phase enriched lncRNAs identifies oncogenic drivers and biomarkers.Nat. Commun.,9, 883.
12. Kanehisa,M., Goto,S., Sato,Y., Kawashima,M., Furumichi,M. and Tanabe,M. (2014) Data, information, knowledge and principle: back to metabolism in KEGG.Nucleic Acids Res.,42, D199–D205. 13. Ashburner,M., Ball,C.A., Blake,J.A., Botstein,D., Butler,H.,
Cherry,J.M., Davis,A.P., Dolinski,K., Dwight,S.S., Eppig,J.T.et al. (2000) Gene Ontology: tool for the unification of biology.Nat. Genet.,25, 25–29.
14. The Gene Ontology Consortium (2019) The Gene Ontology Resource: 20 years and still GOing strong.Nucleic Acids Res.,47, D330–D338.
15. Mi,H., Huang,X., Muruganujan,A., Tang,H., Mills,C., Kang,D. and Thomas,P.D. (2017) PANTHER version 11: expanded annotation data from Gene Ontology and Reactome pathways, and data analysis tool enhancements.Nucleic Acids Res.,45, D183–D189.
16. Carbon,S., Ireland,A., Mungall,C.J., Shu,S., Marshall,B., Lewis,S., Hub,AmiGO and Web Presence Working Group (2009) AmiGO: online access to ontology and annotation data.Bioinformatics,25, 288–289.
17. Eden,E., Navon,R., Steinfeld,I., Lipson,D. and Yakhini,Z. (2009) GOrilla: a tool for discovery and visualization of enriched GO terms in ranked gene lists.BMC Bioinformatics,10, 48.
18. Reimand,J., Arak,T., Adler,P., Kolberg,L., Reisberg,S., Peterson,H. and Vilo,J. (2016) g:Profiler––a web server for functional
interpretation of gene lists (2016 update).Nucleic Acids Res.,44, W83–W89.
19. Du,Z., Li,L., Chen,C.-F., Yu,P.S. and Wang,J.Z. (2009) G-SESAME: web tools for GO-term-based gene similarity analysis and knowledge discovery.Nucleic Acids Res.,37, W345–W349.
20. Pesaranghader,A., Matwin,S., Sokolova,M. and Beiko,R.G. (2016) simDEF: definition-based semantic similarity measure of gene ontology terms for functional similarity analysis of genes. Bioinformatics,32, 1380–1387.
21. Zhang,P., Zhang,J., Sheng,H., Russo,J.J., Osborne,B. and Buetow,K. (2006) Gene functional similarity search tool (GFSST).BMC Bioinformatics,7, 135.
22. Wang,J.Z., Du,Z., Yu,P.S. and Chen,C.-F. (2007) An Efficient Online Tool to Search Top-N Genes with Similar Biological Functions in Gene Ontology Database. In:2007 IEEE International Conference on Bioinformatics and Biomedicine (BIBM 2007). IEEE, Fremont, pp. 406–411.
23. Jiang,Q., Ma,R., Wang,J., Wu,X., Jin,S., Peng,J., Tan,R., Zhang,T., Li,Y. and Wang,Y. (2015) LncRNA2Function: a comprehensive resource for functional investigation of human lncRNAs based on RNA-seq data.BMC Genomics,16, S2.
24. Zhao,Z., Bai,J., Wu,A., Wang,Y., Zhang,J., Wang,Z., Li,Y., Xu,J. and Li,X. (2015) Co-LncRNA: investigating the lncRNA combinatorial effects in GO annotations and KEGG pathways based on human RNA-Seq data.Database,2015, bav082.
25. Guo,X., Gao,L., Liao,Q., Xiao,H., Ma,X., Yang,X., Luo,H., Zhao,G., Bu,D., Jiao,F.et al.(2013) Long non-coding RNAs function annotation: a global prediction method based on bi-colored networks.Nucleic Acids Res.,41, e35.
26. Alam,T., Uludag,M., Essack,M., Salhi,A., Ashoor,H., Hanks,J.B., Kapfer,C., Mineta,K., Gojobori,T. and Bajic,V.B. (2017) FARNA: knowledgebase of inferred functions of non-coding RNA transcripts. Nucleic Acids Res.,45, 2838–2848.
27. Beißbarth,T., Speed Walter,T.P. and Hall,E. (2004) GOstat: find statistically overrepresented Gene Ontologies within a group of genes. Bioinformatics,20, 1464–1465.
28. Zheng,Q. and Wang,X.-J. (2008) GOEAST: a web-based software toolkit for Gene Ontology enrichment analysis.Nucleic Acids Res., 36, W358–W363.
29. Li,J., Han,X., Wan,Y., Zhang,S., Zhao,Y., Fan,R., Cui,Q. and Zhou,Y. (2018) TAM 2.0: tool for MicroRNA set analysis.Nucleic Acids Res.,46, W180–W185.
30. Obayashi,T., Kagaya,Y., Aoki,Y., Tadaka,S. and Kinoshita,K. (2019) COXPRESdb v7: a gene coexpression database for 11 animal species supported by 23 coexpression platforms for technical evaluation and evolutionary inference.Nucleic Acids Res.,47, D55–D62.
31. Frankish,A., Diekhans,M., Ferreira,A.-M., Johnson,R., Jungreis,I., Loveland,J., Mudge,J.M., Sisu,C., Wright,J., Armstrong,J.et al. (2019) GENCODE reference annotation for the human and mouse genomes.Nucleic Acids Res.,47, D766–D773.
32. Carlevaro-Fita,J., Camaioni,A.A.L., Feuerbach,L., Hong,C., MasPonte,D., Guigo,R., Pedersen,J.S., Johnson,R. and 25914, -PCAWG Driver Identification Working Group (2017) Unique genomic features and deeply-conserved functions of long non-coding RNAs in the Cancer LncRNA Census (CLC). bioRxiv doi: https://doi.org/10.1101/152769, 25 August 2017, preprint: not peer reviewed.
33. Murthy,T., Bluemn,T., Gupta,A.K., Reimer,M., Rao,S., Pillai,M.M. and Minella,A.C. (2018) Cyclin-dependent kinase 1 (CDK1) and CDK2 have opposing roles in regulating interactions of splicing factor 3B1 with chromatin.J. Biol. Chem.,293, 10220–10234. 34. Benjamini,Y., Hochberg,Y., Hochberg,Y., Benjamini,Y. and
Benjamin,Y. (1995) Controlling the false discovery rate: a practical and powerful approach to multiple testing.J. R. Stat. Soc B,50, 289–300.
35. Lanz ´os,A., Carlevaro-Fita,J., Palumbo,E., Reverter,F., Mularoni,L., Guig ´o,R. and Johnson,R. (2017) Discovery of cancer driver long noncoding RNAs across 1112 Tumour Genomes: new candidates and distinguishing features.Sci. Rep.,7, 41544.
36. Furney,S.J., Higgins,D.G., Ouzounis,C.A. and L ´opez-Bigas,N. (2006) Structural and functional properties of genes involved in human cancer.BMC Genomics,7, 3.
37. Brown,C.J., Hendrich,B.D., Rupert,J.L., Lafreni`ere,R.G., Xing,Y., Lawrence,J. and Willard,H.F. (1992) The human XIST gene: Analysis of a 17 kb inactive X-specific RNA that contains conserved repeats and is highly localized within the nucleus.Cell,71, 527–542. 38. Hatada,I., Morita,S., Obata,Y., Sotomaru,Y., Shimoda,M. and
Kono,T. (2001) Identification of a new imprinted gene, Rian, on mouse chromosome 12 by fluorescent differential display screening.J. Biochem.,130, 187–190.
39. Charlier,C., Segers,K., Wagenaar,D., Karim,L., Berghmans,S., Jaillon,O., Shay,T., Weissenbach,J., Cockett,N., Gyapay,G.et al. (2001) Human-ovine comparative sequencing of a 250-kb imprinted domain encompassing the callipyge (clpg) locus and identification of six imprinted transcripts: DLK1, DAT, GTL2, PEG11, antiPEG11, and MEG8.Genome Res.,11, 850–862.
40. Inoue,A., Jiang,L., Lu,F. and Zhang,Y. (2017) Genomic imprinting of Xist by maternal H3K27me3.Genes Dev.,31, 1927–1932. 41. Terashima,M., Ishimura,A., Wanna-udom,S. and Suzuki,T. (2018)
MEG8long noncoding RNA contributes to epigenetic progression of the epithelial-mesenchymal transition of lung and pancreatic cancer cells.J. Biol. Chem.,293, 18016–18030.
42. Guttman,M., Donaghey,J., Carey,B.W., Garber,M., Grenier,J.K., Munson,G., Young,G., Lucas,A.B., Ach,R., Bruhn,L.et al.(2011) lincRNAs act in the circuitry controlling pluripotency and differentiation.Nature,477, 295–300.
43. Bao,Z., Yang,Z., Huang,Z., Zhou,Y., Cui,Q. and Dong,D. (2019) LncRNADisease 2.0: an updated database of long non-coding RNA-associated diseases.Nucleic Acids Res.,47, D1034–D1037. 44. Mercer,T.R. and Mattick,J.S. (2013) Structure and function of long
noncoding RNAs in epigenetic regulation.Nat. Struct. Mol. Biol.,20, 300–307.
45. Chen,L.-L. and Carmichael,G.G. (2009) Altered nuclear retention of mRNAs containing inverted repeats in human embryonic stem Cells: Functional role of a nuclear noncoding RNA.Mol. Cell,35, 467–478. 46. Guttman,M., Garber,M., Bernstein,B.E., Rinn,J.L., Khalil,A.M.,
van Oudenaarden,A., Rivea Morales,D., Lander,E.S., Regev,A., Thomas,K.et al.(2009) Many human large intergenic noncoding RNAs associate with chromatin-modifying complexes and affect gene expression.Proc. Natl. Acad. Sci. U.S.A.,106, 11667–11672. 47. Bao,W., Kojima,K.K. and Kohany,O. (2015) Repbase Update, a
database of repetitive elements in eukaryotic genomes.Mob. DNA,6, 11.