Interactive Visualizations on Large and Small Displays: The
Interrelation of Display Size, Information Space, and Scale
Mikkel R. Jakobsen and Kasper Hornbæk
Abstract—In controlled experiments on the relation of display size (i.e., the number of pixels) and the usability of visualizations, the size of the information space can either be kept constant or varied relative to display size. Both experimental approaches have
limitations. If the information space is kept constant then the scale ratio between an overview of the entire information space and the lowest zoom level varies, which can impact performance; if the information space is varied then the scale ratio is kept constant, but performance cannot be directly compared. In other words, display size, information space, and scale ratio are interrelated variables. We investigate this relation in two experiments with interfaces that implement classic information visualization techniques—focus+context, overview+detail, and zooming—for multi-scale navigation in maps. Display size varied between 0.17, 1.5, and 13.8 megapixels. Information space varied relative to display size in one experiment and was constant in the other. Results suggest that for tasks where users navigate targets that are visible at all map scales the interfaces do not benefit from a large display: With a constant map size, a larger display does not improve performance with the interfaces; with map size varied relative to display size, participants found interfaces harder to use with a larger display and task completion times decrease only when they are normalized to compensate for the increase in map size. The two experimental approaches show different interaction effects
between display size and interface. In particular, focus+context performs relatively worse at a large display size with variable map size, and relatively worse at a small display size with a fixed map size. Based on a theoretical analysis of the interaction with the visualization techniques, we examine individual task actions empirically so as to understand the relative impact of display size and scale ratio on the visualization techniques’ performance and to discuss differences between the two experimental approaches. Index Terms—Information visualization, multi-scale navigation, interaction techniques, experimental method, user studies.
1 INTRODUCTION
Information visualization has been shown useful for many tasks [10,12]. However, interactive visualization techniques have mostly been investigated on desktop displays, despite the increase in the range of display sizes in common use from mobile devices to large high-resolution displays. It is unclear for instance how visualizations scale to large high-resolution displays that allow more information to be shown at a time. Such displays have been found to improve task performance and user satisfaction [13,29]. But do the benefits of large displays combine with those of interactive visualization
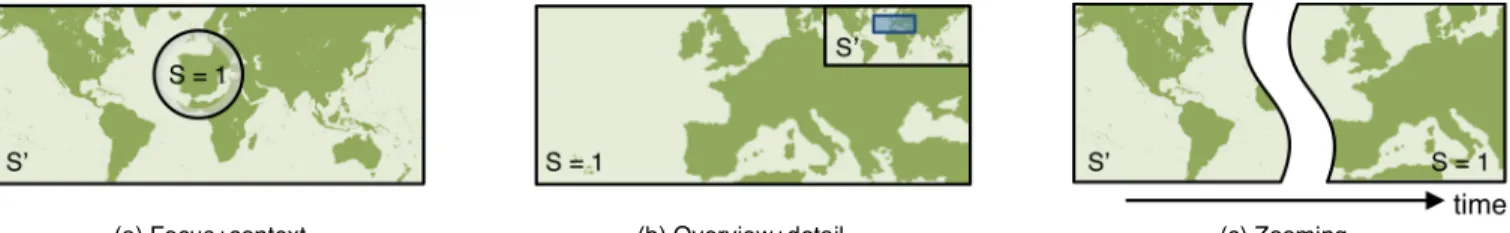
techniques? This paper answers such questions by investigating the relation between display size (i.e., the number of pixels) and the usability of three classic visualization techniques for multi-scale navigation: overview+detail, focus+context, and zooming interfaces. In previous controlled experiments on the relation between display size and the usability of visualizations, the size of the information space has been kept constant (e.g., [3–5,22]) or varied relative to display size [30,31]. Fig. 1 illustrates the two approaches using space-scale diagrams [14]. For comparing interactive visualization techniques, both approaches have limitations. In experiments that keep the information space constant (what we call the fixed-information-space approach, a in Fig. 1), the ratio between the scale of an overview of the entire information space (S’ in Fig. 1) and the highest scale (S in Fig. 1) varies. Varying the scale ratio can impact the performance of visualization techniques, but it is impossible to infer how from the results. In experiments that
manipulate the size of the information space (the
variable-information-space approach, b in Fig. 1), the scale ratio can be kept
Fig. 1. Space-scale diagrams illustrating two experimental comparisons of zooming interfaces with display size varied between D and 2D: (a) Constant information space (of size 2I) is used for both display size conditions (left and middle diagram); scale ratio S/S’ varies between display sizes. (b) Variable information space (2I vs. I) is used for the display size conditions (middle and right diagram); scale ratio S/S’ is constant across display size conditions.
• Mikkel R. Jakobsen is with University of Copenhagen, E-Mail:
• Kasper Hornbæk is with University of Copenhagen, E-Mail: [email protected].
Manuscript received 31 March 2013; accepted 1 August 2013; posted online 13 October 2013; mailed on 5 October 2013.
For information on obtaining reprints of this article, please send e-mail to: [email protected].
constant. But because data and tasks differ across display sizes, performance cannot be compared in absolute measures. In other words, the size of display, the size of information space, and the scale ratio are interrelated variables. One consequence hereof is that experiments following one approach may reach different conclusions than experiments following the other approach. In this paper, we examine the relations between display size, information space, and scale by empirically comparing experiments following each approach. While large displays often have a low resolution or pixel
density (e.g., a single 1024×768 image projected onto a 2-meter
surface), we keep the resolution constant: when we increase the physical display size, the total number of pixels increases as well (as is the case when adding more monitors to a tiled display).
In a previous experiment with overview+detail, focus+context, and zooming interfaces for multi-scale navigation, we used the same information space across three display sizes. The experiment is fully reported in another paper [22]. This paper presents a replication of that experiment, in which the size of the information space was varied relative to display size. We analyze the differences in experimental designs and the results from the two experiments. We have two aims with this work. One aim is to better understand the relation between display size and the usability of visualization techniques for multi-scale navigation. Our hope is to provide data for adapting existing visualization techniques and developing new techniques for smaller and larger displays. A second aim is to understand the two experimental approaches. This is important for understanding why research reaches different conclusions about how visualizations benefit (e.g., [4]) from large displays or not (e.g., [22]), and whether the discrepancies are due to differences in the experimental approaches. Our hope is thus also to help develop the methods used in empirical information visualization research. 2 REL ATED WORK
Many papers have reported on techniques for interacting with information on small screens (e.g., [8,18]) and on large high-resolution displays (e.g., [13,16,28]). The benefits of large displays have been researched in several studies. For instance, large displays have been shown to help spatially organize the information to reduce window management [4] and to help in sense-making [1].
Interactive visualizations have been much researched [10,27]. The relative strengths and drawbacks of techniques that transform the view of a visual structure are well known and have recently been reviewed for three prominent techniques [12]. Given the increase in the range of display sizes in common use, however, there are surprisingly few studies investigating the relation between information visualization and display size.
As mentioned in the introduction, two distinct approaches may be taken to comparing information visualizations for different sizes of display. Next we focus on describing existing comparisons and their experimental approach.
2.1 Fixed-information-Space
Several studies have used a fixed-information-space approach to comparing visualizations on displays of varying size, and for different reasons. In many studies that follow this approach, the data have fit the largest display condition [3,4,18]. For instance, Gutwin and Fedak [18] compared three small-screen conditions (panning, two-level zoom, and a fisheye view) to a baseline 20-inch “normal screen” condition. Their motivation was to see how application interfaces that fit within a normal-sized screen could be used on a small screen that requires navigation. Ball and North compared navigation tasks using a zoom+pan interface with one, four, and nine tiled monitors, where data fit the nine-monitor display [3]. Ball and North [4] compared four conditions in which the use of physical navigation and peripheral vision was varied. A fixed-size map was used that fit the space of a 50-monitor display wall, so that virtual navigation was not needed in conditions that involved physical navigation. Overall, these studies by Ball and colleagues have shown
that participants physically navigate more and perform better with visualizations on large high-resolution displays.
Few studies have used information spaces that are too large to fit within the display space of both small and large size conditions. Ball et al. [5] used a map that fit inside a 24-monitor tiled display. Virtual navigation was required in seven of eight display size conditions, but participants had to use a semantic zooming scheme in all conditions in order to see details about houses shown in the map. Jakobsen and Hornbæk [22] compared three interactive visualization techniques for three display sizes. Because the information space contained nine times the pixels of the largest display condition, participants were required to navigate the information space in order to solve tasks in all display size conditions (see section 4.2).
The fixed-information-space approach used in the studies just described allows direct comparison of performance measures because users perform the same task using an interface. However, the scale at which the entire data space can be shown in displays of different sizes varies, which may influence performance.
2.2 Variable-information-Space
In the studies we are aware of that follow a variable-information-space approach, data have fit within the display [30,31]. Yost and North [31] increased the amount of data with the number of pixels in order to investigate how different visualizations scale perceptually: whether an increase in the amount of data results “in an increase in task completion times when time is normalized to the amount of
data.” They found that 20× increase in data (from 250 data points
with 2 Mpixels up to 5000 data points with 32 Mpixels) resulted in a
3× increase in task performance times and no significant decrease in
accuracy. Yost et al. [30] similarly varied data size (up to 94192 data points) with display size in order to study whether limits of visual acuity impact performance with large information visualizations.
Because the data and thus also the tasks are varied between display-size conditions following this approach, only normalized task performance measures can be compared, as described above. The above papers required users to navigate (through physical movement) only in the large display condition since smaller data sets were used for the smaller displays. We do not argue that the approach taken is wrong given their focus on comparing different visualization designs, only that the choice of approach influences the results: We are curious how much users would gain in performance with a large high-resolution display that goes beyond the limits of visual acuity compared to smaller displays that would also require navigation when doing the same task (i.e., with 94192 data points).
In summary, experiments following either approach have limitations, and the results will most likely differ in some way, but it is not clear how. The two approaches and their differences have to our knowledge not been previously researched. We address this gap by comparing experiments that follow each approach for studying multi-scale navigation. Also, this is as far as we know the first study that uses a variable-information-space approach for comparing visualizations using information spaces that do not fit within any of the display size conditions.
3 EXPERIMENTS: COMMON PART
We conducted two experiments with interfaces for navigating geographical maps. The aim was to isolate display size as a factor in the comparison of interactive visualization techniques. In a fixed-information-space experiment, we used maps of the same size for all display sizes, which allows for absolute comparisons of performance measures, but causes scale ratios to vary. In a variable-information-space experiment, we varied the map size relative to display size so that the scale ratios are constant across display sizes, but does not allow direct comparisons because performance with maps of different sizes is measured.
The experiments were designed so as to build on existing work on information visualization. The interfaces provided typical implementations of focus+context, overview+detail, and zooming.
We chose these three techniques because they are widely used and because they represent categories that are fundamentally different in how detailed and contextual views are separated by time or space [12]: In overview+detail, views are spatially separated; in zooming, views are temporally separated; in focus+context, detail is displayed within its surrounding context. Although overview+detail and zooming can be combined (e.g., Hornbæk et al. [21] compared zooming interfaces with and without overview), we chose to study them separately as representations of their individual categories. Other techniques can be less clearly categorized: For instance, techniques such as Magic Lenses [7] can be categorized as overview+detail, but they also bear similarity to fisheye lenses, making the distinction less clear [12]. We also aimed for the implementations to resemble those typically used in the literature, as judged from the research reviewed by Cockburn et al. [12] and by reviewing recent research. We therefore did not implement improvements such as speed-coupled flattening [24] or high-precision magnification lenses [2]. Also, the tasks that participants performed were similar to those used in previous research on information visualization or large displays [4,26].
Next, we describe the design and procedure common to the experiments. In section 4 we describe how the experiments differed with respect to maps and tasks.
3.1 Method
Both experiments used a within-subjects design in which the factors display size (Small, Medium, Large), interface (focus+context, overview+detail, zooming), and task type (Navigate, Compare, Trace) were varied. Participants performed tasks of all types in each of nine blocks and a unique combination of display size and interface was used for each block. In order to reduce the influence of learning effects, the combinations were systematically varied across participants using a Greco-Latin square. The order of task types was randomly varied across blocks.
3.2 Apparatus
A 13.8 megapixel (5760×2400) display was used. The display
consisted of six 24” LCD monitors each containing 1920×1200
pixels, all operated by a single Radeon HD 5870 Eyefinity card. The
monitors were arranged in a 3×2 grid curved around the user with a
135° horizontal angle between monitors.
Three display sizes were used: The Small condition used
640×267 pixels of the upper-center panel; Medium used 1920×800
pixels; and Large used all 5760×2400 of the display. The aspect ratio
was thus kept constant at 2.4:1 across the display sizes. The resolution of the display was 94 pixels per inch in all conditions.
A Logitech LX8 wireless laser mouse with a scroll-wheel was used for input. We used default mouse settings in Windows 7. 3.3 Interfaces
The participants navigated the maps using three interfaces. The interfaces were implemented in Java using an adapted version of the ZVTM library [23]. All interfaces updated the screen at a minimum of 15 frames per second, which users found acceptable in informal evaluations. We did not control for frame rate. All interfaces allowed users to navigate the view to see part of the map at the highest level of detail, which is the representation at scale 1, S = 1, in Fig. 1.
3.3.1 Focus+Context
The focus+context interface, illustrated in Fig. 2(a), shows the entire map at the highest possible scale, the context scale S’. We used a Gaussian lens with an L(2) radial metric to magnify the focus region at the mouse cursor [11]. The lens has a flat top showing the focus area at constant magnification (i.e., scale 1). The lens has a diameter of 50% (the flat top, 30%) of the display height. The flat top was 80, 240, and 720 pixels for Small, Medium, and Large. Our aim was for the focus+context interface to be similar to how previous research implemented focus+context. Therefore we looked at the specific implementations in 14 empirical studies of fisheye interfaces published between 2000 and 2009 (e.g., [9,17,19,20]). A flat top lens was most frequently used and typically with a diameter around 30%. The literature shows many improvements to focus+context interfaces, but we chose to use an unmodified implementation. The reason is that we wanted a typical implementation of focus+context.
3.3.2 Overview+Detail
The overview+detail interface, illustrated in Fig. 2(b), contains a
detail view that shows part of the map at scale 1. The interface also contains an overview window in the upper right corner of the screen that shows the entire map at a lower scale S’. The user can pan the detail view by clicking and dragging the mouse opposite the panning direction so that the map follows the mouse. When the mouse pointer is over the overview, the user can click and hold the left mouse button to drag a field-of-view box in order to pan the detail view. If the user clicks on a point in the overview outside the field-of-view box, the detail view centers on that point. We reviewed 13 studies mentioned in the review of Cockburn et al. [12] and found that the median size of the overview widget was 10% of the display area. Having a field-of-view and the possibility of interacting with it were also typical among the reviewed studies.
3.3.3 Zooming
The zooming interface, illustrated in Fig. 2(c), presents a view of the information space that can be panned in the same way as the detail view in the overview+detail interface. The user can also zoom in or out to view the map at different scales. Zooming is constrained between scale S’ at which the entire map fits in the display and scale 1; the two scales correspond to the left and right part of Fig. 2(c). The user scrolls the mouse wheel forward to zoom to a lower scale, and backward to zoom to a higher scale. Transitions between scales use a 200 ms animation, but we set the zoom rate so that zooming from the highest to the lowest scale (or vice versa) could be done in 300 ms. The mouse cursor is used as the center of zooming, similar to how map interfaces like Google Maps (maps.google.com) work. 3.4 Tasks
Tasks were about using geographical maps. Participants completed a block of tasks with each combination of interface and display size, using a different map in each block. The maps at scale 1 were generated from OpenStreetMap (www.openstreetmap.org) and showed large cities at zoom levels where most street names were visible. Tasks used targets superimposed on the maps. To make targets perceptible at all scales and with a wider field-of-view, we surrounded them with an animated halo of increasing radius in a one-second repeating loop. Participants performed three types of task:
(a) Focus+context (b) Overview+detail (c) Zooming
Fig. 2. Illustration of the three interfaces used in the experiments. S = 1 is the scale that shows the information space at the highest level of detail. S’ is the scale used for showing the entire information space and is the lowest scale used in the interface.
• Navigate tasks, where a single target (40×40 map pixels, i.e., at scale 1) was shown on the map. The target could only be selected at scale 1, at which the target would change so as to indicate that it could be selected. Clicking on the target completed the task.
• Compare tasks, where three targets (40×40 map pixels) were
shown on the map, placed equidistant to each other. Each target had a label showing a number; the label was visible only at scale 1. Participants were asked to compare the targets to determine the target with the highest number. A similar type of task was used by Ball and North [4]. Targets could only be selected at scale 1 and clicking on a target finished the task.
• Trace route tasks, where a green triangle and a red circle on the
map indicated the start and end point of a route. Participants had to click the green triangle and then click all overpasses along the route. The routes used in the tasks were sections of major roads that were distinguishable at all scales for all display sizes. A similar task was used by Shupp et al. [26]. Participants finished the task by clicking on the red circle.
3.5 Dependent variables
Task completion time, accuracy, and subjective measures of mental effort were collected automatically for use as dependent variables. Data describing participants’ interaction with the interfaces were also logged. For subjective satisfaction, we used the Subjective Mental Effort Questionnaire (SMEQ), which uses a graphical rating scale that is annotated with descriptions of effort [32]. In a comparison of one-question satisfaction questionnaires, Sauro and Dumas [25] found SMEQ to be easy to learn and use. We therefore administered the questionnaire to participants after the tasks in each of the 27
display size × interface × task type conditions. This provides us with
a fine-grained assessment of participants’ mental effort. 3.6 Procedure
During the experiment, participants sat with a distance of about 67cm between their face and each of the monitors. The field-of-view varied with display size between angles of 16° and 135°.
First, participants were given an introduction to each interface and each type of task, which included training with the different tasks on each combination of display size and interface. After the introduction, participants performed nine blocks of tasks, using a
different display size × interface combination for each block. A
window appeared before each task, prompting participants to start the task when ready. After participants clicked a ‘start’ button, targets appeared on the map and the mouse cursor was moved to the center of the display. After completing all trials of a particular type of task, an electronic version of SMEQ was administered to participants. Last, after completing all tasks, participants had the opportunity to comment on their use of the interfaces at the different display sizes. The variable-information-space experiment lasted about an hour and 15 minutes for each participant; the fixed-information-space experiment lasted one hour on average for each participant. Although interface is thereby confounded with total task time, we reasoned that the alternative approach (using fewer tasks for variable-information-space) would be a more serious confound.
4 EXPERIMENTS: DIFFERENCES
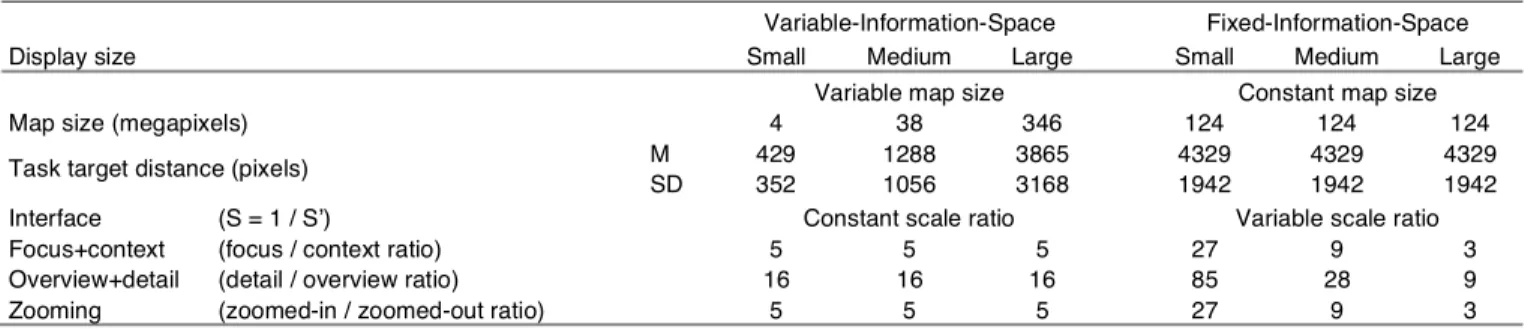
The two experiments differ in whether the information space is of a variable or constant size (see Fig. 1). These differences affect the maps and the tasks as shown in Table 1; below, we explain the differences and describe the participants in the two experiments. 4.1 Variable-Information-Space Experiment
In the variable-information-space experiment, map size (and thus also the tasks) was varied across display sizes so that the scale ratio between map size and display size was kept constant (see Table 1).
4.1.1 Maps and Tasks
Each map contained 25 times the number of pixels of the display and
had the same aspect ratio as the display: 3200×1333 pixels for Small,
9600×4000 pixels for Medium, and 28800×12000 pixels for Large.
The maps were generated at zoom level 17 and the maps used in Small and Medium were subsections of the map used in Large.
For Navigate tasks, targets were placed at distances of 9%, 28%, or 83% of the map height: 124, 370, 1111 map pixels for Small, 370, 1111, 3333 for Medium, and 1111, 3333, 10000 for Large. These distances were chosen so as to allow comparison of task performance for both relative and absolute distances; trials with a target distance of 1111 pixels were repeated for all display sizes. Nine tasks of this type were used, three for each distance. Targets were initially shown in the detail view (in overview+detail) for the short distances; otherwise, navigation was required for viewing the target at scale 1.
For Compare tasks, the distance between the targets were 5%,
16%, or 42% of the map height: 71, 213, 640 map pixels for Small, 213, 640, 1920 for Medium, and 640, 1920, 5760 for Large. These distances were chosen so that task performance could be compared for both relative and absolute distances; trials with a distance of 640 pixels between targets were repeated for all display sizes. Nine tasks of this type were used, three for each distance. Multiple targets could always be viewed simultaneously at scale 1 for short and medium distances, whereas navigation was required for long distances.
For Trace route tasks, routes were sections of roads about 500, 1500, and 4500 pixels in length for Small, Medium, and Large, respectively. Two tasks of this type were used. None of the routes fit entirely within the display and navigation was thus required.
In total, 20 repetitions of tasks were made in each of the nine blocks (9 Navigate, 9 Compare, 2 Trace), giving 180 data points for
each participant (3×3×20).
4.1.2 Participants
Twenty-five students (three female), ages between 22 and 31 years, participated in the experiment. The students were given course credit for their participation.
4.2 Fixed-Information-Space Experiment
In the fixed-information-space experiment [22], map size was kept constant across display sizes. Thus, participants completed the same tasks with different display size conditions, allowing us to make direct comparisons of performance measures.
For focus+context, the magnification in the lens flat top varies
between 3× in Large, 9× in Medium, and 27× in Small. See Table 1.
Table 1: The Differences in Maps, Tasks, and Scales Used in the Variable-Information-Space and Fixed-Information-Space Experiments Variable-Information-Space Fixed-Information-Space
Display size Small Medium Large Small Medium Large
Variable map size Constant map size
Map size (megapixels) 4 38 346 124 124 124
Task target distance (pixels) M 429 1288 3865 4329 4329 4329
SD 352 1056 3168 1942 1942 1942
Interface (S = 1 / S’) Constant scale ratio Variable scale ratio
Focus+context (focus / context ratio) 5 5 5 27 9 3
Overview+detail (detail / overview ratio) 16 16 16 85 28 9
4.2.1 Maps and Tasks
Each of the maps was 17280×7200 pixels. The maps were generated
at zoom level 16 and thus the maps contained roughly the same geographical area as the maps used in the Large condition of the fixed-information-space experiment.
For Navigate tasks, targets were placed at distances of 3500 or 7000 map pixels (about 50% and 100% of the map height) from the center of the map; their angle to the center was varied at random. Ten tasks of this type were used, five for each distance. Since targets were initially outside the detail view (in overview+detail) or lens (in focus+context) for all tasks, regardless of display size, navigation was required in order to view the target at scale 1.
For Compare tasks, the distance between targets varied between 1440, 3600, and 5760 map pixels (20%, 50%, or 80% of the map height). Nine tasks of this type were used, three for each distance. Multiple targets could always be viewed simultaneously at scale 1 within the Large display for short distances, but only sometimes for medium distances, and never for long distances.
For Trace route tasks, the routes were sections of roads about
3000 map pixels in length. Two tasks of this type were used. Whereas routes most often fit within the Large display, navigation was always required for Medium and Small.
In total, 21 repetitions of tasks were made for each of the nine
interface × display size combinations (10 Navigate, 9 Compare, 2
Trace), giving 189 data points for each participant (3×3×21).
4.2.2 Participants
Nineteen volunteers (five female), ages between 19 and 38 years, participated in the experiment. Participants were recruited by word of mouth and they received no compensation.
5 RES UL TS
We performed a repeated measures analysis of variance on the logarithmically transformed task completion times and on the SMEQ
ratings. To examine significant effects (at the p < .05 level) we
performed post-hoc comparisons with Bonferroni correction. Accuracy was uniformly high in both experiments (M = 99%, SD = 10%) and was not analyzed further.
5.1 Variable-Information-Space Experiment
5.1.1 Task Completion Times
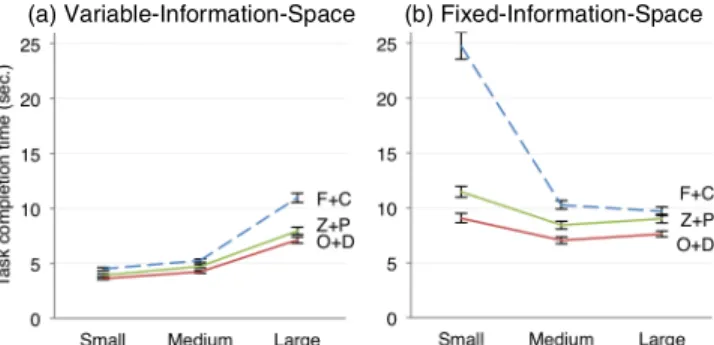
Average task completion times with the different display sizes and interfaces are shown in Fig. 3(a) for the variable-information-space experiment in which map size was varied relative to display size. We found a main effect of interface on task completion time, F(2, 48) = 69.325, p < .0001. Both overview+detail (M = 5.1s) and zooming (M = 5.4s) were faster than focus+context (M = 6.8s), whereas no overall difference was found between overview+detail and zooming. However, interface interacted with task type, F(4, 96) = 5.723, p < .0005. Pairwise comparisons showed that overview+detail and zooming performed better than focus+context for all tasks, and that overview+detail was faster than zooming only for Compare tasks (see Fig. 4).
A main effect was also found for display size, F(1.49, 35.84) =
1238.3, p < .0001. Overall, task times increase with display size by a factor of 1.18 from Small (M = 4.1s) to Medium (M = 4.8s), 1.76
from Medium to Large (M = 8.4s). An increase is expected: tasks
become increasingly difficult as target distances triple from Small to
Medium and from Medium to Large. However, the 3× increase in
target distance resulted in only 1.18× and 1.76× increases in task
times. Task times decrease when normalized per target distance, which indicates a performance improvement with larger displays.
An interaction was found between interface and display size, F(4,
96) = 21.419, p < .0001. Between interfaces, task times differ the
most for the Large display, where participants spent 39% more time with focus+context (M = 10.6s) than zooming (M = 7.6s).
Participants performed three Navigate tasks and three Compare tasks with the same target distance for each combination of interface and display size (N = 1350). We can directly compare completion times for these tasks across display sizes (see Fig. 5). For Navigate tasks, targets were located 1111 pixels from the initial position, which means that targets were initially visible in the detail view with overview+detail for the Large display. Participants therefore did not have to navigate using the overview. This might explain why completion times for these tasks do not increase from Medium to Large (Fig. 5(a)) as they do for Navigate overall (Fig. 4(a)). For Compare tasks where targets were 640 pixels apart, all targets could be viewed at scale 1 with both overview+detail and zooming for Medium and Large. This explains why completion times for these tasks decrease from Small to Medium and Large with overview+detail and zooming (Fig. 5(b)) while the times for Compare tasks overall increase from Small to Large (Fig. 4(b)).
5.1.2 Subjective Ratings of Effort
Average subjective mental effort ratings (using SMEQ) for the different display sizes and interfaces are shown in Fig. 6(a). Higher
(a) Variable-Information-Space (b) Fixed-Information-Space
Fig. 3. Average task completion times with focus+context (F+C), overview+detail (O+D), and zooming (Z+P) at different display sizes for the two experiments. Error bars show standard error of the mean.
(a) Navigate (b) Compare
Fig. 5. Average completion times with focus+context (F+C),
overview+detail (O+D), and zooming (Z+P) for tasks with equal target distance across display sizes in the variable-information-space experiment. Error bars show standard error of the mean. (a) Navigate (b) Compare (c) Trace
Fig. 4. Average completion times for different task types with focus+context (F+C), overview+detail (O+D), and zooming (Z+P) at different display sizes for the variable-information-space experiment. Error bars show standard error of the mean.
ratings indicate higher effort. A main effect for display size was
found, F(1.32, 30.36) = 47.616, p < .0001. Participants gave
significantly higher ratings with Large (M = 26.3, tasks were “a bit hard to do”) than both Medium (M = 14.2) and Small (M = 14.4). Ratings between Small and Medium did not differ. Target distances triple from Medium to Large, so it seems reasonable that participants would find tasks more demanding, but following this rationale it is not clear why participants did not rate Medium higher than Small.
We also found a main effect for interface, F(1.57, 36.12) =
28.381, p < .0001. Participants found overview+detail (M = 12.6)
easier to use than zooming (M = 17.0), p < .005, which in turn was found easier to use than focus+context (M = 25.1), p < .005.
An interaction of display size × interface was found, F(2.765,
63.598) = 57.629, p < .005. Between interfaces, ratings differ the
most with Large; participants gave focus+context (M = 36.8) a 59% higher rating, indicating higher effort, than zooming (M = 23.2). 5.2 Fixed-Information-Space Experiment
5.2.1 Task Completion Times
Average task completion times with the different display sizes and interfaces are shown in Fig. 3(b) for the fixed-information-space experiment in which map size was kept constant. We found a main
effect for interface, F(4, 36) = 118.05, p < .0001. Overview+detail
(M = 7.9s) was faster than zooming (M = 9.6s), p < .05, which was faster than focus+context (M = 14.9s), p < .001. However, we found
an interface × task type interaction, F(2.65, 47.69) = 13.666, p <
.0001, and comparisons showed that overview+detail performed better than the other interfaces only for Compare tasks.
A main effect was also found for display size, F(4, 36) = 167.59, p < .0001. Tasks were performed faster with Large (M = 8.8s) and Medium (M = 8.6s) than with Small (M = 15.1s). Unexpectedly, Large was slightly slower than Medium, p < .05. This finding is related to differences between interfaces, as suggested by Fig. 3(b).
An interaction effect was found between interface and display size, F(4, 72) = 38.904, p < .0001. Participants spent significantly more time with the Small display than with Medium, p < .0001, for all interfaces. Between interfaces, task times differ the most for the Small display, where focus+context performed exceptionally poor (M = 24.7s) compared with overview+detail (M = 9.1s) or zooming (M = 11.5s). Reasons for the poor performance of focus+context at
the Small display size could be that the very small lens top together with the increased compression in the transition between focus and context make targeting the lens more difficult, and also that the high control-display ratio makes it hard to acquire targets.
5.2.2 Subjective Ratings of Effort
Average SMEQ ratings for the different display sizes and interfaces are shown in Fig. 6(b). A main effect was found for display size, F(2, 32) = 91.178, p < .0001. Participants rated tasks as “fairly hard”
to “rather hard” to do (M = 48.9) with Small, significantly worse
than both Medium (M = 22.5) and Large (M = 19.9). There was no overall difference in ratings between Medium and Large.
A main effect was also found for interface, F(2, 32) = 71.438, p < .001. Participants rated both overview+detail (M = 18.4) and zooming (M = 21.2) as easier to use than focus+context (M = 51.7), but ratings did not differ between overview+detail and zooming.
An interaction of display size × interface was found, F(4, 64) =
57.629, p < .0001. Overview+detail was found more difficult to use
on Large (M = 18.3) than Medium (M = 12.0), p < .05, whereas
focus+context was found less difficult on Large (M = 25.0) than Medium (M = 37.9), p < .01. No difference was found for zooming. 5.3 Discussion of the Experimental Results
Results from the two experiments are summarized in Table 2 and Table 3. We expected tasks to be easier in the variable-information-space experiment because average map sizes, target distances, and scale ratios are lower (see Table 1). Indeed, overall task completion times were lower in the variable-information-space experiment (M = 5.8s, SD = 5.7s) than in the fixed-information-space experiment (M =
10.8s, SD = 12.0s). Subjective ratings of mental effort were also
lower for variable-information-space (M = 18.1, SD = 15.7) than for fixed-information-space (M = 29.8, SD = 29.7).
An effect of display size was found in both experiments. For variable-information-space, the results suggest a performance increase from Small to Medium and also from Medium to Large when task times are normalized per target distance. With fixed-information-space, participants completed tasks faster and reported lower efforts with Medium than with Small. A similar performance increase is not found from Medium to Large, however. One explanation for the different results from the two experiments is the difference in scale ratios, which is constant for variable-information-space, but decreasing from Medium to Large for fixed-information-space. However, it seems counterintuitive that a lower scale ratio from Small to Large should impact performance negatively. Another explanation is that normalized times are compared for variable-information-space, whereas times are directly compared for fixed-information-space. Normalizing times by target distance in pixels may not provide for reliable comparisons, however, because movement time does not scale linearly with target distance. Similarly, it is not clear how to interpret the higher SMEQ ratings from Medium to Large. The increase in target distances could have made tasks harder, requiring higher effort, but participants did not rate Medium higher than Small. Participants in a study by Yost and North [31] reported higher subjective workload for a 32-megapixel display than for a 2-megapixel display, but data size was varied relative to display size in that study and the difference in workload scores could in part be explained by a difference in task difficulty.
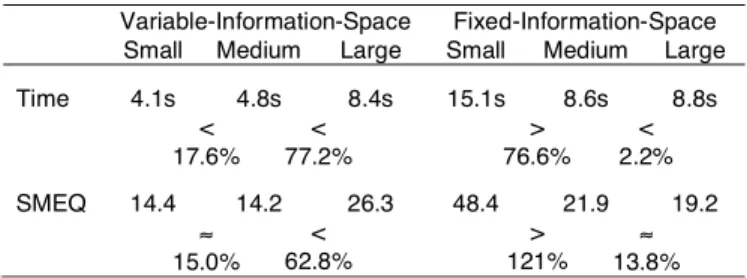
Table 3. Effects of Display Size in the Two Experiments Variable-Information-Space Fixed-Information-Space
Small Medium Large Small Medium Large
Time 4.1s 4.8s 8.4s 15.1s 8.6s 8.8s < 17.6% < 77.2% > 76.6% < 2.2% SMEQ 14.4 14.2 26.3 48.4 21.9 19.2 ≈ 15.0% < 62.8% > 121% ≈ 13.8% Table 2. Effects of Interface in the Two Experiments
Variable-Information-Space Fixed-Information-Space O+D Z+P F+C O+D Z+P F+C Time 5.1s 5.2s 6.8s 7.9s 9.6s 14.9s ≈ 5.9% < 25.9% < 21.5% < 55.2% SMEQ 12.4 16.7 25.1 17.6 20.4 51.5 < 34.7% < 50.3% ≈ 15.9% < 152%
(a) Variable-Information-Space (b) Fixed-Information-Space
Fig. 6. Average ratings of subjective mental effort (SMEQ) with focus+context (F+C), overview+detail (O+D), and zooming (Z+P) at different display sizes for the two experiments. Higher rating indicates higher effort. Error bars show standard error of the mean.
Also, both experiments show differences in performance with the interfaces. Focus+context is slower and is found harder to use by participants than overview+detail and zooming. Overview+detail performed better than zooming in the fixed-information-space experiment, whereas no difference was found in the variable-information-space experiment. Given that the average scale ratio is higher for fixed-information-space than for variable-information-space (see Table 1), this might indicate that overview+detail copes better with higher scale ratios than zooming.
Last, the experiments show different interactions of interface and display size. Focus+context performed relatively worse with Small for fixed-information-space, but performed relatively worse with Large for variable-information-space. For fixed-information-space, focus+context likely suffers from the high scale ratio with Small. For variable-information-space on the other hand, where scale ratio is constant, task times differ the least between interfaces with Small (where participants spent 11% more time with focus+context than zooming). Together, the results suggest that focus+context performs no worse with a smaller display given equal scale ratios.
6 ANALYZING THE EFFECT OF DIS PLAY SIZE
The results from the two experiments show different effects of display size. To better understand the reasons for these differences, we analyze users’ interaction in more detail. First, we identify the minimum actions required in performing the Navigate task, then describe the impact that the conditions in the two experiments have on those actions. Despite being the simplest experimental task, Navigate is difficult to model; the task comprises actions that are core to all the tasks; and the task leads to differences in performance between interfaces, display sizes, and experimental approaches that we seek to understand. Importantly, searching for targets that are visible at all scale levels does not require navigation, and hence the interaction costs for the task are dominated by navigation and selection of the target at scale 1. Second, we provide an analysis of the empirical data for those actions so as to better understand how task completion time relates to display size and scale ratio.
6.1 Modeling the Navigate Task
The Navigate task can be divided into three phases: initial searching for the target, navigating the view to see the target at scale 1, and selecting the target. The completion time comprises initial search
time, 𝑇!", view navigation time, 𝑇!", and target selection time, 𝑇!":
𝑇 = 𝑇!"+𝑇!"+𝑇!"
6.1.1 Focus+Context
The initial search time 𝑇!" depends on the field of view and the
saliency of the target. With the Large display, the initial search must cover a wider field of view: It is less likely that participants register the target in peripheral vision, resulting in a more costly serial search
for the target. We thus expect that 𝑇!" is higher for Large than
Medium, but no difference between Medium and Small.
The view navigation time 𝑇!" is the time it takes to bring the
target into the lens. This is a view-pointing task that can be modeled
with Fitts’s law [15]. Given the size of the lens flat top, 𝑊!!!, the size
of the target, 𝑊!!, and the distance to the target, 𝐷!!, all at context
scale (S’), the index of difficulty of view pointing with the lens is:
𝐼𝐷=log (1+ 𝐷!! 𝑊!!!−𝑊!!
)
Task difficulty is about the same with Large for variable-size
maps (𝐼𝐷 = 0.80) and fixed-size maps (𝐼𝐷 = 0.92), but is higher with
Small for fixed-size maps (𝐼𝐷 = 2.1) than variable-size maps (𝐼𝐷 =
1.03) because the scale ratio increases, which makes the lens size at
context scale (𝑊!!!) very small. This reasoning does not account for
non-motor efforts: For instance, as the lens increases in size from Small to Large the transition between focus and context becomes less compressed, which makes it easier to keep track of the target.
The target selection time 𝑇!" is the time it takes to select the
target once it is inside the flat top. Increasing the display size makes pointing more difficult because the distance from the target to the center of the lens increases as the flat top becomes larger, while the
target size at context scale (𝑊!!) increases with lower scale ratios.
6.1.2 Overview+Detail
For overview+detail, initial search time 𝑇!" is not expected to vary
with display size, because we expect participants to search only the overview (in which the target was always visible).
TVN is the time it takes to bring the target into the detail view via
the overview. This view pointing task has an index of difficulty 𝐼𝐷
(using the same equation as for focus+context), where 𝑊!!! is the
size of the detail view in overview pixels, 𝑊!! the size of the target in
overview pixels, and 𝐷!! the distance to the target in the overview.
On average, 𝐷!! is the distance from the center of the display to the
center of the overview (targets are distributed at equal distances
around the center of the map). 𝐷!! thus increases with display size.
This means that the task is more difficult for larger display sizes and
also for higher scale ratios (as 𝑊!!! decreases).
𝑇!" is the time spent pointing from the cursor’s current location in the overview to the target in the detail view. The distance from the overview to the target increases with display size, which means that the task difficulty increases with display size.
6.1.3 Zooming
For zooming, we expect longer search time 𝑇!" for Large, because
the initial search must cover a wider field of view, but no difference between Medium and Small.
𝑇!" is the time spent zooming-in and panning in combination
until the target is shown within the display at scale 1. This is a view-pointing task for which the index of difficulty is invariant of view size [15] (except for very small views). That is, display size should have no effect on time spent on view-navigation with zooming.
𝑇!" is the time spent pointing to the target when it is within view.
A larger display increases the possible distance to the target, which should increase task difficulty. However, target selection time is related to view-navigation accuracy: The user may navigate the view
faster to bring the target within view (shorter 𝑇!"), which will likely
result in a longer distance to the target (longer 𝑇!").
6.2 Empirical Analysis of the Navigate Task
Before analyzing completion times for Navigate tasks, we removed 73 trials that were more than three interquartile ranges above the
upper quartile for the display size × interface combination.
We calculated times for the three phases of the Navigate task for each interface, shown in Fig. 7(d-l); the total task time is shown in Fig. 7(a-c). For all interfaces, initial search time is calculated as the time spent before participants moved the mouse more than a threshold distance. We also calculated the mouse distance travelled in the view navigation and target selection phases, shown in Fig. 8, which helped us reason about effects of distance to targets in the tasks. Distances were calculated as the sum of Euclidean distances in screen coordinates between mouse events in the log data.
6.2.1 Focus+Context
For focus+context, initial search times (see Fig. 7(d)) are higher with Large than with Small and Medium as expected.
View navigation time 𝑇!" was calculated as the time spent after
the initial search until the first time the target’s center is inside the
lens flat top. The average 𝑇!" (see Fig. 7(g)) is 170% higher with
Large than Small for variable-information-space, much relative to
the small increase in average 𝐼𝐷. For fixed-size maps, 𝑇!" is 263%
higher with Small than Medium: this confirms that scale ratio
impacts performance, as explained by the higher 𝐼𝐷, but probably
also by the distortion in the focus-context transition.
Target selection time 𝑇!" is the time spent centering the target
inside the lens and clicking on the target. We calculated 𝑇!" as the
time spent from the target is inside the flat top until the participant
spent more time with Large than Small for variable-size maps, where scale ratio is constant across display sizes, which confirms the
relation between display size and 𝑇!". In contrast, times differ
relatively little between display sizes for fixed-size maps: Increased distance makes the task harder for Large, while increased scale ratio makes the task harder for Small.
6.2.2 Overview+Detail
For overview+detail, initial search times (see Fig. 7(e)) were largely unaffected by display size; targets are always visible in the overview. View navigation involves bringing the target into the detail view. Most tasks were completed using the mouse in the overview once (N = 981); some were completed without using the overview (N = 215), because the target was directly visible in the detail view; some used the overview multiple times (N = 37). For more accurate analysis we only include tasks that participants completed by using the overview
once. We calculated 𝑇!" as the time spent until the participant
releases the mouse button after having pressed down inside the overview widget. View navigation is slower for larger displays (Fig. 7(h)), as seen for variable-information-space, where both times and mouse travel distance increase as display size increases. Also, view
navigation is slower for higher scale ratios. 𝑇!" is lower with smaller
displays for variable-information-space, but not for fixed-information-space: Smaller displays result in shorter pointing
distances 𝐷!! (see Fig. 8(b)), which makes view-pointing easier, but
this is countered by the increase in scale ratio, which reduces the
view size 𝑊!!! and thus making view-pointing harder.
Target selection time 𝑇!" was calculated as the time spent from
the participant releases the mouse button until the participant clicks
on the target. In Fig. 7(k) we see 𝑇!" increase from Small to Large
for variable-information-space, and increase from Medium to Large for fixed-information-space. This confirms that target selection is
harder with larger displays. 𝑇!" seems higher with Small than
Medium for fixed-information-space. This is likely because some participants spent time panning the view to correct for inaccurate view navigation, which is due to the high scale ratio with Small: log data shows that participants panned in about 25% of the tasks.
For both view navigation and target selection, mouse travel distances increase with display size in both experiments, see Fig. 8(b) and (e). Also, mouse travel distances for each display size are similar between the two experiments, suggesting a strong correlation to display size (i.e., mouse distance is not related to target distance).
6.2.3 Zooming
For zooming, initial search times (see Fig. 7(f)) are higher with Large than with Small and Medium as we expected because participants has to search a wide field of view.
View navigation involves bringing the target inside the view at
scale 1. 𝑇!" was calculated as the time spent until scale 1 was
reached. Fig. 7(i) shows that 𝑇!" increases slightly with increasing
display size (increased 37% from Small to Large for variable-information-space), whereas difficulty of view pointing should be invariant of display size. We also note a slight increase in time from Medium to Large for fixed-information-space; with increasing scale ratio participants may have taken longer zooming in to scale 1.
Target selection time 𝑇!" was calculated as the time spent from
the view is at scale 1 until task completion. Fig. 7(l) shows that 𝑇!" increases from Small to Large for variable-information-space. Together with a similar increase in the mouse distance travelled (see Fig. 8(f)), this suggests that selection becomes increasingly difficult.
However, 𝑇!" decreases for fixed-information-space: Smaller
displays cause higher scale ratios and we suspect that participants spent time panning the view to correct for inaccurate view navigation (similar to overview+detail).
6.3 Summary
We have analyzed the Navigate task and compared the results from the two experiments so as to tease apart the effect of display size and scale ratio on performance with the three interfaces. For all
interfaces, both experiments have shown similar differences in initial search times between display sizes (see Fig. 7(d-f)). Focus+context and zooming require longer time to search for targets with larger displays, regardless of scale ratio. In contrast, overview+detail provides faster search for targets, regardless of display size; a key reason is that targets were visible at all scales used in the overview.
For focus+context, the poor performance with small displays for
Focus+context Overview+detail Zooming View navigation mouse distance
(a) (b) (c)
Target selection mouse distance
(d) (e) (f)
Fig. 8. Average mouse distance traveled (pixels) in view navigation (a-c) and target selection (d-f) phases of Navigate tasks. Note that the y-scales cover different ranges.
Fig. 7. Average time spent (seconds) in Navigate tasks in total (a-c), for search (d-f), for view navigation (g-i), and for target selection (j-l).
fixed-information-space can in part be explained by increased difficulty in view pointing, but it is difficult to tell how much is due to non-motor effects. The model does not capture non-motor effects, such as distortion in the transition between focus and context, which may be due to the lens implementation.
For overview+detail, we have found that both view navigation, through use of the overview, and the following target selection is slower for larger displays because of more movement of the mouse between the overview and the detail view. We have also found both view navigation and target selection to be slower for higher scale ratios, which may especially impact small displays.
Last, for zooming, we have found that increased search time is the key explanation why the performance with zooming performs worse with large displays. Similar to overview+detail, performance seems sensitive to higher scale ratios.
7 DIS CUS S ION
We compared two controlled experiments that relate display size to the performance of visualization techniques for navigating large information spaces. We discuss two main contributions of this work. 7.1 Information Visualization and Display Size
First, the two experiments contribute stronger data about the effects of display size on classic visualization techniques. An overall conclusion from the two experiments is that with these three techniques a larger display does not improve performance in multi-scale navigation tasks where targets are visible at all zoom levels. In fact, with information space varied relative to display size, task completion times decrease with larger display size only when normalized to compensate for the increase in information space and participants found the interfaces harder to use with the larger display. Other research, in contrast, has found performance increases with larger displays [3,5,6]. We note three differences in the tasks that may explain the difference in results. First, Ball et al. [6] found better performance in “find” and “trace route” tasks as the display increased in size from 1 to 9 monitors, but their tasks did not require users to interact with targets as our tasks did. Second, Ball et al. [5] found performance improvements and increased physical navigation with a large display. Time spent searching for targets was excluded from their navigation tasks, whereas it was included in our tasks. Third, Ball et al. [3] found that participants performed “find” and “compare” tasks faster using a 9-monitor tiled display: the large display supported visual search better—because more data could be shown at a level of detail where small targets can be identified—than a 1-monitor display that required zooming or panning to see the targets. Because we used targets that were visible at all scales, this benefit of large high-resolution displays did not materialize.
We aimed to isolate display size as a factor in the comparison of the visualization techniques. The two experiments produced different interaction effects between display size and interface that we could compare. For example, focus+context performed relatively worse at a large display size with variable-information-space, and relatively worse at a small display size with a fixed-information-space. Only through more detailed analysis of users’ interaction, however, did we find data to explain this difference. Moreover, the combined results from the two experiments not only show that overview+detail and zooming perform equally well across display sizes, but also suggest that overview+detail is less affected by scale ratios than zooming.
In the direct comparison of small, medium, and large displays our experimental comparisons and modelling give several insights. In particular, visual search time shaped performance in our study: Zooming and focus+context require longer time searching for targets in a large display for the multi-scale tasks studied here.
We do not say that large displays are not useful. Large displays, for instance, allow users to compare multiple targets without the need to navigate (like in the Compare tasks in this paper). Our results show how the benefits may be partly countered by increased costs of interaction in multi-scale navigation. However, as mentioned above,
a limitation of this study is that the tasks are not representative of all real-life tasks, but rather of tasks where targets are very large or have been highlighted by the user. The results do not help understand differences in navigation behavior (or performance) for tasks that require searching for detailed data or tasks that require search for and use of information at multiple levels of scale.
7.2 Differences Between Experimental Approaches A key contribution of this paper is to show that comparisons of visualizations for varying display sizes differ depending on whether the information space used varies or is kept fixed. This is important because empirical research typically concludes about the effects of display size based on data obtained by only one of either fixed- or variable-information-space experiments. Although the choice of approach is not pertinent to all research on display size, much research on visualization techniques, navigation support, pointing, and so on must decide on an approach. The implications of choosing one approach over another are so far under-explored.
The present work is a case in point. The fixed- and variable-information-space experiments gave rise to different conclusions: With a variable-information-space approach we would have concluded that focus+context is slightly better with larger displays; with a fixed-information-space approach we would have concluded it worse for small displays only. Overview+detail interfaces look better for large displays using a variable-information-space (when task times in Fig. 7 (b) are normalized by a factor of 3), whereas a fixed-information-space experiment would suggest them slightly worse.
Our aim is not to argue for one approach over the other, but to discuss the implications of choice. First, with variable-information-space it is necessary to normalize performance for the size of the information space so as to be able to compare display sizes directly. Yost et al. [30] compared task time per number of attributes shown in the display. Performance measures can be normalized by many other variables (e.g., scale, pointing difficulty). Our study suggests that choosing how to normalize is not trivial. We compared increases in task time relative to increases in target distances, but the modeling of performance with focus+context, for instance, showed that some factors vary little with display size. Second, with fixed-information-space, performance data can be directly compared. Confounding effects of information space and task are reduced, but scale ratio remains a possible confounding variable. To isolate scale ratio as a factor, a third approach is necessary in which display size is fixed. 8 CONCLUS ION
We have investigated the interrelation of display size, information space, and scale and its impact on information visualization research. In two experiments we compared classic interactive visualization techniques for multi-scale navigation in maps at different display sizes. A fixed-information-space was used in one experiment, variable-information-space in the other. Based on the results we have discussed the two experimental approaches and the clear impact they have on how visualizations compare for different display sizes.
Results from neither experiment show that the visualization techniques benefit from a large display. Task completion times decrease only when normalized to compensate for the increase in information space. However, the results are limited by the tasks in which all targets were visible irrespective of zoom level. The two experimental approaches show different interaction effects between display size and visualization technique, and we analyzed individual task actions in users’ interaction with the techniques so as to understand the relative impact of display size and scale ratio on the visualization techniques’ performance. However, much research base conclusions on only one experimental approach.
ACKNOWLEDGMENTS
This work has been supported in part by the Danish Council for Strategic Research grant 10-092316.
REF ERENCES
[1] C. Andrews, A. Endert, and C. North, “Space to think: large high-resolution displays for sensemaking,” in Proceedings of the SIGCHI Conference on Human Factors in Computing Systems, ACM, New York, NY, USA, pp. 55–64, 2010.
[2] C. Appert, O. Chapuis, and E. Pietriga, “High-precision magnification lenses,” in Proceedings of the SIGCHI Conference on Human Factors in Computing Systems, ACM, New York, NY, USA, pp. 273–282, 2010.
[3] R. Ball and C. North, “Effects of tiled high-resolution display on basic visualization and navigation tasks,” in Extended Abstracts on Human Factors in Computing Systems, ACM, New York, NY, USA, pp. 1196–1199, 2005.
[4] R. Ball and C. North, “The effects of peripheral vision and physical navigation on large scale visualization,” in Proceedings of Graphics Interface, Canadian Information Processing Society, Toronto, Ont., Canada, pp. 9–16, 2008.
[5] R. Ball, C. North, and D. A. Bowman, “Move to improve: promoting physical navigation to increase user performance with large displays,” in Proceedings of the SIGCHI Conference on Human Factors in Computing Systems, ACM, New York, NY, USA, pp. 191–200, 2007. [6] R. Ball, M. Varghese, B. Carstensen, E. D. Cox, C. Fierer, M.
Peterson, and C. North, “Evaluating the Benefits of Tiled Displays for Navigating Maps,” in IASTED International Conference on Human-Computer Interaction, ACTA Press, pp. 66–71, 2005.
[7] E. A. Bier, M. C. Stone, K. Pier, W. Buxton, and T. D. DeRose, “Toolglass and magic lenses: the see-through interface,” in SIGGRAPH ’93: Proceedings of the 20th annual conference on Computer graphics and interactive techniques, ACM Press, New York, NY, USA, pp. 73–80, 1993.
[8] S. Björk, L. E. Holmquist, J. Redström, I. Bretan, R. Danielsson, J. Karlgren, and K. Franzén, “WEST: a Web browser for small terminals,” in Proceedings of the 12th annual ACM symposium on User interface software and technology, ACM, New York, NY, USA, pp. 187–196, 1999.
[9] T. Buering, J. Gerken, and H. Reiterer, “User Interaction with Scatterplots on Small Screens - A Comparative Evaluation of Geometric-Semantic Zoom and Fisheye Distortion,” IEEE TVCG, vol. 12, no. 5, pp. 829–836, 2006.
[10] S. K. Card, J. D. Mackinlay, and B. Shneiderman, Readings In Information Visualization: Using Vision To Think. Academic Press, 1999.
[11] M. S. T. Carpendale and C. Montagnese, “A framework for unifying presentation space,” in Proceedings of the 14th annual ACM symposium on User interface software and technology, ACM, New York, NY, USA, pp. 61–70, 2001.
[12] A. Cockburn, A. Karlson, and B. B. Bederson, “A review of overview+detail, zooming, and focus+context interfaces,” ACM Comput. Surv., vol. 41, no. 1, pp. 1–31, 2008.
[13] M. Czerwinski, G. Smith, T. Regan, B. Meyers, G. Robertson, and G. Starkweather, “Toward characterizing the productivity benefits of very large displays,” in Proceedings of Interact: 9th IFIP TC.13 International Conference on Human-Computer Interaction, IOS Press, pp. 9–16, 2003.
[14] G. W. Furnas and B. B. Bederson, “Space-scale diagrams: understanding multiscale interfaces,” in Proceedings of the SIGCHI Conference on Human Factors in Computing Systems, ACM, New York, NY, USA, pp. 234–241, 1995.
[15] Y. Guiard and M. Beaudouin-Lafon, “Target acquisition in multiscale electronic worlds,” Int. J. Hum.-Comput. Stud., vol. 61, no. 6, pp. 875–905, 2004.
[16] F. Guimbretière, M. Stone, and T. Winograd, “Fluid interaction with high-resolution wall-size displays,” in Proceedings of The 14th Annual ACM Symposium on User Interface Software and Technology, ACM, New York, NY, USA, pp. 21–30, 2001.
[17] C. Gutwin, “Improving focus targeting in interactive fisheye views,” in Proceedings of the SIGCHI Conference on Human Factors in Computing Systems, ACM, New York, NY, USA, pp. 267–274, 2002. [18] C. Gutwin and C. Fedak, “Interacting with big interfaces on small
screens: a comparison of fisheye, zoom, and panning techniques,” in Proceedings of Graphics Interface, Canadian Human-Computer Communications Society, pp. 145–152, 2004.
[19] C. Gutwin and C. Fedak, “A comparison of fisheye lenses for interactive layout tasks,” in Proceedings of Graphics Interface,
Canadian Human-Computer Communications Society, pp. 213–220, 2004.
[20] C. Gutwin and A. Skopik, “Fisheyes are good for large steering tasks,” in Proceedings of the SIGCHI Conference on Human Factors in Computing Systems, ACM, New York, NY, USA, pp. 201–208, 2003.
[21] K. Hornbæk, B. B. Bederson, and C. Plaisant, “Navigation patterns and usability of zoomable user interfaces with and without an overview,” ACM Trans. Comput.-Hum. Interact., vol. 9, no. 4, pp. 362–389, 2002.
[22] M. R. Jakobsen and K. Hornbæk, “Sizing up visualizations: effects of display size in focus+context, overview+detail, and zooming interfaces,” in Proceedings of the SIGCHI Conference on Human Factors in Computing Systems, ACM, New York, NY, USA, pp. 1451–1460, 2011.
[23] E. Pietriga, “A Toolkit for Addressing HCI Issues in Visual Language Environments,” in Proceedings of IEEE Symposium on Visual Languages and Human-Centric Computing (VL/HCC), IEEE Computer Society, Los Alamitos, CA, USA, pp. 145–152, 2005. [24] E. Pietriga and C. Appert, “Sigma lenses: focus-context transitions
combining space, time and translucence,” in Proceedings of the SIGCHI Conference on Human Factors in Computing Systems, ACM, New York, NY, USA, pp. 1343–1352, 2008.
[25] J. Sauro and J. S. Dumas, “Comparison of three one-question, post-task usability questionnaires,” in Proceedings of the SIGCHI Conference on Human Factors in Computing Systems, ACM, New York, NY, USA, pp. 1599–1608, 2009.
[26] L. Shupp, C. Andrews, M. Dickey-Kurdziolek, B. Yost, and C. North, “Shaping the Display of the Future: The Effects of Display Size and Curvature on User Performance and Insights,” Human-Computer Interaction, vol. 24, no. 1, pp. 230–272, 2009.
[27] R. Spence, Information Visualization: Design for Interaction (2nd Edition). Upper Saddle River, NJ, USA: Prentice-Hall, Inc., 2007. [28] K. Swaminathan and S. Sato, “Interaction design for large displays,”
interactions, vol. 4, no. 1, pp. 15–24, 1997.
[29] D. S. Tan, D. Gergle, P. Scupelli, and R. Pausch, “With similar visual angles, larger displays improve spatial performance,” in Proceedings of the SIGCHI Conference on Human Factors in Computing Systems, ACM, New York, NY, USA, pp. 217–224, 2003.
[30] B. Yost, Y. Haciahmetoglu, and C. North, “Beyond visual acuity: the perceptual scalability of information visualizations for large displays,” in Proceedings of the SIGCHI conference on Human Factors in computing systems, ACM, New York, NY, USA, pp. 101– 110, 2007.
[31] B. Yost and C. North, “The Perceptual Scalability of Visualization,” IEEE TVCG, vol. 12, no. 5, pp. 837–844, Sep. 2006.
[32] F. R. . Zijlstra, “Efficiency in Work Behavior. A Design Approach for Modern Tools,” Delft University of Technology, 1993.