VisIt: An End-User Tool For Visualizing and Analyzing
Very Large Data
Hank Childs∗,§, Eric Brugger†, Brad Whitlock†, Jeremy Meredith‡, Sean Ahern‡, Kathleen Bonnell†, Mark Miller†, Gunther H. Weber∗, Cyrus Harrison†, David
Pugmire‡, Thomas Fogal¶, Christoph Garth§, Allen Sanderson¶, E. Wes Bethel∗, Marc Durant5, David Camp∗,§, Jean M. Favrek, Oliver R ¨ubel∗, Paul Navr´atil4, Matthew Wheelerα, Paul Selbyα, and Fabien Vivodtzev±
∗Lawrence Berkeley National Laboratory,†Lawrence Livermore National Laboratory,‡Oak Ridge
National Laboratory,§University of California at Davis,¶University of Utah,5Tech-X Corporation,
kSwiss National Supercomputing Center,4Texas Advanced Computing Center,αAtomic Weapons
Establishment,±French Atomic Energy Commission, CEA/CESTA
Abstract. VisIt is a popular open source tool for visualizing and analyzing data. It owes its success to
its foci of increasing data understanding, large data support, and providing a robust and usable product, as well as its underlying design that fits today’s supercomputing landscape. In this short paper, we describe the VisIt project and its accomplishments.
1. Introduction
A dozen years ago, when the VisIt project started, a new high performance computing environment was emerging. Ever increasing numbers of end users were running simulations and generating large data. This rapidly growing number of large data sets prevented visualization experts from being intimately involved in the visualization process; it was necessary to put tools in the end users’ hands. Almost all end users were sitting in front of high-end desktop machines with powerful graphics cards. But their simulations were being run on remote, parallel machines and generating data sets too large to be transferred back to these desktops. Worse, these data sets were too large to even process on their (serial) machines anyways. The types of visualization and analysis users wanted to perform varied greatly; users needed many techniques for understanding diverse types of data, with use cases ranging from confirming that a simulation was running smoothly to communicating the results of a simulation to a larger audience to gaining insight via data exploration.
VisIt was developed in response to these emerging needs. It was (and is) an open source project for visualizing and analyzing extremely large data sets. The project has evolved around three focal points: (1) enabling data understanding, (2) scalable support for extremely large data, and (3) providing a robust and usable product for end users.
In turn, these focal points have made VisIt very popular tool for visualizing and analyzing the data sets generated on the world’s largest supercomputers. VisIt received a 2005 R&D100 award for the tool’s capabilities in understanding large data sets, it has been downloaded hundreds of thousands of times, and it is used all over the world.
2. Focal Points
Enable data understanding: In many ways, “VisIt” is a misnomer, as the name implies the tool is strictly about visualization and making pretty pictures. The prospect of lost name recognition makes renaming the tool unpalatable, but it is worthwhile to emphasize that VisIt focuses on five primary use cases:
(i) Visual exploration: users apply a variety of visualization algorithms to “see” what is in their data. (ii) Debugging: users apply algorithms to find a “needle in a haystack,” for example hot spots in a scalar
field or cells that have become twisted over time. The user then asks for debugging information in a representation that is recognizable to their simulation (e.g. cellXin computation domainDhas a NaN).
(iii) Quantitative analysis: users apply quantitative capabilities ranging from simple operations, such as integrating densities over a region to find its mass, to highly sophisticated operations, such as adding a synthetic diagnostic to compare to experimental data.
(iv) Comparative analysis: users compare two related simulations, two time slices from a single simulation, simulation and experiment, etc. The taxonomy of comparative analysis has three major branches, each of which is available in VisIt: Image-level comparisons place things side-by-side and has the user detect differences visually. Data-level comparisons put multiple fields onto the same mesh, for example to create a new field for further analysis that contains the difference in temperature between two simulations. Topological-level comparisons detect features in the data sets and then allow those features to be compared.
(v) Communication: users communicate properties of their data to a large audience. This may be via movies, via images that are inserted into a PowerPoint presentation, or via line plots or histograms that are placed into a journal article.
Support for large data: Twelve years ago, “large data” meant several hundred million cells. Today, “large” means several hundred billion cells. In both cases, the definition of “large” was relative to the resources for processing the data. And this is the target for the VisIt project: data whose full resolution can not fit into primary memory of a desktop machine. Of course, the amount of data to load varies by situation. Can time slices be processed one at a time? How many variables are needed in a given analysis? Is it necessary to load multiple members of an ensemble simultaneously? For VisIt, the goal was to provide an infrastructure that could support any of these use cases, and it primarily uses parallelism to achieve this goal.
Provide a robust and usable product for end users: Enabling data understanding for large data is a daunting task requiring a substantial investment. To amortize this cost, the project needed to be delivered to many user communities, across both application areas and funding groups.
The “one big tool” strategy provides benefits to both users and developers. Compared to a smaller, tailored effort, users have access to more functionality as well as better underlying algorithms for processing data. For developers, the core infrastructure undergoes an economy of scale, where many developers can collectively develop a superior core infrastructure than they would be able to independently.
But the “one big tool” approach has negative aspects as well. Their user interface tend to provide an overly rich interface where users find many features to be meaningless and simply view them as clutter. And developers must deal with a less nimble code base where making functionality changes sometimes leads to unexpectedly large coding efforts.
Further, delivering a product to a large end user community incurs significant cost in and of itself: the VisIt project has almost a thousand pages of manuals, several thousand regression tests that run every night, a sophisticated build process, and a variety of courses designed to teach people to how to use the
tool. It requires multi-institution coordination for release management, for responses to user requests, and for software development. And, of course, the source code itself must be well documented to reduce barriers to entry for new developers.
The developers of the VisIt project decided to “go big”: to pay the costs associated with large user and developer bases in the hopes of writing a tool that would be usable by many and developed by many. 3. Design
GUI
GUI Visualization Window / ViewerVisualization Window / Viewer Local Workstation
Local Workstation Remote Computer Remote Computer
(or Local Workstation) (or Local Workstation) Database Server Database Server (mdserver)(mdserver) VisIt Component VisIt Component Launcher (VCL)Launcher (VCL) Command Line Command Line Interface (CLI) Interface (CLI) Data Parallel Compute Parallel Compute Engine Engine
Figure 1. Diagram of VisIt programs and their communication. In this section, we describe several
facets of VisIt’s design: §3.1 scribes VisIt’s architecture, §3.2 de-scribes its parallelism approach, and §3.3 describes its user interface con-cepts.
3.1. Architecture
VisIt employs a client/server design, where both client and server are composed of multiple programs (see Figure 1). Client-side programs, typically run on the user’s local desktop, are responsible for both user interface and rendering, since interactivity is paramount for these activities. The client-side programs are:
• gui:A graphical user interface built using the Qt widget set. • cli:A command line user interface built using the Python language. • viewer:A program responsible for visual display of data.
• Custom, streamlined user interfaces can also be added to VisIt. The interfaces can either complement the gui and cli or replace them altogether.
Server-side programs, typically run on a remote supercomputer that can access the user’s data in a parallel fashion, are responsible for processing data. The server-side programs are:
• engine: The program that applies visualization and analysis algorithms to large data using parallel processing.
• mdserver: A program that browses remote file systems and reads meta-data.
• vcl: VisItComponentLauncher, a program whose sole job is to launch other server-side programs. Without this program, the user would have to issue credentials for the launch of each program on the remote machine.
While the configuration in Figure 1 is the most common, other variants are also used:
• Data is located on the local machine, so all programs, including the server-side programs, run on the local machine.
• The client-side programs run on a remote machine. This mode occurs most often in conjunction with graphical desktop sharing, such as VNC.
• Multiple servers are run simultaneously to access data on multiple remote machines.
• VisIt is run entirely in “batch mode.” Theguiprogram is not used and theviewerprogram runs in a windowless mode.
• VisIt’s client-side programs are coupled with a simulation code and data is processedin situ. In this case, the simulation embeds a copy of theengineprogram.
3.2. Parallelism
VisIt supports multiple processing modes – multi-resolution processing, in situ processing, and out-of-core processing – but its most frequent mode is pure parallelism, where the data is partitioned over its MPI tasks and is processed at its native resolution. Most visualization and analysis algorithms are embarrassingly parallel, meaning that portions of the data set can be processed in any order and without coordination and communication. For this case, VisIt’s core infrastructure manages the partitioning of the data and all parallelism. For the non-embarrassingly parallel case, for example streamline calculation or volume rendering, algorithms are able to manage the parallelism themselves and can opt to perform collective communication if necessary.
In VisIt’s most typical visualization use case, a user loads a large data set, applies operations to reduce the data size, and then transfers the resulting data set to the local client for interactive rendering using the local graphics card. However, some data sets are so large that their reduced forms are too large for a desktop machine. This case requires a backup plan. VisIt’s backup plan is to switch to a parallel rendering mode: data is left on the parallel server, each MPI task renders its own piece, and the resulting sub-images are composited together. The final image is then brought back to the viewerand placed in the visualization window, as if it was rendered with the graphics card. Although this process sounds cumbersome, the switch to the parallel rendering mode is transparent to end users and frame rates approaching ten frames per second can be achieved.
3.3. User Interface Concepts
VisIt has five primary user interface concepts:
Type Description # of instances
Database How to read from a file ˜115
Operator How to manipulate data ˜60
Plot How to render data ˜20
Expression How to derive new quantities ˜190
Queries How to extract quantitative and debugging information ˜90
A strength of VisIt’s user interface concepts is their interoperability. Each plot can work on data directly from a file (databases) or from derived data (expressions), and can have an arbitrary number of data transformations or subselections applied (operators). Once the key information is extracted, quantitative or debugging information can be extracted (queries) or the data can be rendered (plots). Consider an example: a user reads from a file (database), calculates the λ-2 metric for finding high vorticity (expressions), isolates out the regions of highest vorticity (operators), renders it (plots), then calculates the number of connected components and statistics about them (queries).
VisIt makes it easy to add new types of databases, operators, and plots. The base infrastructure deals with these concepts as abstract types; it only discovers the concrete databases, operators, and plots instances at startup, by loading them as plugins. Thus, adding new functionality to VisIt translates to developing a new plugin. Further, VisIt facilitates the plugin development process. It provides an environment for defining a plugin and also performs code generation. The developer starts by setting up options for the plugins, and then VisIt generates attributes for storing the options, user interface components (Python, Qt, and Java), the plugin bindings, and C++ methods with “dummy” implementations. The developer then replaces the dummy implementations with their intended algorithm, file reading code, etc.
3.4. The size and breadth of VisIt
Although only briefly discussed in this paper, VisIt has an extensive list of features. Its ˜115 file format readers include support for many HDF5- and NetCDF-based formats, CGNS, and others, including
generic readers for some types of binary and ASCII files. Its ˜60 operators include transformations such as projections, scaling, rotation, and translation, coordinate transformations, data subsetting, such as thresholding and contouring, and spatial thresholding, such as limiting to a box or a plane, among many others. Its ˜90 queries allow users to get customizable reports about specific cells or points, integrate quantities, calculate surface areas and volumes, insert synthetic diagnostics/virtual detectors, and much more. Its ˜190 expressions go well beyond simple math. For example, the user can create derived quantities like “if the magnitude of the gradient of density is greater than this, then do this, else do that.” And many features do not fit into the five primary user interface concepts. There is support for positioning light sources, making movies (including MPEG encoding), eliminating data based on known categorizations (e.g. “show me only this refinement level” from an AMR mesh), and rendering effects like shadows and specular highlights, to name a few. In total, VisIt is approximately one and a half million lines of code. Further, VisIt is built on top of many third party libraries, including the Visualization ToolKit (VTK) [16], which contains many additional visualization algorithms.
4. Successes
The VisIt project has succeeded in multiple ways: by providing a scalable infrastructure for visualization and analysis, by populating that infrastructure with cutting-edge algorithms, by informing the limits of new hardware architectures, and, most importantly, by enabling successes for the tool’s end users. We summarize a few noteworthy highlights in the subsections below.
4.1. Scalability successes
In 2009, a pair of studies were run to demonstrate VisIt’s capabilities for scalability and large data (see Figure 2). In the first study, VisIt’s infrastructure and some of its key visualization algorithms were demonstrated to support weak scaling. This demonstration led to be VisIt being selected as a “Joule code,” a formal certification process by the US Office of Management and Budget to ensure that programs running on high end supercomputers are capable of using the machine efficiently. In the second study, VisIt was scaled up to tens of thousands of cores and used to visualize data sets with trillions of cells per time slice. This study found VisIt itself to perform quite well, although overall performance was limited by the supercomputer’s I/O bandwidth. Both studies are further described in [5].
Figure 2. The two left images show a contouring and a volume rendering from a Denovo radiation transport simulation. They were produced by VisIt using 12,270 cores of JaguarPF as part of the “Joule code” certification, which showed that VisIt is weakly scalable. The two right images show a contouring and a volume rendering of a two trillion cell data set produced by VisIt using 32,000 cores of JaguarPF as part of a study on scalability at high levels of concurrency and on large data sets. The volume rendering was reproduced in 2011 on a one trillion cell version of the data set using only 800 cores of the TACC Longhorn machine.
4.2. A repository for large data algorithms
Many advanced algorithms for visualizing and analyzing large data have been implemented inside of VisIt, making them directly available to end users. Notable algorithms include:
• A novel streamline algorithm that melds two different parallelization strategies (“over data” and “over seeds”) to retain their positive effects while minimizing their negative ones [12];
• A volume rendering algorithm that handles the compositing complexities inherent to unstructured meshes while still delivering scalable performance [3];
• An algorithm for identifying connected components in unstructured meshes in a distributed memory parallel setting on very large data sets [8];
• An algorithm for creating crack-free isosurfaces for adaptive mesh refinement data, a common mesh type for very large data [17].
• A well-performing material interface reconstruction algorithm for distributed memory parallel environments that balances concerns for both visualization and analysis [11]; and
• A method for repeated interpolations of velocity fields in unstructured meshes, to accelerate streamlines [7].
Further, VisIt has been the subject of much systems research, including papers on the base VisIt architecture [4], VisIt’s “contract” system which allows it to detect the processing requirements for the current operations and adaptively apply the best optimizations [2], and a description of the adapter layer that allows VisIt to couple with a simulation and runin situ[18].
4.3. Supercomputing research performed with VisIt
As the landscape for parallel computers changes, VisIt has been used to test the benefits of emerging algorithms and hardware features, including:
• Studying modifications to collective communication patterns for ghost data generation to be suitable for out-of-core processing, thereby improving cache coherency and reducing memory footprint [9]; • Studying the viability of hardware accelerated volume rendering on distributed memory parallel
visualization clusters powered by GPUs [6];
• Studying the benefits of hybrid parallelism for streamline algorithms [1]; and • Studying the issues and strategies for porting to new operating systems [13]. 4.4. User successes
Of course, the most important measure for the project is helping users better understand their data. Unfortunately, metrics of success in this space are difficult:
• Some national laboratories keep statistics on their user communities: the United States’ Lawrence Livermore Lab has approximately 300 regular users, the United Kingdom’s Atomic Weapons Establishment (AWE) has approximately 100 regular users, and France’s Atomic Energy Commission (CEA) at CESTA has approximately 50 regular users. Other institutions, like Oak Ridge and Lawrence Berkeley, view VisIt as their primary visualization and analysis tool, but don’t keep user statistics.
• In terms of monetary support for developing VisIt, the US Department of Energy funds VisIt development through its Office of Science, National Nuclear Security Agency, and Office of Nuclear Energy. Both of the US National Science Foundation (NSF) XD centers on visualization actively deploy and support VisIt as well.
• Another method for measuring usage is studying affiliations of users who ask questions on the mailing list. The majority of these inquiries come from none of the previously mentioned institutions, indicating that usage goes beyond these sites.
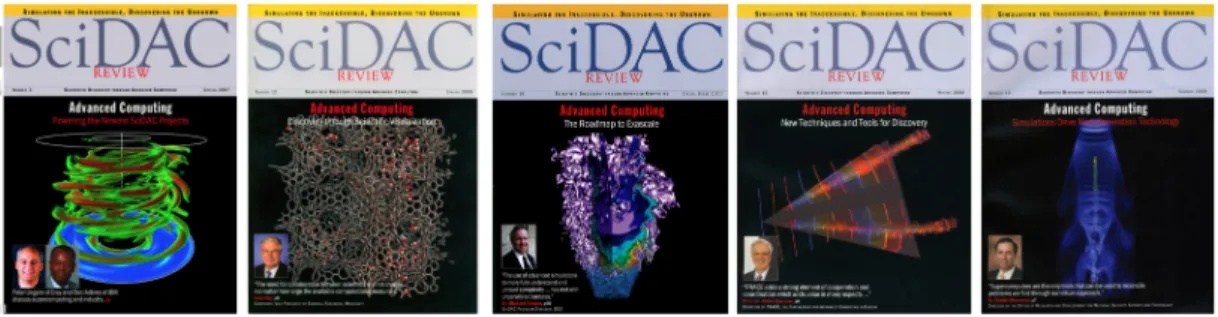
Figure 3. Recent covers of the SciDAC Review journal made using VisIt.
Tracking individual user successes is difficult. One high profile activity is images for the covers of journals and VisIt is used regularly for that purpose (see Figure 3). Further, there have been several notable instances of publications using VisIt to perform novel analysis:
• Analysis of laser wakefield simulations often amounts to finding key particles. In [14], query-driven visualization techniques are used to search through terabytes of data to locate these key particles in as little as two seconds.
• Simulations often deal with idealized meshes. In [10], VisIt’s comparative capabilities are used to quantify the importance of engineering defects when differencing as-built and as-designed models. • The toroidal magnetic fields found in tokamaks are analyzed by studying the fieldlines through a cross-section and the topological “islands” they trace out. In [15], the authors describe how they perform this analysis using VisIt’s streamline code.
5. Future Challenges
Although VisIt is well suited for today’s supercomputing environment, the project will face many challenges in the future. In the short term, I/O limitations will force visualization and analysis activities to de-emphasize I/O. The VisIt development team has invested in pertinent techniques, such as multi-resolution processing and in situ, but these techniques will need to be further hardened to support regular production use. In the longer term, power limits will constrain data movement, forcing much processing to occur in situ on novel architectures, such as GPU accelerators. Unfortunately, VisIt’s existing in situ implementation may be mismatched for this many-core future, for two reasons. First, although VisIt can be easily multi-threaded using a pthreads or OpenMP-type approach, this approach may not be able to take advantage of these architectures. The many-core future may require CUDA or OpenCL-type languages; migrating the VisIt code base to this setting would be a substantial undertaking. Second, although VisIt has been demonstrated to work well at high levels of concurrency, some of its algorithms involve large data exchanges. Although these algorithms perform well on current machines, they would violate the data movement constraints on future machines and would need to be re-designed.
6. Summary
The VisIt project’s three focal points – understanding data, large data, and delivering a product – together form a powerful environment for analyzing data from HPC simulations. It is used in varied ways: it enables visualization scientists, computational code developers, and the physicists that run these codes to perform a broad range of data understanding activities, including debugging, making movies, and exploring data. The user interface portion of its design provides a powerful paradigm for analyzing data while the data processing portion of its design is well suited for big data. This in turn has led to many successes: in scaling up to high levels of concurrency and large data sizes, in providing a “home” for large data algorithms, in understanding how to best use supercomputers, and, most importantly, in
helping users understand their data. Further, despite significant upcoming changes in supercomputing architecture, VisIt’s future appears bright, as it enjoys vibrant user and developer communities.
Acknowledgments
This work was supported by the Director, Office of Science, Office and Advanced Scientific Computing Research, of the U.S. Department of Energy under Contract No. DE-AC02-05CH11231 through the Scientific Discovery through Advanced Computing (SciDAC) program’s Visualization and Analytics Center for Enabling Technologies (VACET).
References
[1] David Camp, Christoph Garth, Hank Childs, Dave Pugmire, and Kenneth I. Joy. Streamline integration using MPI-hybrid parallelism on a large multi-core architecture. IEEE Transactions on Visualization and Computer Graphics, 2011 (to appear).
[2] Hank Childs, Eric S. Brugger, Kathleen S. Bonnell, Jeremy S Meredith, Mark Miller, Brad J Whitlock, and Nelson Max. A Contract-Based System for Large Data Visualization. InProceedings of IEEE Visualization, pages 190–198, 2005. [3] Hank Childs, Mark Duchaineau, and Kwan-Liu Ma. A scalable, hybrid scheme for volume rendering massive data sets.
InProceedings of Eurographics Symposium on Parallel Graphics and Visualization, pages 153–162, May 2006. [4] Hank Childs and Mark Miller. Beyond meat grinders: An analysis framework addressing the scale and complexity of
large data sets. InSpringSim High Performance Computing Symposium (HPC 2006), pages 181–186, 2006.
[5] Hank Childs, David Pugmire, Sean Ahern, Brad Whitlock, Mark Howison, Prabhat, Gunther Weber, and E. Wes Bethel. Extreme Scaling of Production Visualization Software on Diverse Architectures. IEEE Computer Graphics and Applications, 30(3):22–31, May/June 2010. LBNL-3403E.
[6] Thomas Fogal, Hank Childs, Siddharth Shankar, J. Kr¨uger, R. D. Bergeron, and P. Hatcher. Large Data Visualization on Distributed Memory Multi-GPU Clusters. InProceedings of High Performance Graphics 2010, pages 57–66, June 2010.
[7] Christoph Garth and Ken Joy. Fast, memory-efficient cell location in unstructured grids for visualization. IEEE Transactions on Computer Graphics and Visualization, 16(6):1541–1550, November 2010.
[8] Cyrus Harrison, Hank Childs, and Kelly P. Gaither. Data-parallel mesh connected components labeling and analysis. In
EGPGV, pages 131–140, 2011.
[9] Martin Isenburg, Peter Lindstrom, and H. Childs. Parallel and streaming generation of ghost data for structured grids.
IEEE Computer Graphics and Applications, 30(3):32–44, 2010.
[10] Edwin J. Kokko, Harry E. Martz, Diane J. Chinn, Hank R. Childs, Jessie A. Jackson, David H. Chambers, Daniel J. Schneberk, and Grace A. Clark. As-built modeling of objects for performance assessment. Journal of Computing and Information Science in Engineering, 6(4):405–417, 12 2006.
[11] Jeremy S. Meredith and Hank Childs. Visualization and analysis-oriented reconstruction of material interfaces. Comput. Graph. Forum, 29(3):1241–1250, 2010.
[12] D. Pugmire, H. Childs, C. Garth, S. Ahern, and G. Weber. Scalable Computation of Streamlines on Very Large Datasets. InProceedings of Supercomputing, 2009.
[13] David Pugmire, Hank Childs, and Sean Ahern. Parallel Analysis and Visualization on Cray Compute Node Linux. In
Cray Users Group Meeting, 2008.
[14] Oliver Ruebel, Prabhat, Kesheng Wu, Hank Childs, Jeremy Meredith, Cameron G. R. Geddes, Estelle Cormier-Michel, Sean Ahern, Gunther H. weber, Peter Messmer, Hans Hagen, Bernd Hamann, and E. Wes Bethel. High performance multivariate visual data exploration for extemely large data. InSuperComputing 2008 (SC08), 2008.
[15] A.R. Sanderson, G. Chen, X. Tricoche, D. Pugmire, S. Kruger, and J. Breslau. Analysis of recurrent patterns in toroidal magnetic fields. InProceedings Visualization / Information Visualization 2010, volume 16 ofIEEE Transactions on Visualization and Computer Graphics, 2010.
[16] William J. Schroeder, Kenneth M. Martin, and William E. Lorensen. The design and implementation of an object-oriented toolkit for 3d graphics and visualization. InVIS ’96: Proceedings of the 7th conference on Visualization ’96, pages 93–ff. IEEE Computer Society Press, 1996.
[17] Gunther H. Weber, Vincent E. Beckner, Hank Childs, Terry J. Ligocki, Mark Miller, Brian van Straalen, and E. Wes Bethel. Visualization tools for adaptive mesh refinement data. In Proceedings of the 4th High End Visualization Workshop, pages 12–25, Berlin, Germany, 2007. Lehmans Media. LBNL-62954.
[18] Brad Whitlock, Jean M. Favre, and Jeremy S. Meredith. Parallel in situ coupling of simulation with a fully featured visualization system. InEGPGV, pages 101–109, 2011.