International Economics Division
Economic Research Service
United States Department of Agriculture
Staff Report # AGES850208
1985
Agriculture, Trade, and Development: A
Comparative Look at U.S.,
Canadian, and European Community Policies
White, T. K. and C. Hanrahan, eds.
Proceedings of a Meeting of the
International Agricultural Trade Research Consortium
December, 1982, Washington, DC
GOVERNMENT POLICY IN SUPPORT OF DOMESTIC AGRICULTURE: COSTS AND BENEFITS
Canada
Richard R. Barichello
Introduction
Although Government support for agriculture has a long history in Canada, the extent and importance of this involvement has grown substantially in the last two decades. In particular, Government-sanctioned interventions in farm markets and Government-financed expenditures in the agricultural sector have become frequent in the seventies. From a position of little (if not negative) protection in the fifties, Canadian agriculture is now extensively affected by the public policy measures of economic regulation and subsidization.
Financial constraints faced by Governments in the current eighties decade are
forcing reconsideration of the large Government expenditure required by present farm programs ($1 billion in 1980, Lattimore, table A.1). But, in turning away from direct financial outlays, market intervention is continuing to be used as a major tool of agricultural policy. One can see evidence of this in recent Federal Government plans to introduce a red-meat marketing board and an agricultural trade Crown operation.
The issue remains large and has been the subject of some controversy. As early as 1969, the Federal Task Force on Agriculture challenged this trend toward increased Government interventions. In the mid-seventies, the Food Prices Review Board raised similar concerns, and recently the Economic Council
of Canada completed a major study of regulation in Canadian agriculture
(Forbes, Hughes, and Warley). This paper follows similar lines of inquiry by attempting to measure some of the economic effects of Canada's major farm programs. More narrowly, my purpose in this paper is to analyze Government
intervention, in some detail, for six agricultural commodities to provide estimates of their social efficiency (resource allocation) losses and income transfers among selected groups.
The choice of the six commodities reflects my assessment of agricultural
policy developments in the seventies. During this period, efforts to
stabilize farm prices and incomes continued from earlier years, and there was a substantial increase in net Federal Government expenditures to agriculture, which grew at an annual real rate of 3.2 percent from 1970 to 1978 (Forbes, Hughes and Warley, p. 12). But, the two developments which seem particularly noteworthy to me are the increasing cost of maintaining the statutory (Crow) rates for rail transportation of export grain and the increase in the number of marketing boards which possess the power to control supply and choose price. As a consequence, I have chosen to examine those commodities directly
affected by these developments: grains and oilseeds (specifically wheat, barley, and rapeseed), poultry meat (broilers), eggs, and milk. These
commodities, incidentally, account for almost 60 percent of all farms and total farm cash receipts in 1981.
This paper is organized to first discuss the bases for Canadian agricultural policy. Following a brief outline of domestic agricultural policy, in the next section, the paper turns to measurement of various economic effects for each of the six commodities, and ends with some conclusions.
Bases for Domestic Agricultural Policy
There would seem to be a long list of widely held perceptions in Canada which can be considered as the political, social, and economic bases for domestic
agricultural policy. At the more general level, Forbes, Hughes, and Warley include influential perceptions that farmers are a beleagured minority opposed
by the hostile forces of nature; by rapacious and inefficient suppliers,
processors, and handlers; and by the subsidized producers of other countries;
and that farmers are being rewarded for their efforts with meager and unstable
returns. And, who can doubt that the physiocratic-agricultural
fundamentalists' beliefs that farming is an activity that has a value that is
greater than its contribution to economic product at market prices, that
farmers are people with a disproportionate share of social virtues, and that
family sized farms should be maintained as the basic economic and social unit
in agriculture and in rural society are ideological notions that still hold
powerful popular and political sway.
Somewhat more specifically, there appears to be a distrust of unregulated farm
markets by many governments and farmers. There is a widely held perception
that farmers have insufficient bargaining power. Accompanying the latter view
are beliefs that increased market power by farmers would only neutralize the
existing market power of processing, distributing, retailing, and supplying
firms, and that farm monopolies will be less burdensome than nonfarm
monopolies. There is a growing farm-level demand from those sectors with
rapid changes in technology to control their own markets by raising farm
prices and controlling aggregate supplies. Importantly, this demand is met by
a willingness on the part of governments to act to buffer the effects of
technical change. Finally, for reasons given above and partly due to the
success of farm-interest groups, there appears to be a political desire to
redistribute income to farms.
Two economy-wide concerns affect agricultural policy. First, in line with an
overall objective of enhancing economic growth and development throughout the
economy, both Federal and Provincial Governments desire and promote the
development and growth in size of their respective agricultural sectors.
Clothed more extremely, this objective emerges in some jurisdictions as desire
for agricultural self-sufficiency. Second, consistent with a broader goal of
reasonable price stability, many agricultural policies arise from a desire to
stabilize farm-gate prices. In more aggregate terms, this concern with price
stability can be manifested as a concern about inflation, and from time to
ti e there are worries about whether food prices are contributing to inflation.
When interventions in agricultural markets have seemed appropriate to
governments, a variety of economic rationales have been used. These include
"destructive competition," structural imperfections, inadequate information,
externalities, income distribution, agricultural fundamentalism, and
self-sufficiency.
More recently, three factors appear to be of increased importance as part of the environment affecting agricultural policy. First, with the increased integration of agriculture with the rest of the economy, concerns with
inflation, balance of payments, fiscal restraint, and other Government program interactions have had a greater bearing on agricultural policy. Second,
issues of national unity and Federal-Provincial relations have had an impact. "...Divided jurisdictional responsibility for agriculture and food, and the tendency for strong provincial governments to make program initiatives at the
regional level and to seek a more influential role in national policy
development are...factors that have left their mark on national agriculture and food policy" (Forbes, Hughes, and Warley, p. 17). Finally, the political
environment has featured a generally unified and highly effective farm lobby
as well as competition between political parties trying to attract regional blocks of farm votes with locally appropriate commodity programs.
Current Policy Structure
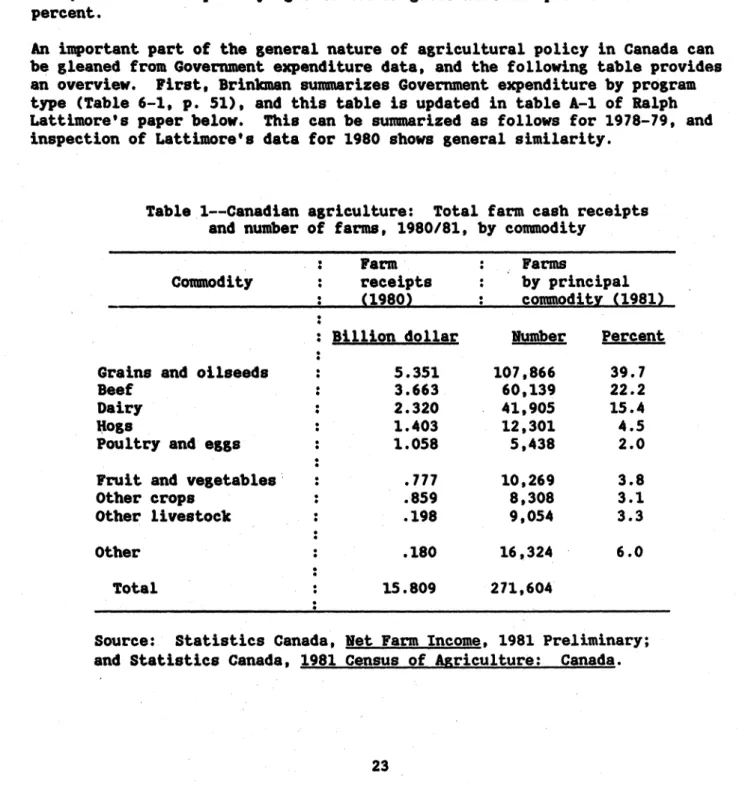
Before outlining key elements of current policy, a review of some quantitative dimensions of Canadian agriculture might be useful to appreciate the ensuing discussion and measurement. The size of the industry, in terms of cash receipts and number of farms, broken down by commodity groups, is shown in table 1. Cash receipts totaled almost $16 billion in 1980, and by the following year, there were 170,000 farms with sales of at least $2,500. In 1977, the share of primary agriculture in gross national product was 4.8 percent.
An important part of the general nature of agricultural policy in Canada can
be gleaned from Government expenditure data, and the following table provides an overview. First, Brinkman suMmarizes Government expenditure by program type (Table 6-1, p. 51), and this table is updated in table A-1 of Ralph Lattimore's paper below. This can be summarized as follows for 1978-79, and
inspection of Lattimore's data for 1980 shows general similarity.
Table 1--Canadian agriculture: Total farm cash receipts
and number of farms, 1980/81, by commodity
: Farm : Farms
Commodity : receipts : by principal : (1980) : commodity (1981)
:Billion dollar Number Percent
Grains and oilseeds : 5.351 107,866 39.7
Beef : 3.663 60,139 22.2
Dairy : 2.320 41,905 15.4
fogs : 1.403 12,301 4.5
Poultry and eggs : 1.058 5,438 2.0
Fruit and vegetables : .777 10,269 3.8
Other crops : .859 8,308 3.1
Other livestock : .198 9,054 3.3
Other : .180 16,324 6.0
Total : 15.809 271,604
Source: Statistics Canada, and Statistics Canada, 1981
Net Farm Income, 1981 Preliminary;
This listing neglects at least three important aspects of domestic
agricul-tural policy. The Provinces of Canada undertake a variety of agricultural
programs and they are neglected above. Because they are responsible for
virtually all extension work and field services to farmers, table 2 represents
only a fraction of the total extension expenditure in the country. Provinces also engage in direct payments to farmers, typically by way of commodity
"stabilization" programs and credit subsidies. Like most agricultural
stabilization programs in Canada, these provincial schemes are more often
concerned with income enhancement or transfers than price or income smoothing,
but they can be seen in Lattimore (table A.1) to account for little more than 10 percent, on average, of Federal expenditure in this area.
Second, the implicit subsidy contributed by the railways to export grain
producers by virtue of the statutory (Crow) rates is ignored. This item, too, is found in Lattimore (table A.1) and the sum is large (estimated to be $218
million Canadian in 1980). The importance of the Crow rates in total can be
seen in Harvey and Gibson, notably the substantial increase in the Crow
benefit (grain transportation revenues--costs) in recent (and forecast)
years. For 1980, this magnitude is calculated by Gilson to be $470 million.
Alternatively, the fixed transportation rate from Saskatchewan to export terminal for wheat is $5 per ton, while the calculated cost (at current
technology and rail line procedures) is $22 per ton.
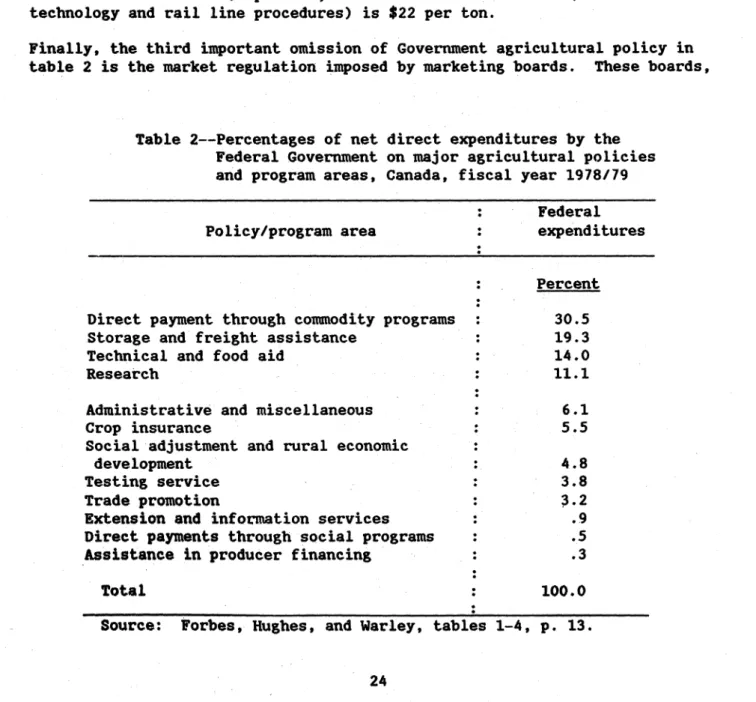
Finally, the third important omission of Government agricultural policy in
table 2 is the market regulation imposed by marketing boards. These boards,
Table 2--Percentages of net direct expenditures by the
Federal Government on major
agricultural policies
and program areas, Canada, fiscal year 1978/79
:
Federal
Policy/program area : expenditures: Percent
Direct payment through commodity programs
:
30.5
Storage and freight assistance : 19.3
Technical and food aid : 14.0
Research : 11.1
Administrative and miscellaneous : 6.1
Crop insurance : 5.5
Social
adjustment and rural economic
development : 4.8
Testing service
:
3.8
Trade promotion
:
3.2
Extension and information services
:
.9
Direct payments through social programs
:
.5
Assistance in producer financing : .3Total : 100.0
sanctioned by statute and typically compulsory, are horizontal cartels of farm producers. They are not unique to Canada but have emerged over the last 20 years as a major policy tool of considerable economic power, now covering over half of gross farm sales. The powers attributed to different boards vary tremendously from the benign to full monopoly privileges. The latter cases
are those with the power to control aggregate supplies, usually by means of producer marketing quotas and some form of import restriction.
These "supply-management" marketing boards (or equivalent arrangements) are presently found in the dairy industry (both fluid-and industrial-milk
sectors); the poultry industry, including broiler chicken, eggs, and turkey;
and tobacco.
Because these boards have the most profound economic effects, the major commodities involved (milk, broilers, and eggs) will be analyzed in this paper. This is not to say that turkey and tobacco boards do not have
relatively important effects or that the remaining marketing boards, without supply control powers, cannot influence producer returns, consumer prices, or resource allocation. It is simply beyond the scope of this paper to cover these other examples. I now turn to the individual commodity analyses to provide some quantification of the effects of policy generally alluded to so
far.
Measuring the Commodity Program Effects: Grain and Oilseeds Sector
Wheat. In describing the measurement of costs and transfers in each of the three grain and oilseed commodities (wheat, barley, and oilseeds), I will first describe the major policy issues, illustrate them in a supply/demand diagram, describe how the relevant values were arrived at, and finally calculate gains and losses.
In the production of wheat, world-market prices prevail, but there are a variety of Government programs or rules which subsidize production. The most important of these is the statutory (Crow's Nest Pass) rates for transporting export grain. Rail freight rates for moving grain from Prairie elevators to export terminals are still fixed at levels first established in 1897. Recent efforts by the Federal Government to come to grips with this issue have
generated the Gilson Report, upon whose estimates this paper shall rely. The effect of this transportation subsidy, certainly in the short run, is to increase the farm-gate price of grain relative to its level with freely determined freight rates.
In addition, the Western Grains Stabilization Act (WGSA) guarantees that the average (across the Prairies) gross margin (cash receipts less cash expenses)
in any one year will not fall beneath its previous 5-year average. The Federal Government pays two-thirds of the contributions to the stabilization
fund, plus administration costs. This Government contribution is effectively a subsidy to participating farmers, inereasing the net farm-gate price of grain.
Third, the Federal Government subsidizes the premium required for those
producers participating in the Crop Insurance Program which provides all-risk insurance of yield variation. Finally, the Federal Government subsidizes both the interest costs of making advance cash payments to producers (prior to
This list of five programs which affect the wheat market is not
comprehensive. Provincial programs are ignored for reasons of data. The
Temporary Wheat Reserve Program is ignored because no Federal funds have been incurred since 1973. Similarly, the Two-Price Wheat program is not included
because it ended in 1978, and because it was largely a consumer subsidy. Its total producer benefits, averaged over the period, have a smaller effect than
the Prairie Grain Cash Advance Program.
The wheat market in Canada, at the farm gate level, can then be analyzed as in figure 1. Canada is assumed to be a price taker on world markets, on the basis of Harvey's estimate that the (excess) demand curve for Canadian wheat
is -20 or larger (in absolute value) (Harvey, pp. 19-21). The supply elasticity was assumed to be 0.5 in the long run, a value which appeared reasonable in light of substitution possibilities with beef at the margin.
Few estimates of the supply elasticities of grains as a group (for example, to consider the effects of removing the subsidies on all grains simultaneously)
exist for Canada, and this value was also assumed by Josling for the long
run. Po is the received price, Pe is the price that would be received
without the subsidy distortion, Po - Pe, and Qo is the level of
production, given the subsidies. One additional complication is added by the
Canadian Wheat Board's delivery quota system. In many years these quotas limit the producers to market less than they would prefer. These quotas then take on an implicit value, and the supply curve cutting Po and Q
0
, S', isnot the true supply curve, S, Which would reflect only real opportunity costs.
S'
o S
The unregulated price and quantity are then given by point C. The familiar
triangle of welfare cost is ABC, assuming no other distortions. The existence
of other distortions generate welfare rectangles with a size given by the product of the distortion and the change in production due to the wheat
subsidy. Producers gain by the rectangle (Po - Pe) Qo less triangle
ABC. Consumers are unaffected by these policies, so their net gain is zero. Whoever finances the subsidies noted above, in this case the Federal
Government and the railways (delivering grain below cost), loses by the rectangle (Po Pe) Qo
Because of the recognized instability in the grain market, data were collected from the decade of the seventies. All prices were transformed into 1980
dollars and that was considered the key year for the analysis. The real
farm-gate price of wheat increased over the 1971-81 period, and the fitted
trend line was used to remove transitory movements. The estimated value for 1980, $178 per ton, was actually equal to the observed price. Because
production levels showed less variability, the mean value for the most recent
5 year period, 1977-81, was used (20.374 million ton). The Crow subsidy was
calculated from Gilson's recent report as the 1980 gap between rail transport costs and the legislated rate levels (a total subsidy of $470 million, or a per ton subsidy to wheat of $17.39. The WGSA subsidy, based on Federal contributions to the fund (not actual payments), was averaged over the
program's history, 1976 to 1981, an average payment of $91.8 million in 1980 dollars. This was prorated to each eligible grain arbitrarily, by their respective shares in production, and for wheat this came to $2.98 per ton. Similar procedures where adopted for Crop Insurance, Prairie Grain Cash
Advances, and Grain Export Credits. The 1976-80 Federal expenditure, in 1980 dollars, was averaged over the 5 years, allocated to eligible grains by their respective production share, and put in values per ton. For wheat, the unit subsidies were $$2.36 per ton for Crop Insurance, $0.25 per ton for Cash Advances, and $0.45 per ton for Grain Export Credit. The annual cost (value
of the delivery quota was calculated by Lattimore (table B.6), also averaged over the years 1976 to 1980, was $7 per ton.
In terms of figure 1, this translates as Qo
=
20.374 tons, Po
=
$178 per
ton, Pe = $154.57 per ton, point A = $171, and point C = $19.44 million
tons. With the total subsidy at $23.43 per ton, the transfers are readily
calculated. Producers gain by $470 million per year, consumers are unaffected
because we have ignored the old Two-Price Wheat Program, and taxpayers and
railways jointly suffer the loss of $477 million. On the basis of Lattimore's
estimates (table A.1) of the railway contribution to the Crow Gap, this $477
million cost breaks down to $306.9 million from the Federal Government and
$170.5 million from the railways.
The social efficiency gain (welfare loss) is not so quickly reckoned. To
begin with, the familiar triangle loss, ABC in figure 1, is relatively
trivial, $7.67 million. However, other resource allocation effects can be
considered. First, there is the problem of other significant distortions in
the economy affected by this policy-induced increase in wheat production. Due
to Canadian tariff policy, the social cost of foreign exchange does not equal
the private cost, and because wheat is traded, this generates an efficiency
effect. Jenkins and Kuo have estimated the (social) value of a (private)
dollar of foreign exchange is $1.07, generating a foreign-exchange benefit
from increased wheat exports of $10.1 million. Some of this will be offset by
imported inputs, and assuming a share of 25 percent for imported inputs in
total cost, the net foreign exchange benefit is $7.6 million. No other
distortion effects were calculated. On this basis, foreign exchange benefits
offset the triangle loss of $7.67 million, to leave virtually no efficiency effects.
However, I have ignored one reputedly important efficiency effect of Wheat Board policy, and that is the effect on resource allocation of the delivery quotas. It is widely acknowledged (Harvey, Furtan, Lee, and MacLaren) that the quota system has led among other effects to extensive land use, low adoption rates for high yielding varieties, and low levels of fertilizer and chemical use. These arguments imply that the quota system has caused the real
resource supply curve to shift to the left from where it would otherwise be.
The efficiency affect is potentially enormous, being
calculated as the area
.between these two supply curves. MacLaren, for example, has estimated that
Canada would produce 5 million tons more wheat in the absence of these quotas,
due to the change in resource use. Even if such
an effect has only pivoted
the supply from some point halfway along its length, MacLaren's estimate in
the context of figure 1 would
imply a
welfare cost of some $300 million.
Measurement of
this
effect is beyond this paper,
and I merely point it out to
show that, in all likelihood, the efficiency effect of the delivery quota
system swamps any other efficiency effects by several orders of magnitude, and
that any concerted effort to measure the efficiency effects of Canada's grain
policy requires examination of this issue.
Barley. The barley market was analyzed in an analogous manner to the
wheat-market
analysis outlined above. The only
additional consideration was
the feed grain policy in Canada, specifically the corn tariff of $0.08/bushel
($3.15/ton). All of the earlier caveats continue to apply, notably the
possibility of program omissions, efficiency effects of the CWB delivery
quotas, and the long-run accuracy of the Crow benefit/gap calculations.
The data are the following. The estimated trend price, 1980 dollars, is
$120/ton, and production is 11.058 million tons. The Crow subsidy is $17.41
per ton, the corn tariff $3.15 per ton, WGSA subsidy
of $1.15 per ton, Crop
Insurance
subsidy of $0.90 per ton, Cash Advance
subsidy of $0.10, and Grain
Export
Credit subsidy is $0.17 per ton. The total
subsidy is $22.88 per ton,
and the quota value, translated into barley production is $5.04 per ton.
In
terms of figure 1, Po=$120, Pe=$97.18, Qo=11.058 million tons, point A
=
$114.60, and point C
=10.26 million tons. The welfare loss triangle, ABC, is
$7 million, but an offsetting foreign exchange benefit of $3.7 million leaves
a net efficiency loss of $3.3 million.
Producers gain $246 million from these
policies, which are financed by Federal Government, taxpayers gain $160
million, and the railroads $93 million. The corn tariff imposes a cost on
feed grain users which is presently uncalculated.
Rapeseed. Once more, the procedures followed in the rapeseed market are the
same as for the two preceding grains, except that the Prairie Grain Cash
Advance Program does not apply to rapeseed.
Furthermore, because real
rapeseed prices have shown less of a pattern than wheat or barley prices, the
iean value of the 1971-81 period was used. This price is $309 per ton,
production is 2.632 million tons, the Crow subsidy is $17.06 per ton, WGSA is
$5.10 per ton, Crop Insurance is $4.03 per ton, Grain Export Credit is $0.76,
and the effective cost of grain delivery quotas in Board grains is $10.80 per
ton. In terms of figure 1, the efficiency loss triangle is only $0.54 million,
but with the foreign-exchange premium of $0.99 million, these calculations show a welfare gain from rapeseed policy of $0.45 million. Producers gain by
$70 million, and this is financed by the Federal Government, $49 million, and
railways, $22 million.
These results for the grains and oilseeds sector are summarized and compared
to recent results by Josling, Harling, and Thompson, using comparable
elasticity estimates to those of this paper.
The most notable results are the larger transfers to producers found in this paper. This is partly due to using 1980 dollars, but mostly due to the growth
in the more recent estimates of the Crow Benefit. Fully three-quarters of my
transfer estimates are due to the Crow Benefit. Finally, my efficiency losses
are comparable if only the familiar triangle loss is considered. The
foreign-exchange benefit reduces my net efficiency losses. Even so, I suspect these efficiency cost comparisons are virtually irrelevant compared to the important omission of the efficiency losses due to the delivery quotas.
Poultry Sector. The analysis of the poultry sector in Canada features fewer actual programs, but such market intervention, supply prices are not directly
observable, and economic analysis requires some subtlety. Marketing boards exist for both broilers and eggs, and these markets feature administered
prices (a pricing formula is usually involved); a variety of levies which
reduce the net farm-gate price; aggregate and individual farm quotas; import
quotas at relatively low levels; a variety of production rules regarding space requirements per bird; cycles of production per year, and bird weights in
broilers; size limits per farm; and restrictions on vertical integration. The analysis will begin with eggs, in more detail, and broilers will be summarized secondly.
Eggs. The Canadian market for eggs can be summarized in Figure 2.
P
E SS
C
This market operates by the board setting a price, Po, and a quota on
production Q. The net effect is to reduce output from Qe and raise price
above Pe, causing welfare costs and transfers, analogous to the familiar case of a monopolist. The producer gain will be PoAEPe less EBC, the
consumer loss will be PoABPe, and the economy gain will be their sum, a
loss of ABC. Additional twists are due to Canada's egg market regime.
Reported prices are for table eggs, yet any surpluses are sent to the breaker
market in Canada or the United States. A blend price between these two markets is the appropriate measure of Po. Levies are collected from farmers
to finance the administration of the regime (measured as DC). Not only does
this mean that one can mistakenly identify S' as the supply curve instead of
the true S, but it means an added resource allocation loss, DCOF, resources that would otherwise not be spent in the production and marketing of eggs. The various production restrictions such as farm size, limits, may have an
effect on production costs. The present supply may indeed be S, but without
production restrictions the supply curve could be lower, such as the curve S"
in figure 2. If this is so, the resource losses would be substantial,
measured as the area between S and S" from the origin to the demand curve. We
do not have enough information to properly identify this potential loss. As
will be seen later, this potential loss would appear to be small or
nonexistent. Finally, trade effects are not illustrated in figure 2. This is not because they are potentially unimportant. Rather, in both egg and broiler markets, when considering real resource costs, Canada appears to be
approximately competitive in supplying the domestic market. Given the approximations of our data, trade effects appear to be too small to be significant.
Turning to measurement, the demand curve is assumed to have an elasticity at
the farm gate of -0.225 (George and King). It represents something of a blend
between the table egg and breaker-egg market, and the quantity in 1980, 488 million dozen, and the net producer price, $0.755/dozen correspond. This
price is calculated as the average reported farm price ($0.79) less the
"consumer subsidy" levy of $0.025/dozen and an export levy of $0.01/dozen,
both in place to finance moving surplus table eggs to the breaker markets. It
is assumed that no surplus eggs are destroyed, at additional cost, an
assumption that has not always been accurate in the past. The supply curve is assumed to have unit elasticity, a compromise between the apparent ease of establishing additional chicken or egg "factories" and elasticities reported
in Askari and Cummings between 0.2 and 0.5.
The positioning of the supply curve is quite another matter. There are no
direct observations to use, given that at the margin of production we only
know from the scarcity of quotas and tendency to produce in excess of quota
limits that the net farm price exceeds the supply price. My attempts at
estimating this supply price follow three lines, inference from data on the market for quotas, feed-cost rules of thumb, and U.S. price comparisons.
Encouragingly, all measures are quite consistent, particularly for eggs.
The analysis of quota prices is quite complex, as befits a financial asset which is very much like a common stock. The problem is to determine the annual rental price, given the stock price. One must make assumptions about
capital gains, opportunity costs of funds, the risk premium needed to compensate for uncertainty about policy changes, and any expectations of
future allocations of new quota (gratis) to existing quota holders
(Barichello, 1982). All of this assumes good data on the stock price of
However, from a partially filled matrix on quota prices across provinces and from 1975 to 1981, I am able to begin. The average quota price for eggs across Canada in 1980, reported, for example, in Arcus, is $12.65 per layer.
An assumption of capital gains at the rate of 3 percent in real terms appears reasonable from the quota price data, and a private opportunity cost of
capital in agriculture appears to average 6 percent (Jenkins). I have no
direct observations on the risk premium that is felt necessary in this market but from discussions with poultry producers, it would seem at least as much as
in the dairy industry, with which I am more familiar and about which I have
some data. In milk, quota markets, the risk is seen to be sufficiently great
that purchasers of this asset will discount its future returns at a rate
equivalent to paying back principal plus interest in 4 years. Alternatively,
an interest rate of almost 29 percent (in real terms) is used to discount an
infinite stream of benefits.
Using this assumption for the poultry (egg and broiler) quotas, and assuming 20 dozen eggs per layer per year, the annual rent to egg quota is just over $0.14 per dozen ($14.35). This would be the distance AD in figure 2, and given 2 $0.005 dozen administrative levy (DC), the supply price of eggs in Canada, 1980, would be $0.58650/dozen.
A feed-price rule of thumb, gleaned from egg and broiler national cost of production formula, and from casual observation of industry experts, is that
feed prices account for 60 to 65 percent of costs. For average feed prices, this results in egg costs between $0.573 and $0.621/dozen. However, casually calculated, this range does bracket the supply price derived from quota prices
above.
Finally, an examination of U.S. prices can provide another point of comparison. As long as these prices are obtained without production
regulation, and as long as the technology can move freely across the border, the U.S. price in the northern States, closest to Canada and Canadian
conditions, should give a measure of potential costs in Canada. Taking both 1979 and 1980 data to smooth fluctuations, the average farm price in the northernmost States with significant (1 billion eggs sold) production is $0.509/dozen. At the 1980 exchange rate, this becomes $0.606/dozen in Canadian dollars.
All three measures are encouragingly similar, averaging some $0.591/dozen, and this will be taken as the Canadian supply price of eggs, point C in figure 2. Furthermore, these data suggest that U.S. costs are not significantly less than Canadian costs. Either the production restrictions imposed have a small effect on costs, or there are other cost advantages which offset the cost disadvantages of the restrictions.
To complete the data requirements of figure 2, we must know Pe and Qe and from the above, Pe= $0.615 per dozen and Qe=5 0 8 .5 million dozen. Only one additional efficiency cost is added, and that is extra cost embodied in the feed-grain tariff. Counting this as part of Canadian agricultural policy, its removal would shift the supply curve to the right, as it turns out by one cent
per dozen. Including this gives us our final estimates of Pe and Qe'
The resulting economic effects are calculated. Producers gain the area PoAEPe less EBC, calculated net of the administrative levy and the extra feed cost of the feed-grain tariff, or $55.20 million. Consumers lose PoABPe, or $74.229 million. The difference is the social efficiency loss or $18.979 million. These numbers ignore any other tariff impacts, they ignore other economy-wide distortions, and the foreign-exchange benefit is seen as being too small to calculate, given the accuracy of our numbers. They
also ignore to a large extent the social loss of resources used to preserve
rents, and they ignore any monopoly rents or inefficiencies created or
encouraged beyond the farm gate. They do account in some manner for most of the regulatory rules, and they do give some hint of the net export position Canada once had in eggs.
Broilers. The broiler market is analyzed in much the same way as that outlined above for eggs. One notable difference is in terms of Q in figure 2. In the broiler industry, production is limited to an amount less than that consumed, due to the allowance of a significant (some 6 percent of production) quantity of imported product. This means, in terms of figure 2, that the resource allocation loss of foregone production rents is somewhat larger than
BC, because the line EC is further to the left. Otherwise, the enumeration of efficiency losses and transfers follows exactly.
The demand elasticity is assumed to be -0.6 (George and King), the weighted average price to producers across Canada for 1980 is $0.423 per pound, and the quantity consumed is 913.164 million pounds (eviscerated meat basis, or
1,217.6 million pounds liveweight basis. The supply curve of chicken was assumed to have unit elasticity, as for eggs. Production of broiler chicken was 860.250 million pounds (1,147 million pounds liveweight), and a levy of $0.05 per pound was charged for the administration of the local (provincial) and national marketing boards.
The supply price calculations, using quota price data, began with an average quota price across Canada of $8.00 per bird space. Capital gains appeared to be somewhat less than for eggs, and a real rate of 2 percent real was
assumed. A risk premium was added to the opportunity cost of capital as for eggs, resulting in a discount rate of 28.86 percent. Given an average of 4.55 production cycles per year and an average bird size of 4.08 pounds liveweight, this quota price data implied an annual quota cost (rent) of $0.115 per pound liveweight. Given a price of $0.423 per pound and a levy of $0.05 per pound, these quota rent calculations imply the farm cost of production (supply price) is $0.303 per pound in 1980.
Using a comparable feed-cost rule of thumb as for eggs (feed costs are 60-65 percent of total costs) we calculate the cost of chicken to be within the range of $0.3096-$0.3354 per pound (an average of $0.322 per pound). U.S. price comparisons from the northern states show an average 1980 farm price of $0.2899 per pound, or in Canadian dollars, $0.345 per pound.
These numbers are more variable than for eggs, but are still reasonably well bounded. A mean value from the three estimates, $0.32 per pound, was used as the supply price for chicken (point C in fig. 2). Finally, the feed-grain tariff increases the cost of producing chicken by $0.005 per pound. The net result is an equilibrium price, Pe, of $0.362 per pound and an equilibrium quantity of 1,323 million pounds liveweight.
From these numbers, the consumer cost is calculated as $73.18 million, the producer gain as $56.64 million, the gain by importers (right of first receivership assuming a landed cost equal to Pe, $0.36 Canadian) is $4.07 million, and the total efficiency loss is $13 million.
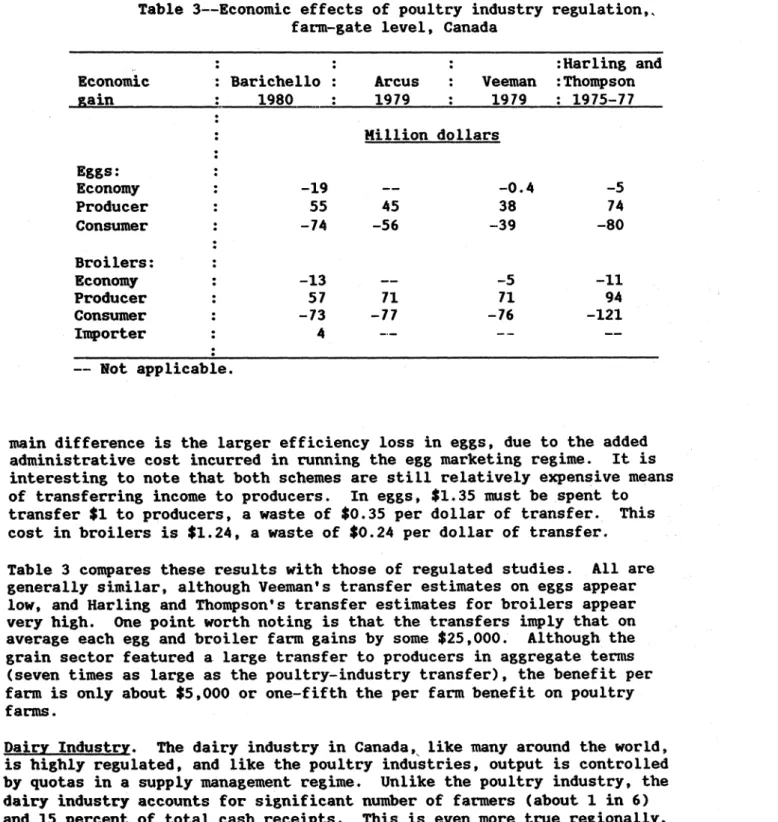
Despite their quite different administration, the supply management regimes in
eggs and broilers have very similar effects as can be noted in table 3. The
Table 3--Economic effects of poultry industry farm-gate level, Canada
regulation,,
:
: : :Harling and
Economic : Barichello : Arcus : Veeman :Thompson
gain : 1980 : 1979 : 1979 : 1975-77 : Million dollars Eggs: : Economy : -19 -- -0.4 -5 Producer : 55 45 38 74 Consumer : -74 -56 -39 -80 Broilers: Economy : -13 -- -5 -11 Producer : 57 71 71 94 Consumer : -73 -77 -76 -121 Importer : 4 -- -- ---- Not applicable.
main difference is the larger efficiency loss in eggs, due to the added administrative cost incurred in running the egg marketing regime. It is interesting to note that both schemes are still relatively expensive means of transferring income to producers. In eggs, $1.35 must be spent to transfer $1 to producers, a waste of $0.35 per dollar of transfer. This
cost in broilers is $1.24, a waste of $0.24 per dollar of transfer.
Table 3 compares these results with those of regulated studies. All are generally similar, although Veeman's transfer estimates on eggs appear low, and Harling and Thompson's transfer estimates for broilers appear
very high. One point worth noting is that the transfers imply that on
average each egg and broiler farm gains by some $25,000. Although the grain sector featured a large transfer to producers in aggregate terms
(seven times as large as the poultry-industry transfer), the benefit per
farm is only about $5,000 or one-fifth the per farm benefit on poultry
farms.
Dairy Industry. The dairy industry in Canada, like many around the world,
is highly regulated, and like the poultry industries, output is controlled
by quotas in a supply management regime. Unlike the poultry industry, the dairy industry accounts for significant number of farmers (about 1 in 6)
and 15 percent of total cash receipts. This is even more true regionally,
receipts, and Ontario where the figure is 20 percent. It also accounts
for a large fraction of Government agricultural commodity expenditures and, as shall be seen, the largest total benefits from agricultural policy of any commodity group. Because fluid- and industrial-milk production involve different Government programs (Provincial and Federal
jurisdictions, respectively) I will analyze them separately.
Fluid Milk. The rules in this sector are generally straightforward. Imports are prohibited, prices are administered, usually by formula, to maintain a price premium above industrial milk, quotas limit aggregate and
individual farm production, and each Province is self-sufficient (except Newfoundland). These provincial fluid-milk regimes are clear examples of
local monopolies with the advantage that excess production is channelled into industrial-milk markets, avoiding any surplus problems and keeping administrative costs low.
The diagram of figure 2, simplified to include only one supply curve, summarizes the fluid-milk market. The measures of gains and losses are the same as those outlined earlier. Because rules, prices, and quantities differ by Province, each one must be analyzed separately, involving too much detail to describe here. No trade effects are considered. The analysis here, notably for supply prices, continues the assumption of self-sufficiency in each Province. Therefore, the efficiency losses and transfers will definitely be understated. If the alternative was a
program of purchasing constituents on the world market and reconstituting them in Canada, the numbers would be larger still. There are relatively few direct production restrictions embodied in fluid regulation, aside from health standards. Consequently there would seem to be fewer cases of regulation-induced supply curve shifts than in the poultry industries, except for the common possibility of reduced adoption of some innovations and related long-run efficiency issues. Rent-preserving activities are again neglected.
Brief mention should be made of the estimation of supply prices. The sole
means of doing so was to draw inferences from quota price data. On the
basis of quota price and allocation data by Province, expected capital gains in the value of one's quota stock was estimated by Province. A common opportunity cost of capital (6 percent in real terms) was assumed, and on the basis of data from British Columbia and Ontario, the risk premium required for investing in this risky asset was calculated to be some 22 percent (approximately a 4-year payback). The demand elasticity was assumed to be -0.35 and a supply elasticity of 1.0 was used. The producer gain was calculated with reference to quota levels (inclusive of some industrial milk) and the consumer loss was calculated with reference
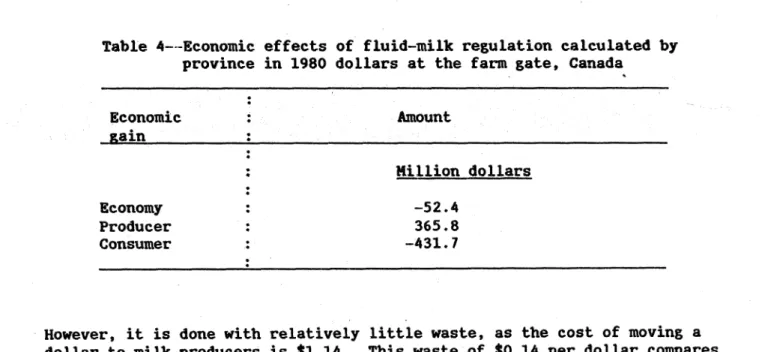
The results are shown in table 4. Partly due to the inelastic demand, the
transfer of income from consumers to producers is large.
Table 4---Economic effects of fluid-milk regulation calculated by
province in 1980 dollars at the farm gate, Canada
Economic : Amount gain : : Million dollars Economy : -52.4 Producer 365.8 Consumer : -431.7 However, it is dollar to milk with $0.24 and respectively. done with producers $0.35 per
relatively little waste, as the cost of moving a is $1.14. This waste of $0.14 per dollar compares dollar transferred in the broiler and egg industries,
Industrial Milk. Compared to fluid milk policy, regulation in Canada's
industrial-milk market is complex indeed. It too features formula pricing
with quotas to constrain output. Quotas are set at a level which preserves self-sufficiency for Canada in butterfat. The price of industrial milk is met
by a direct subsidy plus support prices for the two milk constituents,
butterfat and nonfat solids (skim). Given the quota level of production and
the support prices chosen, there is a domestic surplus of nonfat solids. This
must be exported to offshore markets, usually in the form of skim-milk powder
and evaporated milk, and at world-market prices, substantial losses are
incurred. These are largely financed with a series of levies on producers,
although a longer term solution in more extreme situations would be some
reduction in quotas. In addition, trade is strictly controlled. There is virtually an embargo on butter imports, and annual cheese imports are
restricted to 45 million pounds, less than 5 percent of total industrial milk
supply.
The analysis of this market is complicated by a lack of data.
direct information on the demand for industrial milk, only the industrial milk products, and the supply side is obscured like
There is no demand for the case in all
supply managed commodities. Figure 3 outlines the nature of the market. The demand for industrial milk, D, is measured as the vertical sum of the demand for its two joint products, butterfat and nonfat solids.
P
$/hl.
P w M.hl. Fig. 3We know one point on each of those two demand curves, the support price and
accompanying domestic disappearance. The demand curve for nonfat solids is
assumed to be -1.15 and for butterfat -1.40, implying a demand for industrial milk with elasticity -0.9. Arguments to support these assumptions are found
in Barichello, 1981.
The supply curve is positioned from quota price data as previously discussed, using quota price data from Ontario and Quebec. An implicit rental for this quota in Ontario provides an additional source of evidence to give increased confidence to supply price estimates. The supply elasticity is assumed again
to be unit elastic.
Finally, the world price is calculated to consider the costs of restricting this trade. However, if Canada entered that market on such a scale, with the
marginal supplier being New Zealand, it would surely have some effect on the
world price. Assuming an excess supply elasticity from New Zealand of a least 0.75, and iterating for different world prices until an equilibrium is
reached, we find that Canada would bid up the world price by 38.6 percent, given the elasticities assumed and the 1978-80 average world prices for butter
These procedures give the following values to the lettered points in figure 3:
A = $32.76 per hectoliter, 46 million hectoliters;
B = $24.96, 46; C = $23.75, 46; D = $19.22, 46; E = $21.61, 35; F = $31.43, 35; G = $17.63, 35.6; H = $17.63, 58.65; J = $22.75, 46.
The welfare costs have 4 components. First, the export of surplus skim-milk products at world prices denies the Canadian market of the consumer surplus in area FBDE, $85.6 million. Compared to the world price, Pw, excess
production resources are used, a loss illustrated by triangle JKG, $26.6
million. Again, compared to world prices, consumer surplus is lost, measured
by area BHK, or $46.4 million. Offsetting these costs is a benefit of
additional foreign-exchange earnings (savings), worth $28.4 million. The net social efficiency loss is $161.8 million. If one ignores the trade side, the net efficiency loss is still sizeable, $117.3 million.
The producer gain is measured as PoAJGPw, less the overlap with the fluid markets, or $628.7 million. The consumer loss is estimated directly from the butterfat and nonfat solids demand curves, measuring the surplus in moving
from 1980 support prices to world prices, a total loss of $548.1 million.
Finally, taxpayers also have an important interest in this policy, as they
suffer a loss of $303 million.
These results are combined with the fluid-market results in table 5, where
comparisons with Josling's results are made. The results are quite
comparable, even more so since the Economic Council Studies were completed,
due largely to evaluating the fluid-milk programs Province by Province as was
reported above in table 4. Two interesting calculations can be made from this
table. First, the cost of transferring a dollar to producers is some $1.22.
Table 5--Economic effects of fluid-milk regulation,
farm gate level, Canada
Economic : Barichello : Josling
gain
: 1980 $ : 1978/79 : lillion dollarsEconomy
:
-214
-275
Producer
:
995
905
Consumer : -980 -623 Taxpayer : -303 ---- Not applicable.This waste of $0.22 is the average of $0.26 in the industrial milk program and
$0.14 in fluid-milk policy. Despite the absolute size of these numbers, this transfer is still made with less waste than in the two poultry programs.
Furthermore, the per farm benefits are lower.
The dairy program producer benefits, although $1 billion annually, average about $20,000 per farm, 80 percent of comparable figures in the poultry
industry.
Conclusions
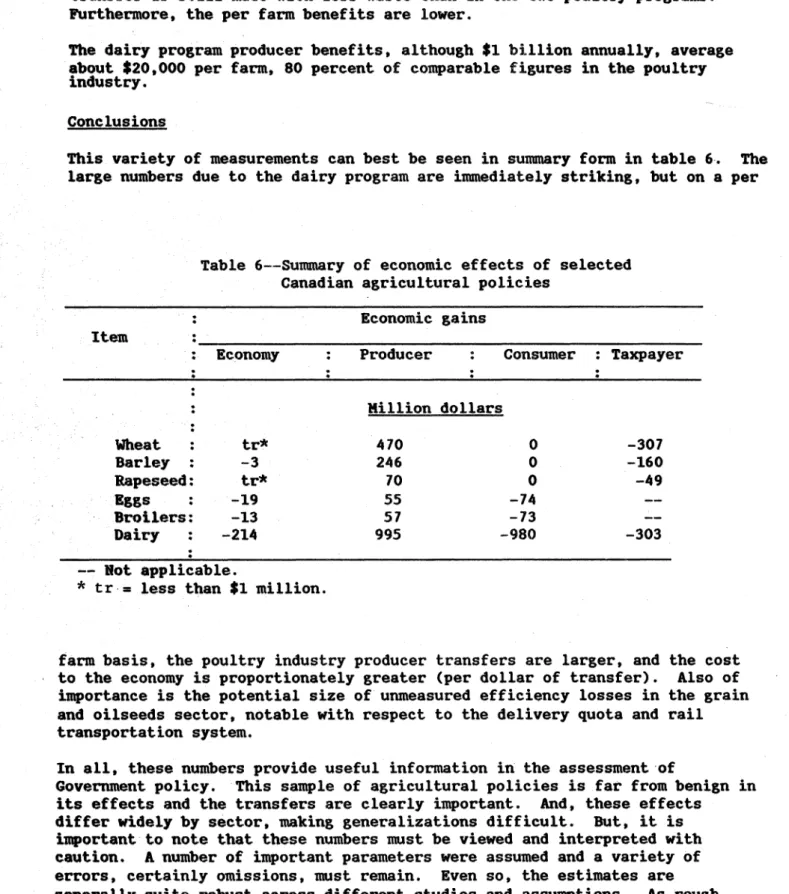
This variety of measurements can best be seen in summary form in table 6. The
large numbers due to the dairy program are immediately striking, but on a per
Table 6--Summary of economic effects of selected
Canadian agricultural policies
: Economic gains
Item
Economy : Producer : Consumer : Taxpayer
: Million dollars Wheat : tr* 470 0 -307 Barley : -3 246 0 -160 Rapeseed: tr* 70 0 -49 Eggs : -19 55 -74 --Broilers: -13 57 -73 --Dairy : -214 995 -980 -303 -- Not applicable.
* tr.= less than $1 million.
farm basis, the poultry industry producer transfers are larger, and the cost
to the economy is proportionately greater (per dollar of transfer). Also of
importance is the potential size of unmeasured efficiency losses in the grain
and oilseeds sector, notable with respect to the delivery quota and rail
transportation system.
In all, these numbers provide useful information in the assessment of
Government policy.
This sample of agricultural policies is far from benign in
its effects and the transfers are clearly important. And, these effects
differ widely by sector, making generalizations difficult.
But, it is
important to note that these numbers must be viewed and interpreted with
caution.
A number of important parameters were assumed and a variety of
errors, certainly omissions, must remain.
Even so, the estimates are
generally quite robust across different studies and assumptions.
As rough
guides to the effects of agricultural policy they are probably helpful, andthey certainly point the way to additional productive work.
References
1. Arcus, P. L. "Broilers and Eggs". Economic Council of Canada Regulation Reference and the Institute for Research on Public Policy, Technical Report E/I, 3, Ottawa, 1981.
2. Askari, H., and J. T. Cummings. Agricultural SupplyResponse: A Survey of Econometric Evidence. New York: Praeger Publishers, 1976.
3. Barichello, R. R. "The Economics of Canadian Dairy Industry Regulation." Economic Council of Canada Regulation Reference and the Institute for Research of Public Policy. Technical Report E/I, 2, Ottawa, 1981.
4. Barichello, R. R. "Analyzing a Marketing Quota", Dept. of Agricultural
Economics, University of British Columbia, Mimeo, 1982.
5. Brinkman, George L. Farm Incomes in Canada. Economic Council of Canada and the Institute for Research on Public Policy. Ottawa: Supply and Services Canada, 1981.
6.) Forbes, J. B., R. D. Hughes, and T. K. Warley. Economic Intervention and
Regulation in Canadian Agriculture. Economic Council of Canada and the Institute for Research of Public Policy. Ottawa: Supply and Services
Canada, 1982.
7. Furtan, W. H., and G. E. Lee. "Economic Development of the Saskatchewan Wheat Economy." Canadian Journal of Agricultural Economics, 25 (3), 1977.
8. Gilson, J. C. Western Grain Transportation. Ottawa: Supply and Services Canada, 1982.
9. Harling, K. F. and R. L. Thompson. "The Effects of Government
Intervention in Canadian Agriculture." Mimeo., Indiana Agricultural Experiment Station, West Lafayette, Indiana, 1981.
10. Harvey, D. R. "Government Intervention and Regulation in the Canadian Grains Industry." Economic Council of Canada Regulation Reference and The
Institute for Research on Public Policy. Technical Report E/I, 6, Ottawa, 1981.
11. Jenkins, G. P., and Kuo Chun-Yan. "On Measuring the Social Opportunity Cost of Foreign Exchange for Canada." Paper presented to the Canadian Economics Association Meetings, Ottawa, June 4, 1982.
12. Johnson, D. Gale. World Agriculture in Disarray. London: MacMillan, 1973.
13. Josling, T. "Intervention and Regulation in Canadian Agriculture: A
Comparison of Costs and Benefits Among Sectors:." Technical Report No. E/I, 4, Economic Council of Canada Regulation Reference and the Institute
for Research on Public Policy, Ottawa, 1981.
14. Lattimore, R. G. "Canadian Agricultural Trade Policy, Commercial Market
Relationships and its Effect on the Level and Stability of World Prices." Paper presented to Agricultural Trade Symposium, Washington, D.C.,
15.
MacLaren,
D. "Canadian Wheat Exports in the International Market: An Exploratory Econometric and Policy Analysis". Canadian Journal ofAgricultral Economics, 25 (Feb. 1977): 31-54
16 . Veeman, M4. 1. "Social Costs of. Supply-Restricting Marketing, Boards ."