Working-Land Conservation Structures: Evidence on Program and Non-Program Participants
By
Dayton Lambert, Glenn D. Schaible, Robert Johansson and Stan Daberkow
Economic Research Service, USDA
Subject Code: Resource & Environmental Policy Analysis
Contact: Glenn D. Schaible
Economic Research Service, USDA
Room S4048
1800 M Street, NW
Washington, DC 20036-5831 Phone: (202) 694-5549
Email: [email protected]
A selected paper submitted for the AAEA meetings in Long Beach, CA, July 23-26, 2006.
The views expressed in this manuscript do not necessarily represent those of the Economic Research Service or the United States Department of Agriculture.
Abstract
In recent years, the Federal government has placed more emphasis on working-land conservation programs. Farmers can be reimbursed for adopting certain conservation practices, such as the installation of in-field or perimeter conservation structures, to enhance water quality and soil productivity. In an effort to better understand the relationships between operator
motivations, program incentives, and the environmental benefits of conservation programs, a multi-agency survey, the Conservation Effects Assessment Project—Agricultural Resources Management Survey (CEAP-ARMS), was conducted in 2004 across 16 states representing more than one-million farmers growing wheat. The nationally representative survey integrates Natural Resources Inventory (NRI) data on field-level physical characteristics, program information, farm-level costs of production, and farm household information. This objective of this paper is twofold. First, using the CEAP-ARMS, farm structure, household, and operator characteristics of farmers participating in one or more conservation programs are compared with farmers not participating in a conservation program. Second, an impact model is specified to test whether program participants allocated more acres to in-field or perimeter conservation structures than nonparticipants, holding other factors constant. Evidence suggests that program participants allocate more field acres to vegetative conservation structures than nonparticipants with in-field or perimeter conservation structures.
Key words: working-land, conservation, impact model, in-field/perimeter structures, integrated survey
Introduction
The Federal government has recently emphasized conservation programs that reward
environmentally-friendly practices on working farmland. For example, USDA’s Environmental Quality Incentives Program (EQIP) is designed to help farmers institute conservation practices and integrate conservation structures into their farming operations. Initial funding for EQIP (1997 to 2001) was roughly $200 million annually. With the Farm Security and Rural Investment Act (FSRI) of 2002 funding for EQIP increased substantially ─ $5.8 billion over 6 years (2002-2007), with annual funding levels increasing from $400 million in 2002 to $1.3 billion in 2007. In addition, FSRI also created the Conservation Security Program (CSP), which provides incentive payments to assist farmers in implementing and maintaining land-management practices on working lands, such as nutrient and manure management, integrated pest management, crop rotations, irrigation water management, and tillage/residue management.
There are 151 practices recognized by the Natural Resources Conservation Service (NRCS) as reimbursable conservation activities. Many of these practices target soil erosion and water quality. A subset of these includes the installation of vegetative conservation structures compatible with working farmland: terraces, grassed waterways, riparian or herbaceous buffers, hedgerows, filter strips, and windbreaks (Aillery). These structures are usually compatible with crop operations associated with grain production, and have relatively large environmental payoffs, such as enhancing soil productivity or improving water quality (Smith).
Given the panoply of reimbursable practices available to producers, increasing Federal budgetary constraints, and a growing need to demonstrate the environmental benefits of
conservation programs, USDA initiated a pilot national survey in 2004, the Conservation Effects Assessment Project ─ Agricultural Resource Management Survey (CEAP-ARMS) to extend and
enhance USDA’s ability to assess the economic and environmental benefits of it’s conservation programs. CEAP-ARMS was designed to address such critical policy questions as: what factors are associated with the decision to participate in working-land conservation programs? And, given successful enrollment into a working-land conservation program, what factors are associated with different levels of participation? Are financial incentives alone enough to increase participation effort, or are there other factors ─ such as personal goals or farm business reasons ─ important factors in the producer’s decision to adopt conservation practices or
participate in conservation programs?
Using the 2004 CEAP-ARMS survey, which focused on wheat farmers, the objective of this paper is to address some of these questions by evaluating differences in
producer/farm/environmental characteristics across the quantity of acres allocated to
conservation vegetative structures by program and non-program participants. Identifying the relative importance of factors affecting producer conservation practice decisions may provide a better understanding of how farmers are likely to respond to alternative program designs and market incentives.
The null hypothesis is that the average acres of conservation structures supplied by growers participating in a conservation program are not different from non-participants. Rejection of this hypothesis might imply that program incentives increase conservation effort using this metric. However, factors other than receiving incentive payments alone may be important with respect to the decision to participate in a conservation program, and subsequent levels of participation.
We use a treatment effects, or “impact” model (Fernandez-Cornejo, Koltz-Ingram, and Jans) to correlate, holding other factors constant, farm structure, household characteristics and
environmental factors on the amount of acres supplied by producers towards in-field
conservation structures. This two-step procedure uses a probit regression in the first stage to estimate predicted values for the conservation program participation decision, and whether respondents consulted with an extension agent in the installation of a conservation structure. The second stage uses a tobit regression to estimate an acreage supply equation, censoring all other farms in the survey that did not have any acres allocated to in-field or perimeter conservation structures.
Factors hypothesized to influence the participation-acreage supply decision
Economists typically assume that the decision to adopt a specific farming practice is based on profit maximizing behavior given resource constraints. But the decision to practice good stewardship is not driven by profit alone. Roughly sixty-three percent of farm operators in the U.S. are classified as “residential” or “lifestyle” farmers, or are retired (USDA-ERS), suggesting that the decision to pursue farming is based on quality-of-life factors as well as the farm’s ability to generate profits. Concerns over succession (Wilson; Battershill and Gilg), the desire to limit the time and energy spent farming (Lobley and Potter; Loftus and Kraft), and the need for income stability (Loftus and Kraft) can also affect decisions about farming practices and conservation program participation. Studies of farmer adoption of conservation practices and participation in conservation programs in the European Union and the U.S. have found that quality-of-life factors and personal attributes of farm operators also influence the decision. Caswell et al. found that farmer education and the operator’s willingness to pursue offsite expert advice had a positive influence on the decision to adopt “management-intensive” conservation technologies in the U.S. Loftus and Kraft found that farmers who more frequently consulted
extension agents were more likely to enroll land into conservation programs. Length of residency in a given location has also been found to be positively related with participation in the
Environmentally Sensitive Areas Scheme in the European Union (Wilson, 1997).
When adoption of a conservation practice implies a decreased revenue or increased input cost and management skills to maintain production levels, what would motivate such a change? The level of adoption costs may be one reason. Operators participating in conservation programs may find the out-of-pocket expenses of conservation practices much reduced through cost-sharing. But farm operators can also value land stewardship and the environment apart from any profit motive. Environmentalist sentiments may not be the exclusive province of any particular type of farm, but adoption of conservation practices may be more likely in environmentally sensitive areas and when the cost is relatively low.
We develop a behavioral model to test the broad range of hypotheses related to why an operator might adopt a conservation practice. We assume that operators are rational agents who choose from a discrete set of management alternatives to maximize expected benefits from crop and/or livestock production over a time horizon. The operator must weigh the costs of foregoing potential returns from cropland in return for a guaranteed payment over a contractual period, and/or compensation for installation of in-field or perimeter conservation structures. The operator may (1) choose to participate in the conservation program and install conservation structures as evidenced by a contractual agreement covering a portion of the installation costs or other annual payments, (2) not participate in a conservation program but choose to install in-field or perimeter vegetative structures on a field, or (3) none of these. In the first two cases, producers may opt to seek technical assistance regarding the installation and/or management of a
Characteristics hypothesized to influence the adoption of conservation practices include those that pertain to the farm, the farmer, the farm household, and the environment. Farm
business and structure characteristics influencing adoption may include scope and diversification of production, tenancy, participation in commodity programs, and farm size. Important operator characteristics are likely age, education, and farming experience. Important household attributes include household size and off-farm income sources. Other relevant variables include site-specific physical factors, farm location, and regional attributes.
Participants are defined as respondents who indicated they had a written conservation plan for the field (or conservation tract), and who also identified either conservation financial assistance programs in the plan for the field or that conservation compliance applies to the field [i.e., the field is registered as meeting the requirements for “Highly Erodible Land Conservation Compliance (HELCC)”].1,2
Farm structure variables
Total cropland acres operated was used to measure the influence of farm size on the decision to install working-land conservation structures (Kay and Edwards; Lynch, Hardie, and Parker). Cropland acres operated are hypothesized to be positively correlated with the acres supplied to
1 In addition to HELCC, conservation financial assistance programs included in the definition for “participants”
involved the following programs: Conservation Security Program (CSP), Environmental Quality Incentives Program (EQIP), Klamath Basin Water Conservation Program, Ground and Surface Water Conservation Program, Wetlands Reserve Program (WRP), Wildlife Habitat Incentives Program (WHIP), Conservation Reserve Program (CRP), Farm and Ranchland Protection Program, and State Cost-Share Programs.
2 Phase II data was used to define conservation program participants versus non-participants to: (1) ensure
maximum use of CEAP-ARMS Phase II data (use of 732 integrated Ph. II/NRI observations versus only 472 integrated Ph. II/NRI/Ph. III observations) when evaluating alternative conservation practice issues; and (2) the Phase III conservation program participation information applies to the whole farm, however, it does not
conservation structures because larger farms are likely to control more eligible land, or land located on fragile soils, and enjoy a wider array of land use options.
The proportion of land owned to total farm acres operated was used to measure the effect of tenure on the allocation of cropland to conservation structures. In contrast to retiring larger portions of cropland into land retirement (such as the Conservation Reserve Program), tenure may not play as important a role in the decision to allocate smaller parcels of cropland to conservation structures. Enrollment of noncontiguous, difficult-to-manage parts of fields which can be modified by installing corrective or preventative conservation measures should not have a large effect on production.
The revenue from corn, soybean, and wheat production as a proportion of total
production revenue (including livestock receipts) measures the effect of farm diversification on the participation decision, or acres allocated to vegetative structures (Lohr and Park; Soule, Tegene, and Wiebe). It is hypothesized that the share of total revenue from crops will be positively related with the acres allocated to in-field or perimeter conservation structures, holding other factors constant, because installation of these structures is usually consistent with production objectives of crop farms.
Non-conservation government payments may influence the decision to participate in conservation programs, and the willingness to install vegetative structures on cropland (Chang and Boisvert; Lynch, Hardie, and Parker). Receipt of commodity payments may also be correlated with the decision to participate in farm programs that promote good stewardship practices. To test this hypothesis, non-conservation government payments, which include Agricultural Marketing Transition Act payments, disaster payments, counter-cyclical payments, and loan deficiency payments, are included in the regression analysis. Because government
payments are highly correlated with farm size, the sum of government payments is normalized by the total cropland acres operated.
Farm household characteristics, operator attributes, and human capital variables
The off-farm share of total household income was included to measure the effect of off-farm income sources on the allocation of cropland to vegetative conservation structures. The expected sign is ambiguous for at least two reasons. First, for farms focused on agricultural receipts for income, it would be reasonable to anticipate that off-farm income would be negatively associated with the decision to install a vegetative structure, assuming that the provisions associated with this program appeal more to persons engaged in production agriculture. On the other hand, there may be reason to expect that this variable is positively correlated with installation of vegetative structures. In some cases, operators very focused on agricultural production may find it
necessary to work off-farm to continue farming, or both operator and spouse may seek off-farm employment opportunities to meet financial needs.
Total expenditures are included to measure the effects of household wealth on the allocation of cropland to conservation structures. Holding other factors constant, it is expected that household expenditures will be positively associated with acres supplied to in-field and perimeter structures, assuming that wealth is correlated with farm size, the security wealth provides when adopting new practices that require new skills or practices, education, and enjoyment of the environmental amenities or scenic attributes provided by some conservation structures.
Appreciation for wildlife, scenic views, and open spaces may also be a motivating factor why an operator may choose to integrate one or more conservation structures into their
operation. Respondents were asked whether they installed in-field or perimeter conservation structures to improve wildlife habitat. The expected sign of this variable is positive.
Operator age was used to measure the effect of human capital and operator experience on the acreage allocation decision of in-field or perimeter conservation structures. It is hypothesized that more experienced farmers are more likely to integrate working-land conservation practices into their crop production operations.
Educational attainment—measured as whether the operator had attended at least some college—was used to measure the relationship between human capital and decisions to install conservation structures (Lynch, Hardie, and Parker). Previous studies found that education is positively associated with participation in come conservation programs (Soule, Tegene, and Wiebe). It is expected that educational attainment will have a positive effect on the acres allocated to in-field or perimeter conservation structures.
Household structure may be an indicator of the life stage of a farm household or operation, or a measure of the human resources available to the farm operation. The expected sign of this variable is ambiguous.
Environmental characteristics
Holding other factors constant, operations with fields that are located on fragile soils, susceptible to gully or wind erosion, or near streams or other water sources may be more likely to have preventative or corrective conservation structures in place to maintain or improve soil quality. On the other hand, operations that continue to farm fragile or highly erodible soils would be those most likely to be targeted by conservation policy. Field-specific soil fragility is measured using the 2003 Universal Soil Loss Equation (tons/acre/year) collected by the NRI. The presence
of a gully and the proximity of the field to a stream or other water sources are measured using dummy variables. A proxy for field soil productivity is included using the 2003 per acre revenue from the previous crop grown.
Regional variables
The effects of farm location are measured using a set of dummy variables associated with the Economic Research Service’s production regions. Regions include the Northern Plains, Southern Plains, Midwest, and Pacific regions. The Pacific region is the reference group. The regional variables control for differences in land prices, access to farm services, and differences in climate and growing seasons (Khanna). Effects of proximity to metropolitan areas and potential access to off-farm employment opportunities are measured using a variable indicating whether the farm was located in a metropolitan county.
Policy variables
Technical assistance–whether the operator consulted an extension agent in the design,
installation, or management of a conservation structure(s)–may be an important component of technology transfer and adoption in particular and human capital development in general. Operators more frequently interacting with private consultants, university extension agents, or government agencies may better understand the importance of installing vegetative structures designed to produce large environmental benefits on relatively smaller parcels of land (e.g. tree spacing for riparian buffers, optimal gradients for grass filter strips, or appropriate species for hedgerows or windbreaks). Because of the bias introduced by self selectivity, the predicted values of this variable are used in the acreage supply equation.
It is hypothesized that program participants will, holding other factors constant, allocate more acres to in-field and perimeter vegetative structures compared to operators not participating in a conservation program. Because participation is voluntary, the predicted values of this
variable are used in the acreage supply equation, as well.
Additional instruments
Additional instruments used in the first-stage probit regression include whether the farmer managed the field using conservation tillage, crop rotation, and whether structures had been installed to facilitate drainage. County-level instruments included indicator variables identifying farms located in counties that had experienced a decline in population between 1990 and 2000, whether the county was classified as being economically dependent on the service or
manufacturing sector, and if the county was classified as a housing distressed county.
Empirical model and methodology
We use a treatment effects model to evaluate the impact of incentive payments and extension on the decision to install in-field or perimeter conservation structures, and the number of acres allocated to those structures. In doing so, we account for two sources of endogeneity. The first source is the simultaneity associated with the decision to participate in a conservation program that supports installation of vegetative, or other conservation structures; namely, the decision to adopt the practice, and the extent to which (or magnitude of) the adoption (i.e. acres allocated to the structure). The other source of endogeneity arises from self-selectivity.
The procedure we use to attend to these issues follows Fernandez-Cornejo, Koltz-Ingram, and Jans. In the first stage, the decision to participate in the conservation program or to seek
technical assistance is modeled using probit regressions. In the second stage, the acres supplied by all farms (program and non-program participants) are estimated using a tobit regression. Farms that had not installed any vegetative structures were the censored group:
(1) Participation: P*i = γ′zi + vi, Pi = 1 if P*i > 0, and Pi = 0 if P*i < 0,
(2) Extension: E*i = η′zi + ui, Ei = 1 if E*i > 0, and Ei = 0 if E*i < 0,
(3) Acres supplied: y*i = β′xi + δP*i + θE*i + ei; yi = 0 if yi < 0, and yi = y*i if yi > 0,
(4) Cov(u, v, e) = σ ρ ρ 0 0 0 1 0 1 .
It is expected that program participation will be highly correlated with technical assistance. But there are cases when producers who install conservation structures may seek outside, expert advice about installation and management of in-field or perimeter conservation structures, but choose not to participate in a conservation program. In the first case, the disturbance terms the first stage participation and extension equations would be correlated as in equation 4. It is also assumed that the covariance between the extension and participation equations and the acreage supply equations is zero (Cameron and Trivedi, 2005). Therefore, if the decisions are not independent, then the predicted values for the participation and extension decisions would be estimated using the bivariate cumulative density function: P*i = Φ2(z′iγ, -z′iη, -ρ) and E*i = Φ2
(-z′iγ, z′iη, -ρ) (Tunali; Fishe, Trost, and Lurie).
Because of the complex survey design of the CEAP-ARMS, variances of estimated parameters are calculated based on standards established by the National Agricultural Statistical Service, using the delete-a-group jackknife variance estimator (Kott; Dubman). Details and implementation of this procedure are outlined in El-Osta, Mishra, and Ahearn. The
delete-a-Data
The analysis used data from a pilot study implemented in 2004, coordinated by USDA’s
National Agricultural Statistical Service (NASS), the Economic Research Service (ERS), and the Natural Resource Conservation Service (NRCS). CEAP-ARMS integrates two producer-based surveys: (1) a National Resources Inventory (NRI) point-based production
practice/-environmental data survey (CEAP), and (2) a field/farm level production practice, resource use, farm household and economic survey (ARMS). CEAP-ARMS directly links this field, farm, and environmental data. By linking the NRI to field and farm level data, CEAP-ARMS allows analyses to isolate program incentive impacts from impacts due to other farm programs and to non-conservation program factors, such as, farm household and financial constraints, technology changes, market conditions, farm size, and weather conditions. The 2004 CEAP-ARMS field production practice data, known as ARMS phase II, included a sample of 882 NRI point-based farm fields for wheat across 16 States. Integrating this data with NRI and ARMS farm-economic data, known as ARMS phase III, provided a sample of 472 field/farm observations.
Results
The first section highlights the farm structure, household, and operator characteristics of participants and nonparticipants. The second part of this section presents the results of the regression an analysis. The system of equations was estimated twice. The first set of estimates is based on a combined portion of CEAP-ARMS that links field-level production data to household data (i.e. phase II and phase III, merged). Typically, there is about a 40% attrition rate for ARMS respondents between phase II and III. That is, for a variety of reasons, a phase II respondent
cannot or may not want to participate in the phase III part of the survey, which covers whole-farm costs and returns, and household and operator characteristics. After eliminating responses, the integrated sample size was 461 (expanded, 186, 729 farms, adjusting for non-response of some variables). In the second regression analysis, the phase II CEAP-ARMS data was used (N = 686 respondents, adjusting for non-response of some variables; expanded, 1,010,908 farms).
Descriptive comparison of participants and non-participants
We identified significant characteristic differences between conservation program participants and non-participants, and also across farm-size classes. The definition of farm-size class makes use of the associated Phase III ARMS follow-on data. However, because of the relatively small Phase III sample size, we aggregated the ERS typology into three farm-size classes: (1) retired/residential/lifestyle farms; (2) farming-occupation farms with total sales < $100,000; and (3) farming-occupation farms with total sales ≥ $100,000.3 The 2004 CEAP-ARMS (for wheat) indicated that only about 17 percent of the field/farms surveyed were associated with conservation program participants, i.e., that most wheat producers (83 percent) did not enroll wheat acreage in USDA conservation programs (Figure 1). However, among the program participants, a slightly larger share were from retired/residential/lifestyle and low-sales farms. The average conservation program participation rate ranged from 15.3 percent for higher-sales farms to 19.1 percent for retired/residential/lifestyle wheat farms. These relatively low
participation rates clearly indicate the importance of understanding more about the characteristic differences between program participants and non-participants.
While nearly 80 percent of wheat acres for 2004 were associated with farms that did not participate in conservation programs, wheat farms that did participate in such programs differed in a number of significant ways from non-participant farms. In addition, differences in
characteristic values are generally statistically-significant across farm-size classes (Table 1). While higher-sales farms among program participants on average operated about 3,335 acres, similar type farms among non-participants operated approximately 2,155 acres. The opposite is true for both small farm-size classes; that is, acres operated were less for participants than for non-participants. However, participant wheat farms generally owned a larger share of the farm’s operated acres (a higher tenure rate; owned acres/operated acres), with
retired/residential/lifestyle and low-sales farms among participants with the highest tenure rates (ranging from 85 to 93 percent).
From a farm financial perspective, non-participant wheat farms were generally less dependent on farm revenue from wheat production across all farm types, than were participants. Even so, these non-participant farms produced higher 2004 farm production value, both
indicators of greater farm diversification. Non-participants also generally had larger farm equity (net farm worth) than participants. However, both the retired/residential/lifestyle and the
farming-occupation low-sales farms among non-participants had higher net farm incomes than did participant farms, while participating higher-sales farms exceeded the net farm income of similar non-participating farm types by nearly 52 percent.
For conservation program participants and non-participants, farm operators for higher-sales farms were generally found to be younger than operators for other farm types. Operator
age ranged from 50 – 53 years for higher-sales farms, to 54 – 57 years for
retired/residential/lifestyle farms, and from 55 – 60 years for farming-occupation, lower-sales farms. However, the distributional effect shifted slightly for college education and off-farm work. While for non-participants the percent of 2004 wheat farm operators with some college education was highest for higher-sales farms (at 27 percent), it was highest among program participants (at 72 percent) for retired/residential/lifestyle farm operators. On the other hand, retired/residential/lifestyle farms had the highest percent of primary operators who earned off-farm income, ranging from 67 to 85 percent, for non-participants and participants, respectively. Farming-occupation, higher-sales farms among participant farms were the least associated with the primary operator working off-farm.
Higher-sales, 2004 wheat farms participating in commodity programs, for both
participants and non-participants, received the largest total government payments (ranging from $32,276 to $42,171 per farm). However, these payments were heavily influenced by the average size of their direct government (AMTA) payments. Even so, for 2004, larger farms participating in conservation programs received higher government conservation payments ($16,623 per farm) than did other program participating farms (ranging from $6,576 for retired/residential/lifestyle farms to $5,829 for farming-occupation, low-sales farms).
From an agri-environmental perspective, larger non-participating farms produced the highest 2004 wheat yields (54 bu./acre), but they also applied the highest amount of nitrogen (77.3 lbs./acre). We found that these farms accounted for the largest number of wheat acres planted (47.2 percent) in 2004. In addition, the average USLE soil loss for these acres was 2.5 tons/acre/year, while soil loss for wheat acres for similar participating farms was at 4.3
in conservation programs, but these farms accounted for only 4.3 percent of 2004 wheat acres planted.
The percent of farms with gully erosion occurring in wheat fields was evenly distributed across most 2004 wheat farm types (ranging from 6.5 to 9.5 percent), except for non-participant lower-sales farms, where gully erosion was present for 16.5 percent of these farms.
Additionally, where the 2004 wheat field was adjacent to a water body, intermittent stream, or wetlands, most of these fields were associated with non-participant farms. This critical
environmental linkage was associated with approximately 45 percent of low-sales and 34 percent of higher-sales non-participant farms (which accounted for 58 percent of all wheat farms). However, this distributional effect again shifted for the percent of wheat field acres where Highly Erodible Lands (HEL acres) were present. The presence of HEL acres associated with 2004 wheat fields was more dominant among participating farms, specifically accounting for 33 and 68 percent of wheat acres from participating retired/residential/lifestyle and farming-occupation higher-sales farms, respectively. On the other hand, the percent of wheat acres with wetlands in or around the field was highest for lower-sales farms, ranging from 13 to 18 percent for non-participants and non-participants, respectively. For other farm types, the percent of 2004 wheat acres with wetlands in the field were either relatively small or there was insufficient survey
information to make an estimate.
Conservation Practices Applied to U.S. Wheat Production
For economic, conservation, and environmental reasons, producers had adopted a variety of land-management and structural conservation practices on wheat producing acres: crop rotation, conservation tillage, scouting for pests, applying nutrient tests, use of variable rate
technology (VRT) for seed and/or fertilizer application, use of GPS-based soil map information, installation of one or more conservation structural practices, and intensive use of alternative pest management practices. 4 In 2004, farming-occupation higher-sales wheat farms not participating in conservation programs were by far the dominant users of all eight land-management practices (fig. 2). These farms accounted for 47 percent of wheat acres (within the 16 CEAP-ARMS surveyed States) and for 46 – 52 percent of wheat acres that applied crop rotations, were scouted for pests, used nutrient tests, applied 1 or more structural practices in the field, or intensively applied pest-management practices. These farms also accounted for 60 – 70 percent of wheat acres that used conservation tillage, variable rate technology for seed and/or fertilizer
application, and use of a Global Positioning System (GPS) to geo-reference (map) the soil properties of the wheat field. Our analysis of the 2004 CEAP-ARMS data for wheat suggests that while conservation program participants likely make a significant positive contribution to reducing agricultural-induced environmental damages, the largest contribution to environmental benefits likely originate from higher-sales farms not participating in conservation programs.
Wheat producers have installed a variety of structural practices in wheat fields designed to reduce wind and water-based soil erosion, protect surface-water sources, and enhance
agricultural bio-diversity, including creating/enhancing natural habitat pathways across the
4 “Pest-management intensity” is defined as when a producer applies five or more pest-management practices to a
selected field .Alternative pest-management practices for a selected field may include such direct activities as scouting for pests (at various levels of intensity), keeping detailed written or electronic records, making use of published threshold information, using field mapping data, use of diagnostic laboratory analysis for pest
identification, use of soil/plant tissue testing, use of beneficial organisms in the field, use of a trap crop, as well as other indirect activities designed to manage or reduce the spread of pests such as plowing down of crop residue, rotating crops, use of ground cover or mulches, use of no-till or minimum till, adjusting row spacing, plant density, or row direction, cleaning field equipment after completing a field operation, removal of crop residue
agricultural landscape (fig. 3).5 However, in 2004, acres devoted to terraces were the dominant structural practice installed across wheat acreage, accounting for 82 and 67 percent of structural practice acres for conservation program non-participants and participants, respectively. Again, program non-participants play a dominate role in the use of these practices, as evidenced by the fact that these farms account for 76 percent of wheat acres.
Regression results
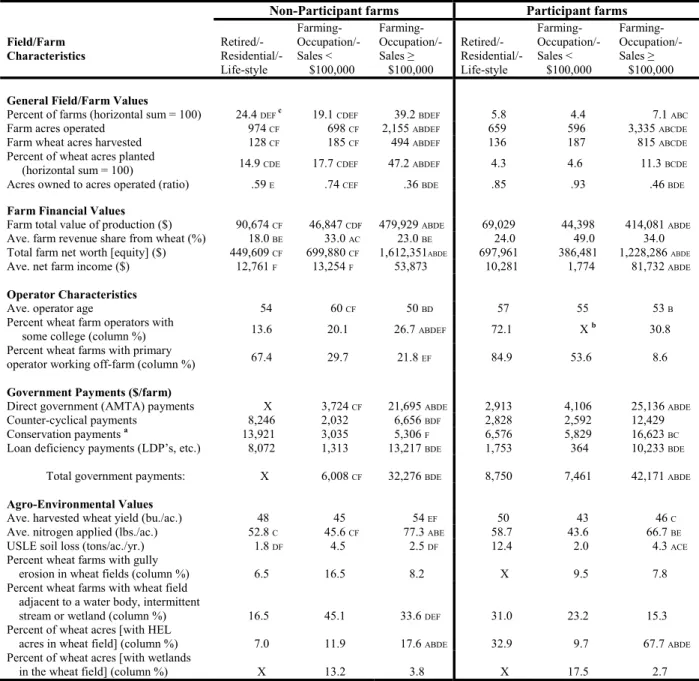
The first stage, bivariate probit results of the impact model using the merged phase II/III integrated data indicate that the decision to participate and to seek technical assistance were highly correlated at the 1% level (ρ = 0.90) (table 2). For the program participation equation, tenure (owned/operated land ratio) and the previous year’s revenue from crop production on the field were positively and negatively correlated with the participation choice, respectively, at the 10% level. The coefficient associated with the Northern Plains production region was significant at the 5% level. No other variables significantly correlated with the participation choice. The equation relating technical assistance to farm structure and household characteristics performed less well. The only variable that was significant in this equation was the coefficient associated with the Northern plains growing region.6
The first stage probit estimates estimated using the full phase II CEAP-ARMS produced relatively more significant results in term of explaining participation and use of technical assistance (table 3). Program participation and the decision to seek technical assistance were highly correlated (ρ = 0.84). Sentiments for wildlife were positively associated with the program
5 Structural practices may include field acres devoted to terraces, infield vegetative buffers, stream-side forest
buffers, windbreaks, field borders, grassed waterways, hedgerow plantings, stream-side herbaceous buffers, infield contour buffers, filter strips, critical area plantings, and grade stabilization structures.
participation decision, but the location of the field next to a stream or water source was
negatively associated with participation. Sentiments for wildlife were also positively associated with the decision to seek technical assistance. Larger farms were found to be more likely to seek some sort of technical assistance, holding other factors constant.
The variables indicating whether a respondent participated in a conservation program or had sought technical assistance were replaced by their predicted values in the acreage supply equation (table 4). Based on the integrated phase II and phase III data, farms more focused on corn, soybean, and wheat production allocated about 2 more acres to in-field or perimeter conservation structures than other operations, all lese equal. Sentiments for wildlife were also positively associated with the acres supplied to riparian buffers, contour strips, grass waterways, wind breaks, etc. On average, operators who had attended at least some college supplied about 3 more acres to conservation structures, but larger households appear to supply less. Use of technical assistance and program participation did not appear to be related with the acreage supply decision using the integrated data.
However, based on the complete phase II data alone, farmers participating in a conservation program tended to supply more acres to in-field or perimeter conservation
structures, holding other factors constant. Operators who were considered participants had about 0.5 more acres of in-field conservation structures compared to nonparticipants at the 10% confidence level. Operators farming fields with fragile soils were also more likely to allocate about 0.35 more acres to in-field or perimeter conservation structures. Proximity of the field to a stream or other water source was also positively associated with conservation structure acres.
Conclusions
The paradigm of modern farmland conservation policy shifted with debut of EQIP and the introduction of the continuous signup provision of the Conservation Reserve Program in 1996. For nearly a decade, farmers that continue to rely on revenue from agricultural production have had a wide array of alternatives from which to choose regarding adoption of environmental-friendly conservation practices in particular and participation in conservation programs in
general. Today, EQIP, some components of the CRP, and the CSP continue to reimburse farmers for adopting ‘working-land’ conservation practices. In many instances, farmers volunteering to participate in one or more of these programs are motivated to maintain soil productivity, protect water sources, or enhance rare and endangered habitats, and remain competitive in agricultural markets.
To better understand the impacts these programs might have on farmer well-being and the environment, the USDA launched a pilot survey, the CEAP-ARMS, in 2004. This integrated survey was designed to give researchers and policy analysts a more composite picture of the interplay between conservation programs, other commodity programs, farm household
wellbeing, and environmental outcomes. We used the CEAP-ARMS to profile the characteristics of farms participating and not participating in these programs. We also developed an impact model to estimate, holding other factors constant, the effects of program participation on a subset of conservation decisions — namely the installation of in-field or perimeter conservation
structures — and the factors associated with the participation decision.
Conservation practices differ by farm type and participation. For example, sixty-four percent of wheat acres under conservation tillage are operated by high-sales farms not
for only twenty-two percent of conservation tillage acres for wheat. Further, one-third of non-participating farms did use conservation tillage, whereas about half of the program participant farms did use conservation tillage. Lack of equipment was the dominant reason for not adopting conservation tillage for both program participants and non-participants. And, consistent with other research, it appears that larger operations appear to adopt some conservation practices for the simple reason that it is good business to do so.
Contrary to some other studies, it appears that household and operator characteristics are not a primary motivating factor behind the decision to participate in conservation programs (as defined in this analysis). However, higher educational attainment and smaller household size appear to be associated with higher participation levels. Omitting some key household and farm structural variables (because they are not available in the phase II survey), it does appear that program participation is positively associated with levels of conservation practices. While we cannot establish causality in our models, we did find some evidence that farmers participating in a conservation program tend to have more acres allocated to in-field or perimeter conservation structures than farms not participating in these programs. Some key questions remain for future studies. For example, what is the ‘reservation price’ for producers not participating in
conservation programs, but who still operate fragile or environmentally sensitive land? How can the ‘marginal participant’ be identified, and what would they be willing to accept in terms of cost-sharing adoption of conservation practices or technologies? The CEAP-ARMS may have the detail to sort through these difficult questions Answers to these questions are important for conservation program design, delivery, and implementation.
References
Dubman, R., Variance Estimation With USDA's Farm Costs and Returns Surveys and Agricultural Resource Management Survey. Staff Report AGES 00-01, Economic Research Service, U.S. Dept. of Agriculture, April 2000.
Battershill, R.J., Gilg, A. W. 1997. Socio-economic Constraints and Environmentally Friendly Farming in the Southwest of England. Journal of Rural Studies 13(2): 213-228.
Cameron, A.C, and P. K. Trivedi, Microeconometrics: Methods and Applications, Cambridge University Press, New York, (2005).
Caswell, M., Fuglie, K., Ingram, C., Jans, S., Kascak, C. 2001. Adoption of Agricultural Production Practices: Lessons Learned from the U.S. Department of Agriculture Area Studies Project. AER-792, Economic Research Service, USDA, 116 pp.
(www.ers.usda.gov/Publications/aer792/)
Chang, H.H., and R. Boisvert. “Explaining Participation in the Conservation Reserve Program and its Effects on Farm Productivity and Efficiency,” Selected Paper, American
Agricultural Economics Association, Providence, RI, 2005. (http://agecon.lib.umn.edu/cgi-bin, accessed April 3, 2006)
El-Osta, H., A. Mishra, and M. Ahearn, “Labor Supply by Farm Operators under ‘Decoupled’ Farm Program Payments,” Review of Economics of the Household, 2(4) (2004): 367-85. Fishe, R.P.H., R.P. Trost, and P.M. Lurie, “Labor Force Earnings and College Choice of Young
Women: An Examination of Selectivity Bias and Comparative Advantage,” Economics of Education Review 1(2) (1981): 169-191.
Kay, R.D., and W.M Edwards. Farm Management, Boston, McGraw-Hill, (1999). Khanna, M., “Sequential Adoption of Site-Specific Technologies and Its Implications for
Nitrogen Productivity: A Double Selectivity Model,” American Journal of Agricultural Economics 83(1) (2001): 35-51.
Kott, Phil S., Using the Delete-a-Group Jackknife Variance Estimator in NASS Surveys. U.S. Dept. Agr., National Agricultural Statistics Service (1997).
Lambert, D., P. Sullivan, R. Claassen, and L. Foreman, Conservation-Compatible Programs and Practices: Who Participates? ERR-14, Economic Research Service, U.S. Department of Agriculture, (2006).
Lobley, M., Potter, C. 1998. Environmental Stewardship in UK Agriculture: A Comparison of the Environmentally Sensitive Area Programme and the Countryside Stewardship Scheme in South East England. Geoforum 29(4): 413-432.
Loftus, T., Kraft, S. E. 2003. Enrolling Conservation Buffers in the CRP. Land Use Policy 20: 73-84.
Lohr, L., and T. Park, “Utility-Consistent Discrete-Continuous Choices in Soil Conservation,” Land Economics 71(4) (1995): 474-90.
Lynch, L., I. Hardie, and D. Parker, Analyzing Agricultural Landowners’ Willingness to Install Streamside Buffers, Working Paper No. 02-01, Department of Agricultural and Resource Economics, The University of Maryland, College Park, (2002).
(www.arec.umd.edu/publications/papers/Working-Papers-PDF-files/02-01.pdf).
Smith, M., “Conservation Reserve Program Approaches Acreage Limit,” Agricultural Outlook, Vol. 262 (June/July 1999): 23-26.
(www.ers.usda.gov/publications/agoutlook/jun1999/ao262d.pdf)
Soule, M.J., A. Tegene, and K.D. Wiebe, “Land Tenure and the Adoption of Conservation Practices,” American Journal of Agricultural Economics, 82(4) (2000): 993-1005. Tunali, I., “A General Structure for Models of Double-Selection and an application to Joint
Migration/Earnings Process with Remigration,” Resource Labor Economics 8 (1986): 235-82.
Wilson, G.A. 1997. Factors Influencing Farmer Participation in the Environmentally Sensitive Areas Scheme. Journal of Environmental Management 50: 67-93.
Figure 1 24.4 19.1 39.2 5.8 4.5 7.1 Non-Participants = 83 % Retired/Resid/ - Life-Style 2 = Fmg Occup/Sales < $100,000 Fmg Occup/-Sales ≥ $100,000 Participants = 17 % 1 2 3 3 = 1 = Farms (% by Class)
Percent Distribution of the 2004 CEAP-ARMS for Wheat
Figure 2 0 10 20 30 40 50 60 70 80
Crop Rotation Conservation Tillage Scouted for Pests
Nutrient Tests VRT for Seed & Fert. GPS-based Soil Map 1+ Conserv. Structural Prac. 5+ Pest Mgmt. Prac.
Retired/Resid/-Life-Style
Non-Participants by Farm-Size Participants by Farm-Size
Fmg Occup/-Sales < $100,000 Fmg Occup/-Sales ≥ $100,000 X X 0 Retired/Resid/-Life-Style Fmg Occup/-Sales < $100,000 Fmg Occup/-Sales ≥ $100,000 14.9 17.7 47.2 4.4 4.6 11.4
= % of Pltd. Wht. Acres (by Class)
P
er
ce
nts
Land-Management Conservation Practices for 2004 Wheat
Percent of Practice Acres (by Participation & Farm Class)
Figure 3 0 10 20 30 40 50 60 70 80 90
Terraces Grassed waterways Vegetative buffers (in field) Hedgerow plantings
Stream-side forest buffers Stream-side herbaceous buffers Windbreaks Contour buffers (in field) Field borders Filter strips
Critical area plantings Grade stabilization structures Non-Participants (% Sum = 100) Participants (% Sum = 100)
P
ercen
ts
0.8 2.3 X 0 0 X X
NP =75.9 % P =24.1 %
of All Wheat Acres of All Wheat Acres
Conservation Structural Practices for 2004 Wheat
Percent of Structural Practice Acres (separately, by Participation Class)
Table 1. Average field/farm characteristics for 2004 wheat producers, by conservation program participation and by farm-size class.
Non-Participant farms Participant farms
Field/Farm Characteristics Retired/- Residential/- Life-style Farming- Occupation/- Sales < $100,000 Farming- Occupation/- Sales ≥ $100,000 Retired/- Residential/- Life-style Farming- Occupation/- Sales < $100,000 Farming- Occupation/- Sales ≥ $100,000
General Field/Farm Values
Percent of farms (horizontal sum = 100) 24.4 DEF c 19.1 CDEF 39.2 BDEF 5.8 4.4 7.1 ABC
Farm acres operated 974 CF 698 CF 2,155 ABDEF 659 596 3,335 ABCDE
Farm wheat acres harvested 128 CF 185 CF 494 ABDEF 136 187 815 ABCDE
Percent of wheat acres planted
(horizontal sum = 100) 14.9 CDE 17.7 CDEF 47.2 ABDEF 4.3 4.6 11.3 BCDE Acres owned to acres operated (ratio) .59 E .74 CEF .36 BDE .85 .93 .46 BDE
Farm Financial Values
Farm total value of production ($) 90,674 CF 46,847 CDF 479,929 ABDE 69,029 44,398 414,081 ABDE
Ave. farm revenue share from wheat (%) 18.0 BE 33.0 AC 23.0 BE 24.0 49.0 34.0
Total farm net worth [equity] ($) 449,609 CF 699,880 CF 1,612,351ABDE 697,961 386,481 1,228,286 ABDE
Ave. net farm income ($) 12,761 F 13,254 F 53,873 10,281 1,774 81,732 ABDE
Operator Characteristics
Ave. operator age 54 60 CF 50 BD 57 55 53 B
Percent wheat farm operators with
some college (column %) 13.6 20.1 26.7 ABDEF 72.1 X b 30.8 Percent wheat farms with primary
operator working off-farm (column %) 67.4 29.7 21.8 EF 84.9 53.6 8.6
Government Payments ($/farm)
Direct government (AMTA) payments X 3,724 CF 21,695 ABDE 2,913 4,106 25,136 ABDE
Counter-cyclical payments 8,246 2,032 6,656 BDF 2,828 2,592 12,429
Conservation payments a 13,921 3,035 5,306 F 6,576 5,829 16,623 BC
Loan deficiency payments (LDP’s, etc.) 8,072 1,313 13,217 BDE 1,753 364 10,233 BDE
Total government payments: X 6,008 CF 32,276 BDE 8,750 7,461 42,171 ABDE
Agro-Environmental Values
Ave. harvested wheat yield (bu./ac.) 48 45 54 EF 50 43 46 C
Ave. nitrogen applied (lbs./ac.) 52.8 C 45.6 CF 77.3 ABE 58.7 43.6 66.7 BE
USLE soil loss (tons/ac./yr.) 1.8 DF 4.5 2.5 DF 12.4 2.0 4.3 ACE
Percent wheat farms with gully
erosion in wheat fields (column %) 6.5 16.5 8.2 X 9.5 7.8 Percent wheat farms with wheat field
adjacent to a water body, intermittent
stream or wetland (column %) 16.5 45.1 33.6 DEF 31.0 23.2 15.3
Percent of wheat acres [with HEL
acres in wheat field] (column %) 7.0 11.9 17.6 ABDE 32.9 9.7 67.7 ABDE
Percent of wheat acres [with wetlands
in the wheat field] (column %) X 13.2 3.8 X 17.5 2.7 Source: 2004 CEAP-ARMS Wheat Survey, Economic Research Service, U.S. Department of Agriculture.
a/ Conservation payments here, for non-participants and participants, include government payments for all conservation activities, including land retirement from such programs as the CRP and WRP, and for conservation activities for the entire farm that are not included in our definition of participant (which is based on Phase II-based program participation information) (see footnote 5).
b/ X indicates that there were insufficient observations for these estimates.
c/ Letters A,B,C, D, E, and F indicate significant column difference tests based on pairwise two-tailed [Ho: β1=β2] delete-a-group Jackknife
Table 2. First-stage bivariate probit estimates for ‘program participation’ and ‘technical assistance’, 2004 CEAP-ARMS phase II/III.
Variable Units Estimate t test Estimate t test
Constant -0.82 -0.56 -1.18 -0.85
Soil loss measure (t/ac/yr) 0.03 0.67 0.04 0.79
Installed structure to improve wildlife (1=yes) 1.10 1.69 0.36 0.52
Tenure (owned/operated acres) owned/operated ac. 0.58 1.96 0.23 0.65
Program payments./acre (CCP, AMTA, LDP) $/acre 0.00 0.05 0.00 0.42
Total expenditures $ 1000s 0.00 -0.14 -0.01 -0.58
Revenue from survey field, previous year $/acre 0.00 -1.86 0.00 -1.17
Survey field next to water source (1=yes) -0.19 -0.52 -0.10 -0.27
Gully erosion (1=yes) 0.10 0.20 0.06 0.14
Total acres operated Acres 0.10 1.07 0.05 0.63
%production revenue from grains % 0.12 0.20 0.40 0.72
Crop rotation (1=yes) 0.64 1.42 0.61 1.02
Drainage structures (1=yes) 0.76 0.94 0.42 0.76
Conservation tillage (1=yes) 0.39 1.15 0.14 0.50
Off-farm income/Total household income % 0.08 0.15 0.30 0.66
Operator attended some college (1=yes) 0.12 0.35 0.04 0.12
Operator age Years 0.00 -0.16 0.01 0.70
Household size Count -0.23 -1.42 -0.06 -0.60
Northern plains (1=yes) -1.06 -2.63 -1.75 -3.15
Southern plains (1=yes) -0.74 -1.55 -0.92 -1.60
Midwest (1=yes) -0.16 -0.29 -0.80 -1.09
Metropolitan county (1=yes) -0.69 -0.86 -0.69 -1.41
Population loss county (1=yes) 0.05 0.17 0.54 1.74
Manufacturing dependent (1=yes) -0.83 -1.60 -0.26 -0.50
Service industry dependent (1=yes) 1.52 1.60 1.35 1.38
Distressed housing county (1=yes) 0.29 0.42 -0.02 -0.03
ρ 0.90 27.00
Log likelihood -120,493
McFadden's R2 0.29
N (number of farms) 461 (186,729) 461 (186,729)
Number of particpants/tech. assist. 104 34,023 192 57,131
Participation Technical assistance
Notes: Critical values for the t tests are 1.52, 1.76, and 2.14 for the 15%, 10%, and 5% significance levels.
Table 3. First-stage bivariate probit results for technical assistance and program participation, 2004 CEAP-ARMS phase II.
Variable Units Estimate t test Estimate t test
Constant -0.66 -1.50 -0.03 -0.04
Tenure (owned/operated acres) owned/operated ac. 0.15 0.65 0.05 0.23
Installed structure to improve wildlife (1=yes) 0.68 2.79 0.50 1.77
Total acres operated Acres 5.E-05 1.19 5.E-05 1.77
Soil productivity Field revenue, previous yr. -1.E-03 -1.17 -3.E-04 -0.37
Soil loss measure t/ac/yr 0.03 0.84 0.05 1.65
GPS soil test (1=yes) -0.10 -0.37 -0.09 -0.21
Survey field next to water source (1=yes) -0.40 -2.96 0.07 0.28
Gully erosion (1=yes) 0.30 0.89 0.00 -0.01
Crop rotation (1=yes) 0.42 1.44 0.22 0.86
Drainage structures (1=yes) 0.44 1.09 0.10 0.39
Conservation tillage (1=yes) 0.13 0.73 0.22 1.00
Northern plains (1=yes) -0.85 -2.94 -1.24 -2.85
Southern plains (1=yes) -0.73 -1.50 -1.02 -2.32
Midwest (1=yes) -0.64 -1.38 -0.53 -0.85
Metropolitan county (1=yes) -0.24 -0.60 -0.40 -1.32
Population loss county (1=yes) 0.03 0.20 0.26 1.16
Manufacturing dependent (1=yes) -0.57 -1.41 -0.30 -0.60
Service industry dependent (1=yes) 0.05 0.08 0.01 0.01
Distressed housing county (1=yes) 0.31 0.62 -0.17 -0.39
ρ 0.84 10.59 N (number of farms) 686 (1,010,908) 686 (1,010,908) Participants 148 (219,008) 276 (390,443) Log likelihood -881,932 McFadden's R2 0.14 Technical assistance Particpation
Notes: Critical values for the t tests are 1.52, 1.76, and 2.14 for the 15%, 10%, and 5% significance levels.
Table 4. Second-stage Tobit results, 2004 CEAP-ARMS phase II/III and phase II.
Varable Unit Estimate t test Marginal effect Estimate t test Marginal effect
Soil loss measure tons/acre/year 0.14 0.25 0.04 1.07 1.77 0.35
Program participant Predicted value 1.11 0.61 0.31 1.59 1.81 0.52
Consulted with expert/extension Predicted value 0.04 0.09 0.01 -0.27 -0.72 -0.09 Installed structure to improve wildlife (1=yes) 31.51 5.83 8.87 9.29 1.33 3.01
Tenure (owned/operated acres) Ratio -1.05 -0.16 -0.30 -5.44 -1.37 -1.76
Program payments./acre (CCP, AMTA, LDP) $/acre 0.10 0.38 0.03
Total expenditures $ 1000s 0.31 1.48 0.09
Revenue from survey field, previous year $/acre -0.03 -0.72 -0.01 2.E-03 0.48 7.E-04
Survey field next to water source (1=yes) 8.91 1.11 2.51 12.68 2.73 4.11
Total acres operated Acres -1.11 -0.52 -0.31 -3.E-04 -0.32 -1.E-04
%production revenue from grains % 23.94 1.99 6.74
Off-farm income/Total household income % -2.70 -0.31 -0.76 Operator attended some college (1=yes) 16.92 3.06 4.77
Operator age Years -0.06 -0.17 -0.02
Household size Count -4.65 -1.98 -1.31
Northern plains (1=yes) 14.29 1.03 4.03 -0.46 -0.07 -0.15
Southern plains (1=yes) 27.55 2.47 7.76 11.81 1.57 3.83
Midwest (1=yes) 17.88 1.27 5.04 10.29 1.38 3.33 Constant -51.46 -1.56 -28.97 -2.44 σ 33.35 8.63 32.77 9.84 N (number of farms) Log likelihood McFadden's R2 461 (186,729) -413,994 0.071 686 (1,010,908) -2,225,055 0.016 Phase 2/3 Phase 2
Notes: Critical values for the t tests are 1.52, 1.76, and 2.14 for the 15%, 10%, and 5% significance levels. 1/ Predicted values are used for the “program participation” variable from the first-stage probit regression. Source: 2004 CEAP-ARMS phase II/III.