MNB Background Studies
1/2004
T
HEO
PTIMALR
ATE OFI
NFLATION INH
UNGARYGergely Kiss and Judit Krekó
Online ISSN: 1587-9356
Gergely Kiss, Economics Department, Monetary Assessment and Strategy
E-mail:
kissge@mnb.hu
Judit Krekó, Economics Department, Monetary Assessment and Strategy
E-mail:
krekoj@mnb.hu
The MNB Background Studies series is comprised of economic analyses
related to monetary decision-making at the Magyar Nemzeti Bank. The aim
of the series is to enhance the transparency of monetary policy. Towards
this end, in addition to studies that present technical details related to
forecasting, background materials addressing the economic issues that arise
in the course of decision preparation are also published. This series is only
available in electronic format.
The views expressed in this analysis are those of the authors and do not
necessarily reflect the official stance of the MNB.
Magyar Nemzeti Bank
1850 Budapest
Szabadság tér 8-9.
Tel: 428-2600
CONTENTS
Introduction 4
I.COSTS OF INFLATION 6
I. 1 Costs stemming from high inflation 6
I. 2 Costs arising from inflation uncertainty 7
I. 3 Empirical results 8
II.ARGUMENTS FOR LOW POSITIVE INFLATION 10
II. 1 Asymmetric nominal rigidities 10
II. 2 Danger of deflation and the non-negativity of the nominal rate of inflation 12
II. 3 The bias in consumer price index 13
III.PRICE STABILITY IN HUNGARY 16
III. 1 The Balassa–Samuelson effect and asymmetric nominal rigidities 16
III. 1. 1 Asymmetric price rigidity 16
III. 1. 2 Asymmetric nominal wage rigidity 21
III. 2 The lower limit of the nominal rate of inflation. Deflation 22
III. 3 Bias in the CPI 23
III. 4 Summary of the individual factors 24
Conclusions 25
APPENDIX:INTERNATIONAL EXPERIENCE 27
Abstract
Prepared at the request of the Monetary Council of the Magyar Nemzeti Bank, this analysis, which takes into consideration the specific characteristics of the Hungarian economy, sets out to determine a level of inflation that corresponds to price stability. Price stability is defined as a level of inflation that allows for maximisation of social welfare over a horizon of approximately 15–20 years, a period corresponding to the first phase of economic convergence. In developed economies, maintenance of price stability is considered to be the primary objective of central banks. The underlying reason for this is the realisation that inflation causes welfare losses. However, price stability is generally defined as low inflation, but not a zero rate of inflation. The reason that there should be positive inflation is that very low inflation, approaching zero, reduces long-term social welfare. This is explained by a number of factors such as asymmetric nominal rigidities, the risk of deflation, the necessity of positive nominal interest rates and statistical measurement bias in the CPI. We sought to find an answer to the question of whether or not, owing to the country’s catching-up status, optimal inflation is higher in Hungary than the 1%–2.5% inflation rate defined as optimal inflation in developed countries. To summarise the above considerations, we estimate the rate of inflation corresponding to price stability presumably to be higher than the ECB’s inflation target. Our calculations suggest that, over the long term, inflation in the range of 2.3%–3.2% can cushion the costs of deflation and compensate for distortions in the CPI. In addition, it allows for relative price adjustments even if Hungarian tradable prices move broadly in tandem with those of Hungary’s trading partners and downward price rigidity is assumed.
Introduction
*This analysis, taking into consideration the specific characteristics of the Hungarian economy, seeks to determine a level of inflation that corresponds to price stability. Price stability is defined as a level of inflation that allows for maximisation of social welfare over a horizon of approximately 15–20 years, a period corresponding to the first phase of economic convergence. The optimal inflation rate we have calculated refers to the concept of long-term inflation (i.e. over a 15–20 year horizon), from which the optimal rate of inflation may depart in the short run in response to changes in the cyclical position or supply shocks.
Today, in reflection of social preferences, central bank acts in developed economies define the maintenance of price stability as the primary objective of monetary policy. The underlying reason for this is the realisation that inflation causes welfare losses. The practice of individual central banks varies from country to country in terms of the definition and quantification of price stability, indicating that the quantification of price stability is not unequivocal and that the optimal level of inflation depends on the characteristics of the economy in question. However, there seems to be a general consensus that a low but positive rate of inflation rather than a stable price level should be set as a long-term objective.
The practical implications of long-term optimal inflation in Hungary are, to a certain extent, limited by the fact that the medium/long-term inflation target should meet the criteria of adopting the euro. In order to join the euro area, Hungary must reduce inflation to a level consistent with the relevant convergence criterion, the benchmark rate of which varied between 1.8% and 3.6% between 1997 and 2003. After Hungary’s adoption of the common currency, the rate of inflation in Hungary will be determined within the framework of the single monetary policy. With the abandonment of independent monetary policy, equilibrium inflation will depend on inflation in the euro area and equilibrium real exchange rate appreciation.
Nevertheless, optimal inflation is important in deciding whether or not to set a long-term inflation target, and if the decision is made to do so, in deciding what the inflation target that the central bank sets as corresponding to price stability for the period leading up to Hungary’s EMU entry should be. Given that no definite date is set for entry, and that we do not know what level of inflation will meet the convergence criterion, a medium-term inflation target may be key to shaping expectations.
Relying on economic theory, the first part of this analysis provides an overview of the factors determining the level of optimal inflation. Section I addresses the issue of the costs of inflation, i.e. the factors causing welfare losses. If inflation only had costs, optimal inflation would stand at zero. Section II sums up the factors that explain why welfare losses caused by inflation are non-linear. We present the arguments proposing that price stability, i.e. the long-term optimal level of inflation, is a low, but positive value, rather than zero. Taking the characteristics of the Hungarian economy into consideration, Section III evaluates the significance of the individual factors, and sets out to determine an inflation level that is consistent with price stability. Finally, the Appendix
* The authors are grateful to Attila Csajbók, Ágnes Csermely, Barnabás Ferenczi, István Hamecz, Zoltán
Jakab M., Júlia Király, Mihály András Kovács, Attila Rátfai, András Simon, Sándor Valkovszky, Balázs Vonnák and the participants of panel discussions held at the MNB for their useful comments and invaluable assistance. All remaining errors are the authors’ sole responsibility.
offers an overview of the definitions provided by central banks in developed and emerging economies, along with the underlying reasons.
The time horizon of our analysis requires some explanation. We attempt to identify a level of inflation that allows for the maximisation of long-term, i.e. 15–20-year, economic growth, i.e. a level of inflation that can be regarded as optimal over this horizon. We do not propose that income per capita will fully converge with the EU average within this time span. We only consider these 15–20 years to be the first stage of convergence. We contend that the convergence process influences optimal inflation. However, over time, as Hungary’s level of development approximates the EU average, the pace of convergence will inevitably slow down. Thus, the time horizon of our analysis is the early or first phase, rather than the entire length of the process of convergence. The reason for this is that, relying on available data, we can estimate the pace of convergence more accurately for this initial phase than for the entire duration of the convergence process. It should be emphasised, however, that the concept of price stability cannot be interpreted in the short run, i.e. inflation need not always stand at this level. The optimal rate of inflation may depart in the short run in response to cyclical fluctuations or supply shocks (e.g. an oil price shock). Our analysis does not answer the question of what path of disinflation the central bank should set in order to achieve an optimal rate of inflation. In performing our calculations, we adopted an asymmetric approach. Having accepted that both inflation and deflation cause welfare losses as discussed in Section I and II, in defining price stability we examine such factors that justify a level of inflation which is higher than a stable price level. Thus, in effect, we seek to identify the level of inflation below which inflation may result in welfare losses in the long run. Inflation above this level is also associated with costs. The reason for employing such an asymmetric approach is, in part, the fact that the main objective of this analysis is to determine whether or not, owing to the country’s catching-up status, optimal inflation is higher in Hungary than the inflation rate defined as optimal inflation in developed countries.
I.
Costs of inflation
Inflation harms the economy via two interrelated channels. The level of inflation, on the one hand, and inflation uncertainty, i.e. erratic changes in prices, on the other, may induce costs, thereby reducing social welfare. In the following, we will present the details of the costs of these two channels.
I. 1Costs stemming from high inflation
The relevant literature identifies several types of costs arising from high inflation. The costs that occur most frequently are:
• Menu costs: the most immediate costs of an increase in prices. These stem from the physical repricing of goods, i.e. the reprinting and tacking of new price stickers.
• Transaction costs: When inflation is high, holding cash needed for transactions is rather costly. As a result, economic agents try to minimise their cash holdings, with trips to banks and ATMs becoming more frequent. As this entails queuing and extra travel time, this leads to welfare losses which are difficult to quantify. This type of costs is aptly called ‘shoe-leather’ costs (Friedman).
• Distortions arising from the tax regime: One of the major ambitions of economic policy is to earn tax revenues while interfering with economic processes to the least possible extent. Nevertheless, taxation inevitably causes deadweight losses, to which inflation contributes in a number of areas. In market economies, the majority of tax revenues originate from taxes levied on income from labour and capital. Taxes on capital income (which are difficult to index technically) are linked to nominal rates. It follows then that given constant real rates, increasing inflation and nominal rates offsetting it generate an increasing tax burden. Owing to high inflation, capital income is currently practically tax-exempt in Hungary. When international examples are discussed, we will elaborate on the quantification of costs arising from the tax regime.
• Accounting distortions: In an inflationary environment balance sheets and income statements are more difficult to interpret. Inflationary distortions interfere with the monitoring of economic processes, rendering assessment of investment opportunities, decision-making and efficient operation of the capital market difficult.
• Legal distortions: tax rates and excise duties are specified in legal regulations (i.e. in various acts or decrees); if inflation is high, tax rates (e.g. income tax brackets and excise duties), which are invariably set for a longer term and in nominal terms, lead to unjustified distortions in tax burdens.
• Shortening of maturities: Even if it does not change the present value of cash flows, inflation creates difficulties in long-term financial relationships, since duration shortens. As higher inflation must be offset by nominal rates, the weight of interest payments relative to the repayment of principal inevitably increases within cash flows as a whole. As a result, current income can only repay smaller amounts of credit. As a consequence, the resultant tighter credit constraint will lead to a reduction in the depth of financial intermediation.
• Global environment: Integration into global financial markets may also add to the costs of inflation. Supposing that economic fundamentals and credit-ratings are identical, global investors expect, as a rule, lower interest premia in countries with
lower inflation. Consequently, in addition to the costs of inflation borne by the domestic economy, real interest rates may also rise in a country with higher inflation, due higher required risk premia.
I. 2Costs arising from inflation uncertainty
In practice, inflation and inflation uncertainty are interrelated, as high inflation invariably means volatile inflation, which, in turn, creates uncertainty.1 Price stability not only
means low, stable inflation, but also corresponding low, stable inflation expectations. If there is uncertainty, such expectations become more heterogeneous.
Inflation uncertainty causes welfare losses via the following channels:
• Price signals: In a well-functioning market economy the most important piece of information guiding economic agents is developments in market prices. If demand for a certain product increases, its price will also increase and vice versa. Prices reflect changes in supply and demand. Inflation uncertainty interferes with the information content of prices, as it is difficult to accurately judge whether an increase in prices is attributable to changes in supply and/or demand or it is the result of inflation compensation. In consequence, the economy as a whole cannot utilise its available resources efficiently.
• Income redistribution: Due to heterogeneous inflation expectations market participants intend to increase nominal prices differently. Depending on the outcome of actual inflation, some groups set higher real prices, others set lower ones, which inevitably changes income distribution in the economy. Such unintended income redistribution causes welfare losses to the economy as a whole, and hits the economically vulnerable groups of society (e.g. old-age pensioners and the unemployed) particularly adversely, since they cannot raise prices. The more unpredictable inflation is, the more far-reaching unintended income redistribution may be.
Wage negotiations provide an excellent example of inflation uncertainty. Both employers and employees aim at agreeing on a certain level of real wages; however, because of different inflation expectations, the same level of real wages reflects different demand for nominal wage raises. Volatile inflation may well cause actual real wages to deviate from the one previously agreed upon. Thus, higher-than-expected inflation is more detrimental to employees, while lower-than-expected inflation reduces corporate profit, owing to higher-than-planned real wages. Both impacts are equally harmful, as they divert the economy from the optimal level of real wages agreed upon by market participants.
• Shortening duration of contracts: Unanticipated inflation alters the value of wealth as well. Rising inflation reduces the value of fixed-income investments, particularly that of long-term financial assets. If there is inflation uncertainty, nobody wants to originate fixed-rate loans for a longer term, as future surprise inflation may erode the value of loans, thereby causing losses to lenders. In consequence, in an environment where inflation uncertainty prevails, shorter-term loans are more common in the economy. The fact that, for fear of high inflation, the depth of financial intermediation decreases has serious consequences for the whole economy. Economic participants cannot plan ahead, enter into long-term contracts or finance their investments with long-term loans.
Although we did not quantify welfare losses for Hungary, based on a closer look at the 1990s, it is easy to detect a close connection between the level of inflation and unanticipated inflation. It is hardly the case that unanticipated inflation causes serious problems only to economic agents, who watch economic processes less closely, e.g. households and small businesses. Reuters surveys of professional macroeconomic analysts reveal that not even experts were able to forecast inflation accurately for a year in advance (see Chart I-1). Their expectations were either significantly higher or significantly lower than actual inflation, with maximum differences in either direction amounting to 4 percentage points. Starting in mid-2001, disinflation is a good example of how the number of forecast errors by analysts decreases, given a lower range of inflation.
Chart I-1 Reuters’ inflation forecast and actual inflation
0 5 10 15 20 25 97 /J an 97 /J ul 98 /J an 98 /J ul 99 /J an 99 /J ul 00 /J an 00 /J ul 01 /J an 01 /J ul 02 /J an 02 /J ul 03 /J an 03 /J ul % -4 -3 -2 -1 0 1 2 3 4 5 %
Reuters inflation expectations 12 months earlier Actual year-on-year inflation
Difference (rhs)
Source: Reuters and MNB.
I. 3Empirical results
Feldstein’s well-known study (1996) provided new impetus for attempts at quantifying welfare losses. His results suggest that even low anticipated inflation, i.e. 2% above price stability, causes significant welfare losses in the US economy. His study quantifies how inflation increases tax regime-induced distortions and adds to dead weight losses in the economy.
Tax is levied on capital income in most advanced economies, with a fixed percentage of the nominal income paid in taxes. Taking into account that indexing of these types of taxes requires rather complicated administration, rising inflation leads to increasing tax burden and reduces real income. The underlying idea of the study is that, as inflation rises, taxes imposed on capital income increase the dead weight losses to the total economy. Studying the impact of the US tax regime on the behaviour of households (e.g. pension savings, mortgage loans and money demand), Feldstein found that a 1% rise in inflation would lead to a 0.5% decrease in GDP in the USA.
A number of central banks in Europe adopted a similar method in their own calculations. Bakhshi et al. (1997) and Tödter and Ziebarth (1997) revealed how significant inflation costs would be in the UK and Germany, respectively. As tax regimes are different in the two countries, actual results differ as well. A 1% rise in inflation would cause 0.7% and 0.1% losses in the GDP in Germany and the UK, respectively. As it was mentioned above, owing to high inflation, currently real income on capital is practically impossible
to tax in an economically reasonable manner in Hungary. When price stability materialises, there will be more balanced taxation of both labour and capital income, thereby reducing those on labour income.
International experience confirms that high inflation in excess of price stability undoubtedly harms economic growth. There is consensus in the economic literature that high inflation deteriorates economic performance and hinders productivity growth. Relying on data from a great number of countries, several empirical studies2 have shown
that inflation and inflation uncertainty have had an adverse impact on growth over the past decades all over the world. It has been proved statistically that high inflation has a negative impact on productivity and hence economic growth in both developed and developing economies.
Recent research on the costs of inflation proposes as its premise that the relationship between the level of inflation and its negative implications is non-linear. It argues that this relationship does not apply at a sufficiently low level of inflation, i.e. inflation at this level does not entail growth sacrifices. On the contrary: very low inflation may even lead to lower growth. The results of the studies, which are based on data from a number of countries, seem to be less conclusive as to the threshold below which the costs of inflation are no longer significant or when low inflation causes additional costs.
In their study prepared at the IMF, Ghosh and Phillips (1998) sought to answer to the question whether, using panel regressions, a negative relationship between inflation and growth could be identified within the moderate inflation range. They provided an estimate for a cut-off point above which growth impacts are negative and below which inflation boosts economic growth. Based on data for over 140 countries and spanning close to 40 years, their estimates suggest that with inflation of above approximately 2%– 3%, there is a significant negative correlation with economic growth, whereas with inflation below this level correlation is already positive.
Also using panel methods and a database similar to that used by Ghosh and Phillips, Khan and Senhadji (2000) examined the non-linear relationship between inflation and growth in both developed and developing economies. Their results suggest that the inflation threshold is very low for industrial countries (depending on data frequency, i.e. 1 or 5-year averages, it varies from 1% to 3%), with rather narrow (1%–4%) confidence intervals. Inflation threshold is much higher (11%–12%) for developing countries, and confidence intervals are also much wider (1%–20%). It is important to note that, based on the results of econometric tests, not only does high inflation have strong negative influences, but also inflation below the threshold level results in a statistically significant relation between inflation and growth, with inflation in this range boosting growth. According to the authors’ model, inflation exerts influence on income primarily through productivity; however, the model does not allow for the effects of inflation on fixed investment and employment; nor does it quantify welfare losses. Based on this, results must be treated with caution, as calculations may underestimate the negative effects of inflation.
A study prepared at the Reserve Bank of New Zealand (Brook et al. (2002)) presents an overview of panel estimates for non-linear effects and regards those results to be meaningful which suggest that the inflation threshold for industrial countries is 1%–3%. The following section provides a summary list of the factors that may underpin non-linearity.
II.
Arguments for low positive inflation
II. 1
Asymmetric nominal rigidities
According to the most frequent argument, low inflation facilitates more flexible relative price and wage adjustment if prices or wages are rigid downwards. The reason for this is that negative demand or productivity shocks force companies to reduce either prices or wages. If prices and/or nominal wages are sticky downward, and the price level is stable, relative prices and real wages are unable to fall to an extent that would be needed to restore equilibrium. As a result, companies curb output and employment levels in response.
Thus, if there are asymmetric nominal rigidities, zero inflation may make an efficient allocation of resources more difficult and sustainable unemployment higher. Given low, but positive inflation, unless they rise in conjunction with prices, wages and prices may decline in real terms, i.e. equilibrium real wages and relative prices can materialise without any reduction in nominal wages or prices. Overall, under very low inflation, a long-term trade-off between inflation and output may develop. In this case, positive inflation has a ‘grease effect’, resulting in higher and less volatile potential output.
Based on the above reasoning, the optimal rate of inflation in a given economy depends on the characteristics of existing nominal rigidities and the types of shocks to which the economy is exposed. More precisely, the optimal rate of inflation depends on whether the economy is exposed to nominal or real shocks, and whether such shocks are, as a rule, severe or slight. With respect to changes in prices and wages, it depends on how sticky they are, and whether they are more inflexible upwards than downwards. In a country where there are only nominal shocks and nominal rigidities are symmetrical, i.e. prices and wages are sticky both upward and downward, the costs of inflation outweigh the benefits of the ‘grease effect’; thus, in this case, the optimal rate of inflation is zero. Under such circumstances, any low positive level of inflation distorts price signals. By contrast, if shocks are mostly real, forcing economic participants to change relative prices and wages, and prices and/or prices and wages are stickier downward than upward, the optimal rate of inflation can by above zero. In this case, prices, and hence the allocation of resources, are slow in adjusting to shocks, and adjustment is inefficient. Low positive inflation may be instrumental in the necessary adjustment, as real wages and relative prices may be reduced without corresponding nominal wages and prices also being reduced.
The question is why workers accept declining real wages imposed by inflation, but not declining real wages imposed by nominal wage cuts. This phenomenon has traditionally been attributed to money wage illusion, i.e. employees cannot interpret the reduction impact of inflation on real wages. According to the reasoning of ‘fairness’, both employers and employees perceive a reduction in nominal wages as humiliating. Keynes (1936) and Tobin (1972) argue that employees are more interested in relative than absolute wages. Compared to an inflation-induced general reduction in real wages, they tolerate a reduction in nominal wages worse because they perceive it as a reduction in their relative wages. This holds true even if wage reduction is general, because wage negotiations are decentralised and employees have incomplete information on the wages of other employees.
Akerlof, Dickens and Perry (2000) propose that the underlying reason for employees’ willingness to accept a reduction in real wages through inflation more readily is not that they are unable to have realistic inflation expectations, but rather, that, in making their daily decisions, people do not consider low inflation, as they rely on simplified abstractions in doing so. Holden (2002) argues that, unlike psychological reasoning, certain institutional characteristics of wage-setting, including legislation and long-term contracts that protect the rights of employees and are perceived as realistic also by employers, provide plausible explanations.
The most common explanations for the downward stickiness of prices include consumers’ illusion of money, strategic corporate co-operation and price cuts signalling a deterioration in quality.3 In Mankiw and Ball’s menu cost model (1994), however, the
downward stickiness of prices is not an exogenous property, rather it is an endogenous response to trend inflation. Based on their model, inflation has no ‘grease effects’; on the contrary: it leads to asymmetric price adjustment and unjustified changes in relative prices and, consequently, with respect to nominal rigidities, the optimal rate of inflation is zero. Arguing for low positive inflation, Bashkar (2002), also with menu costs as the centrepiece of his model, claims that co-operation between companies in a given sector also implies asymmetric price adjustment, even without trend inflation.
Relying on a large variety of methods, estimates for various countries are inconclusive. A large number of studies both in favour of and against the existence of downward nominal rigidity and the ‘grease effect’ of low inflation have been published. Akerlof et al. (1996), Akerlof (2000), Wyplosz (2001), Dickens (2000), Groshen and Schweitzer (1999) argue for the existence of asymmetric wage rigidities in the USA and Europe. Estimates of Akerlof et al. (2000) for the USA reveal that downward wage rigidity is significant, therefore the optimal rate of inflation, under which unemployment can be kept at a minimum, is approximately 2% to 3%. In their calculations for the USA, Groshen and Schweitzer (1999) identify 2.5% as an optimal annual rate of inflation, under which the ‘grease effect’ can still offset costs arising from the ‘sand effect’. In their estimates for Germany, Knoppik and Beissinger (2001) arrive at the conclusion that an approximately 3% rate of inflation can minimise long-term unemployment. A number of studies (e.g. Lebow (1999)), although they accept or detect the existence of asymmetric rigidities, propose that the macro-economic impacts are insignificant. Yates (1998) and Card and Hyslop (1996) contest the existence of nominal wage rigidities in the UK and the USA respectively. Holden (2002) argues that very low inflation induced by downward nominal wage rigidities may raise long-term unemployment in Europe, but not in the USA.
Considerably fewer analyses have been undertaken to establish the existence of such asymmetric rigidities in the commodities market, which are unrelated to those in the labour market. Generally, they assume that price adjustment is more flexible than wage adjustment. Studying the distribution of individual changes in prices, an analysis prepared at the Central Bank of Japan (Kasuya, 1999) found significant downward price rigidities in items accounting for 20%–30% of the consumer basket. In the author’s view, this contributed to a slower-than-expected deceleration in Japanese inflation in the late 1990s, i.e. at the time of the economic downturn. Studying the distribution of individual changes in prices, Hall and Yates (1998) examined the RPI in the UK, and found that downward price rigidity was irrelevant.
Empirical results do not lend themselves easily to blanket generalisation, owing to several factors. One is that the importance of asymmetric nominal wage rigidities depends
heavily on how regulated the labour market is. A number of studies have provided evidence that the importance of asymmetric nominal wage rigidities is greater in Europe, where job security laws are stricter, trade unions are stronger and collective bargaining agreements play a more significant role, than in the USA.4
Another factor is that asymmetric rigidities in a low inflationary environment may be different from those in a high inflationary environment. In relation to revising the ECB’s goals, Rodriguez et al. (2003) argue that, as companies increasingly adjust to a low inflationary environment, so the importance of asymmetric nominal wage rigidities is likely to diminish in the euro area.
II. 2
Danger of deflation and the non-negativity of the nominal rate of
inflation
Another major argument against the zero inflation target is that the economy is more likely to slip into deflation under zero inflation. There is a widespread consensus that the costs of deflation are higher than those of inflation, i.e. the consequences of undershooting the inflation target are more serious under zero inflation than the costs incurred by overshooting it.
Deflation can lead to welfare losses via several channels:
• Debt deflation: An unexpected decline in prices reduces the value of collateral for loans, i.e. it results in the deteriorating creditworthiness of debtors, and of companies in particular. This increases the likelihood of corporate bankruptcies and affects fixed investment adversely, i.e. it ultimately reduces aggregate demand. If lenders’ marginal propensity to consume is lower, aggregate consumption will also decline. Debt deflation leads to an increase in credit risks and a decrease in credit supply through moral hazard and adverse selection, which may eventually jeopardise the stability of the financial system. The implications of deflation may be even more serious if wages are rigid downwards, because in this case real wages behave counter-cyclically, which exerts an adverse influence on employment and output. Debt deflation is preceded by the occurrence of a surprise deflation shock. Nevertheless, deflation expectations that emerge in its wake also result in serious consequences.
• The issue of delayed consumption: If households expect further a decrease in prices, they postpone the purchase of certain goods, which brings about declining aggregate consumption.5
• According to an argument citing the dangers of deflation, since the nominal rate of interest is zero-bounded (market participants can always hold their wealth in cash), very low inflation limits the possibility that the real rate of interest may decrease to a satisfactory extent when significant demand shocks occur.6 If, in the aftermath of a
shock, deflation expectations materialise, the real rate of interest may be very high, despite even a zero nominal interest rate, and such expectations cannot be reduced by interest rate policy. In this case, a deflationary spiral may emerge, entailing a
4 Holden (2002); Dickens (2000).
5 Provided that households’ disposable income does not decrease to the same degree as prices do.
6 There are examples of (e.g. Swiss) banks’ charging a certain amount of sums to deposit-holders on their
deposits. Such sums do not, however, qualify as interest in the economic sense. Rather, they are fees, thus, monetary policy cannot influence them.
simultaneous fall in aggregate demand and prices. Thus, the impact of monetary policy is not symmetrical in an inflationary and deflationary environment. If the nominal rate of inflation hits the floor of zero, there is no possibility of easing the monetary stance, which may, in turn, lead to the emergence of a deflationary spiral. If cash earns higher returns than does physical capital, economic participants try to ‘cash in’ their assets, which amounts to a negative net investment. Thus, this leads to the decapitalisation of the economy, with a resultant decline in consumption.
• It is important to note that only those lasting periods of deflation pose a danger to the economy which arise from a falling demand rather than from productivity growth. If central banks set also the lower limit of the range of the inflation target, this may, to a certain degree, counteract the emergence of persistent deflation expectations.7 If, however, the nominal rate of inflation hits the floor of zero, and
cannot be further reduced, the credibility of the inflation target may be at stake. With respect to avoiding the emergence of deflation and a liquidity trap, the optimal rate of inflation depends on (i) the probability of the evolution of deflation and the nominal rate of interest reaching zero, and (ii) the costs of the emergence of such a situation. Thus, when setting the inflation target, it is important to take into account the extent of cyclical fluctuations in the economy and the size and durability of the shocks to the economy. The extent of lowering the real rate of interest in response to a shock depends also on the short-term relationship between output and inflation as well as the efficiency of monetary transmission.8 Furthermore, stock must be taken of additional policy
instruments (e.g. exchange rate policy) available to absorb shocks if the nominal rate of inflation hits the floor of zero.
Although empirical experience with the dangers of deflation and the consequences of a liquidity trap is scarce, the Great Depression of 1929 and currently Japan provide excellent examples. The costs of deflation, detailed in this study, have been significant in these cases.
II. 3
The bias in consumer price index
Statistical problems related to the measurement of inflation offer an argument for positive inflation that is different from the above types. According to a widespread view, the CPI is often higher than actual changes in the costs of living. The underlying reasons for this are as follows:
• Product substitution: The CPI cannot reflect the impact of product substitution, as the items in the consumer basket are weighted in advance; i.e. it cannot allow for the fact that consumers may decide to use products whose relative prices fall as substitutes. As a result, when price ratios change, the cost of living rises more slowly than does the CPI.
• Changes in quality: When the quality of a product improves, only a portion of the resultant increase in its price can be attributed to a rise in the cost of living. When the CPI is measured, certain adjustments are, as a rule, made in order that
7 Based on this very consideration, e.g. Mishkin (2000) and Svensson (1999) consider the ECB’s inflation
target (2%) outright unfortunate.
8 Naturally, the characteristics of monetary transmission and the short-term relationship between output
changes to quality can be excluded. However, the measurement of a full range of changes in quality is close to impossible.
• Outlet substitution: An increased proportion of large outlets applying narrower profit margins in consumption may, ceteris paribus, reduce the cost of living. This is not, however, reflected in the CPI, since it feeds through to prices with a time lag.
• New products: As new products are not reflected in the consumer basket, or if they are, with a time lag, the CPI fails to reflect that kind of increase in welfare which is attributable to new products.
Estimates for bias in the CPI are 0.3 to 1.5 percentage points annually in developed economies (for a detailed treatment of this issue, see Section III.).
Although the extent of the estimated biases is not negligible, it is not unequivocal how monetary policy should allow for them in setting the inflation target. Apparently, when old-age pensions and other social benefits are indexed, it is an index from which biases have been excluded that should be used, since the very objective of indexing is to prevent the standard of living from falling. Likewise, in order to obtain a deflator used for the calculation of productivity growth, the upward bias attributable to quality improvement must also be excluded from data.
There seems to be no agreement, however, as to which price index is relevant to monetary policy. Is social welfare at its maximum when a cost-of-living type index is stable? What kind of a price index can be associated with price stability? According to Alan Greenspan’s classic definition of price stability (‘Price stability is the state in which expected changes in the general price level do not effectively alter business or household decisions’9), price stability means stable costs of living to households. Cechetti and
Wynne (2003) also argue that price stability, as central banks’ primary objective, must be unequivocally defined on the basis of the cost-of-living index.
Under a different approach, price stability is associated with the concept of monetary inflation, with the appropriate monetary index inferred from the costliness of holding cash. Accordingly, a price index relevant to monetary policy can be interpreted as the price index of households’ cash expenses, which gauges a deterioration in the purchasing power. The majority of the welfare costs of inflation (e.g. shoe-leather and menu costs, etc.) can be inferred from this definition. It is different from that of the cost-of-living index, which can be interpreted as minimum changes in the costs needed for the attainment of a given level of utility. Ferenczi, Valkovszky and Vincze (2000) also argue in favour of adopting the approach of transaction theory to the index relevant to monetary policy. This interpretation is reflected in the definition of the HICP, the euro area inflation indicator. Although, according to this approach, inflation is definitely not an index of changes in the cost of living, these two different philosophies also fail to provide an unambiguous answer to the question of how monetary policy should allow for the above biases, especially those arising from changes in quality and from the emergence of new products.10
9Federal Open Market Committee (FOMC) meeting, July 1996.
10 This is reflected also in the fact that, according to the argument of Ferenczi, Valkovszky and Vincze
(2000), price stability means unchanged costs of holding cash, rather than unchanged cost of living. However, they also add that the reason why, in practice, the definition of price stability is positive, rather than zero inflation, is that CIP is higher than changes to the cost of living, owing to the above biases.
Practice at various central banks reveals that in setting inflation targets, the majority of central banks which set explicit inflation targets declare that they allow for potential measurement errors in the CPI and define price stability as stable costs of living. Accordingly, substantive arguments for the quantification of the inflation target include the reasoning that measured inflation overestimates actual changes in the cost of living (e.g. in the UK, the euro area, Australia, Canada and the USA). The HICP, which is definitely not an index of the cost-of-living type, is of special importance. While providing a substantive argument for setting the inflation target, the ECB laid great emphasis on the biases discussed in this study.11 Furthermore, when the HICP is gauged,
the methods (e.g. hedonic regressions) used to correct the biases attributable to changes in quality (e.g. in the case of computers and cars) are also applied.
11 Unlike other central banks, the ECB used the upward biases in the CPI to justify its choice of not setting
III.
Price stability in Hungary
The above sections discussed the factors relevant to the quantification of price stability and long-term inflation targets. One of the objectives of this section is to find, in the light of the above factors, a way of defining long-term price stability in Hungary. Special attention will be paid to the factors arising from the catching-up status of the Hungarian economy. We wish to emphasise that we have adopted an asymmetric approach to quantification. Accepting as a given the broadly consistent results of the studies covering a number of countries and published in international literature, we propose as a hypothesis that inflation causes welfare losses. Thus, while examining the potential benefits associated with positive inflation, we identify the rate under which inflation poses long-term dangers, and above which the costs of inflation must be reckoned with.
III. 1
The Balassa–Samuelson effect and asymmetric nominal
rigidities
III. 1. 1Asymmetric price rigidity
One of the conclusions in the previous section was that the ‘grease effect’ of inflation could be perceived mainly when real shocks were dominant, and when price and wage rigidities were asymmetric, i.e. prices and wages were more rigid downward than upward. Owing to the mechanisms of the Balassa-Samuelson (BS) effect and as a result of the differences in productivity growth between the tradable and the non-tradable sectors, inflation in the two is expected to be persistently different, with the relative prices of non-tradables rising compared to those of tradables. As the amount of the difference in productivity growth between the two sectors exceeds that of our trading partners, increase in relative prices will also be faster.
Disregarding, for the time being, the rest of the world, we can say that changes in relative prices implied in the productivity gap between the two sectors can justify the need for positive inflation only if prices are sticky downwards. This is because zero inflation can materialise in the long run only through declining tradable prices and a slight increase in non-tradable prices. If, however, prices are rigid downward, any reduction in tradable prices is only feasible under stricter-than-justified monetary conditions, resulting in unnecessary growth sacrifice. Some manufacturers reduce production rather than prices, thus, equilibrium emerges against a backdrop of lower output.
It follows then that, if prices are sticky downwards, changes in relative prices occur most easily through a rise in prices. Given downward price rigidities, elastic changes in relative prices are brought about by such a level of inflation that ensures that, when equilibrium changes in relative prices is also taken into account, tradable inflation is not negative. If we only take domestic processes in productivity growth into consideration and ignore inflation abroad, this level of inflation can be regarded as that of the ‘grease effect’, which facilitates price adjustment provided that prices are perfectly rigid. If prices are equally elastic downward and upward, changes in relative prices are of no significance. Thus, with respect to the Balassa–Samuelson effect, the lower limit of optimal inflation is zero. However, in practice, as Hungary is a small, open economy, we must also allow for changes in tradable prices in global markets, as – in the long run – changes in such prices in
the domestic market can remain below tradable inflation abroad only in the case of nominal exchange rate appreciation. Tradable inflation in Hungary’s trading partners is, as a rule, somewhat above zero, between 1997 and 2003 it stood at 0.5% on average.12
This positive number is likely to respond in part to a bias in the CPI (see Section III.3). Nevertheless, it must be emphasised that a combination of an inflation level lower than tradable inflation abroad and nominal appreciation may cause macro-economic costs if the pass-through is imperfect and protracted.
How much ‘grease’ is needed?
The question arises as to how rigid prices are in a downward direction and what may be the costs of sustained nominal appreciation and a level of inflation that is persistently lower in Hungary than tradable inflation abroad.
As disinflation continues, historical experience of the stickiness of prices fails to provide even the usual number of clues to future developments for several reasons. One is that pricing is different under high and low inflation. The other is that under high inflation changes in relative prices and wages rarely translate into a reduction in nominal prices and wages. Thus, we have less experience with the downward rigidity of prices. Empirical studies on Hungary13 suggest that, compared to other countries, pricing in Hungary is
relatively flexible. Based on a corporate questionnaire survey, Tóth and Vincze (1998) found no significant downward price rigidity.
Perfect downward price rigidity can obviously be ruled out, as prices have been reduced on a number of occasions over the past years. In March 2004, for instance, the prices of 18% of the goods included in the price index (weighted according to the CSO’s standard classification of 156 categories) were lower than one year earlier. Price reduction alone does not contradict a certain degree of downward price stickiness, because we cannot rule out that, for lack of downward price rigidity, prices fell to a larger-than-experienced degree either. The distribution of changes in prices reveals more about asymmetric price rigidity, the positive skewness of which suggests that prices are more inflexible upward than downward. Our analysis on the distribution of changes in prices have neither substantiated nor ruled out unequivocally the existence of asymmetric price rigidity.14 In
12 The result of weighting EU member states on the basis of the structure of Hungarian foreign trade was
0.4%, which amounts to approximately 80% of foreign trade as a whole. Tradable inflation was 0.2% in Germany between 1997 and 2003.
13 Rátfai (2000), Tóth and Vincze (1998).
14 Testing asymmetric price rigidities on the basis of the distribution of changes in prices is widespread
practice in international literature (e.g. Yates (1998), Lebow et al. (1999)). Since it is price rigidities characterising mainly tradables that are relevant to this study, our conclusions were drawn from the distribution of changes in tradable prices. Estimates for the consumer basket as a whole led to similar results, though. Based on the 156-category breakdown of the CPI, estimates for the skewedness of changes in prices were provided in a breakdown of monthly price indices. Sixty-three price indices are included in the category of tradables under the MNB’s classification. The distribution of changes in prices varies from one month to the next. Though skewedness is broadly positive in the pattern, results did not corroborate the theory of downward price rigidity. The skewedness of distribution is not independent of inflation, however. If prices are sticky downward, skewedness should inversely correlate with inflation. The reason for this is that the nearer inflation moves to the zero boundary, the more frequently prices should fall, owing to changes in relative prices. Based on the above considerations, we examined the correlation between the skewedness of changes in prices and inflation for the sample pattern between January 1995 and July 2002. No significant negative correlation could be identified. Thus, results do not corroborate the theory of asymmetric price rigidity. Nevertheless, in our opinion, they do not overturn it either. A more detailed breakdown of tradables is more likely to yield more plausible and more robust results, as, given this aggregate level, even one price index could modify results significantly.
principle, downward price rigidity may have played a role in a slower-than-expected exchange rate pass-through following the widening of the intervention band of the forint; but there may have been other factors (e.g. greater exchange rate uncertainty) responsible for a weaker pass-through.
In addition to assumptions/estimates for downward price rigidity, an overview of international experience offers a new dimension. Though even advanced economies look back on relatively short periods of low inflation, international experience offers only a few examples of persistent reductions in tradable prices.
Tradable deflation was not persistent even in the low inflation euro area countries (see Chart III-1). Although in a few countries, such as the UK and the Czech Republic,
tradable prices have been decreasing consistently by an annual average of a few per cent for years now, this deflation was preceded by very significant, 25%–30%, nominal appreciation. Overall, exchange rate pass-through can be considered very slow.
Chart III-1 Tradable inflation in selected euro area countries (12-month indices) -2 -1 0 1 2 3 4 01. 97 05. 97 09. 97 01. 98 05. 98 09. 98 01. 99 05. 99 09. 99 01. 00 05. 00 09. 00 01. 01 05. 01 09. 01 01. 02 05. 02 09. 02 01. 03 05. 03 09. 03 Pe r c en t
Belgium Germany France Austria
Source: New Cronos.
The nominal effective exchange rate index appreciated by close to 25% in the Czech Republic from early 1999 to September 2002. At the same time, tradable prices only started to decline in early 2001, and had decreased by a mere 5% by late 2003 (see Chart III-2). The nominal effective exchange rate index in the UK has appreciated by nearly 30% since mid-1996; by contrast, tradable inflation has only been suggesting deflation since the spring of 2000, which can be ascribed mostly to a downturn in the business cycle. However, these examples reflect the impact of shock-like appreciation. In the long run, market participants may adjust to consistent and steady nominal appreciation.
Chart III-2 Tradable inflation in the Czech Republic and the exchange rate of the Czech crown (12-month indices) -4 -2 0 2 4 6 8 10 01 .9 3 07 .9 3 01 .9 4 07 .9 4 01 .9 5 07 .9 5 01 .9 6 07 .9 6 01 .9 7 07 .9 7 01 .9 8 07 .9 8 01 .9 9 07 .9 9 01 .0 0 07 .0 0 01 .0 1 07 .0 1 01 .0 2 07 .0 2 01 .0 3 07 .0 3 01 .0 4 P er cent 29 31 33 35 37 39 41 43 CZ K/E U R (r eve rse d sca le )
traded inflation (y-o-y) CZK/EUR (right scale)
Source: Ceska Narodna Banka.
Chart III-3 Tradable inflation in the UK and the exchange rate of the British pound (12-month indices) -4 -2 0 2 4 6 8 10 01 .9 0 01 .9 1 01 .9 2 01 .9 3 01 .9 4 01 .9 5 01 .9 6 01 .9 7 01 .9 8 01 .9 9 01 .0 0 01 .0 1 01 .0 2 01 .0 3 Pe r cent 80 85 90 95 100 105 110 115 19 90 =1 00
traded inflation (y-o-y) nominal effective exchange rate, 1990=100 (right scale)
Source: Bank of England.
Despite a lack of conclusive evidence, the quantification of ‘grease’ inflation is based on the assumption that tradable inflation is not lower in Hungary than that in its trading partners, which has been at approximately 0.5% over the past five years. The value that we calculated minimises the risk of excessively low inflation, i.e. it implies the assumption that the costs of too-low inflation exceed those of higher inflation than needed as ‘grease’.
We wish to note that, with regard to expected changes in relative prices, downward price rigidity stemming from nominal wage rigidity is of no relevance, as the inflation differential in the two sectors is attributable to higher productivity growth in the tradable
sector. If real wages rise in line with productivity growth in the tradable sector, wages will rise also nominally under zero inflation.
Our calculations are based on two key assumptions. One is that in the long run the tradable/non-tradable inflation differential is only determined by the difference in productivity growth in the two sectors. In fact, there are also other factors, e.g. changes in relative wages and relative profit rates, which influence relative prices in the two sectors (see Kovács (2002)). Our assumption for them, however, is that their expected value is zero over the long term, i.e. they do not follow any trend. The other assumption is that tradable inflation will, in the long run, follow that of our trading partners. We note here that, we used a long-term (15–20 year) inflation differential, which will decline as the end of the process of convergence draws closer.
Inflation can be written in the following format:
π
=
α
π
N+(1-
α
)
π
T=
π
T+
α
(
π
N-
π
T) (1)
where π denotes inflation
,
π
N andπ
T are non-tradable and tradable inflation andα
is the proportion of non-tradable goods in the CPI. Based on the above assumptions, the level of inflation that we set out to identify is:π
o=
π
T*
+
α
(a
T- a
N) (2)
where
π
T* is tradable inflation abroad, which was assumed to stand at 0.5%, and(
a
T- a
N)
denotes the productivity gap growth in the two sectors.
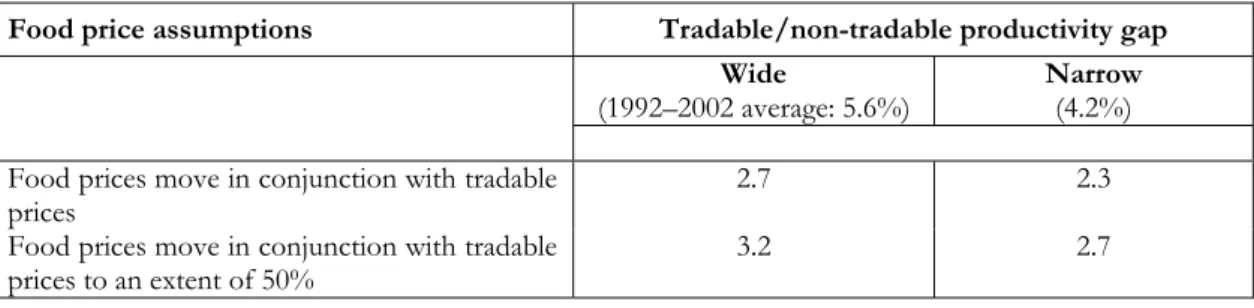
A crucial issue of calculations is the size of the gap between productivity in the tradable sector and in the non-tradable sector, which will determine the equilibrium inflation differential between inflation in the tradable and non-tradable sectors. The size of this productivity gap will ultimately depend on the pace of Hungary’s catching up with the euro area. Thus, what we should assess is the speed of real convergence. In doing so, we relied on historical experience, and, based on the findings of Kovács (2001) and Kovács (2002), we calculated the equilibrium inflation differential between inflation in the tradable sector and that in the non-tradable one for both wide and narrow tradable/non-tradable productivity gaps. The wide gap corresponds to the Hungarian average between 1992 and 2002, and the narrow one to Portuguese values in the 1980s and 1990s.
We proposed two different scenarios for the proportion of non-tradables. Under the first assumption, food prices behave similarly to those of tradables; under the second one, they are determined by tradable and non-tradable prices in equal measure (50%–50%). Goods with regulated prices were sorted into non-tradables, while motor fuel, alcohol, tobacco and market-priced energy were included in tradables under both scenarios. Table III-1 contains the results of our calculations.
Table III-1 Equilibrium inflation under 0.5% tradable inflation
Food price assumptions Tradable/non-tradable productivity gap
Wide
(1992–2002 average: 5.6%) Narrow (4.2%)
Food prices move in conjunction with tradable
prices 2.7 2.3
Food prices move in conjunction with tradable
prices to an extent of 50% 3.2 2.7
Overall, assuming that inflation abroad stands at approximately 0.5%, inflation in Hungary, under various assumptions, falls into the 2.3%–3.2% range. The above calculations identify a level of inflation that ensures that tradable prices neither decrease nor increase at a slower pace than those of Hungary’s trading partners. Accordingly, these calculations assume significant asymmetric rigidities, i.e. that any departure from inflation abroad and adjustment through nominal appreciation cause high costs.
Inflation’s ‘grease effect’ needed for the expected tradable/non-tradable inflation differential exceeds that in developed economies, which can be ascribed to higher productivity growth, which, in turn, can be attributed to economic convergence. Such higher inflation can also be perceived in the following manner: during the convergence process a lower level of prices attributable to a lower stage of development approximates that in developed economies. If there are asymmetric nominal rigidities, the level of prices should converge through higher inflation rather than the nominal exchange rate. The speed of price level convergence, and hence the level of the required inflation that ‘grease the wheels’ ultimately depends on the speed of real convergence.
III. 1. 2Asymmetric nominal wage rigidity
As productivity grows faster in Hungary than in developed economies, certain arguments for positive inflation seem less relevant here than there.
As was pointed out in the previous section, asymmetric wage rigidities bear no relevance to changes in relative prices brought about by the Balassa–Samuelson effect. As productivity grows faster in Hungary than in developed economies, asymmetric wage rigidity seems to be less relevant. .The reason for this is that, because of fast productivity growth, average real, and hence nominal, wage increase is high; as a result, it is less likely that a negative shock will necessitate a decrease in nominal wages. Thus, a decrease in real wages warranted by nominal wage rigidities should materialise through inflation.15
Based on past experience, little can be said of possible downward wage rigidities in a low inflationary environment. The reason for this is that, under moderate inflation, a decrease in real wages mostly materialised as a increase in nominal wages, which was lower than that in prices. Furthermore, the type and extent of downward rigidities probably depend on the level of inflation. We can safely say that the system of wage negotiations in Hungary supports flexible wage adjustment, since it is corporate level wage agreements that play the ultimate role in wage-setting. This, however, does not exclude the existence of asymmetric wage rigidities attributed to other causes (e.g. money illusion and habits). However, given that higher productivity growth is expected to result in faster growth in
15 Based on the findings of Kovács (2001), during the process of convergence productivity growth will be
approximately 2.2% to 4.1% higher in Hungary than in the euro area. In consequence, so will, ceteris paribus,
real wages, in our opinion, the asymmetric stickiness of nominal wages does not justify higher inflation than do the other factors.
III. 2
Non-negativity on nominal interest rate and deflation
Growth in emerging countries, which exceeds growth in the developed ones, results in a higher real return on equity, which may, in a closed economy, mean higher average nominal interest rates; i.e. the lower limit of the nominal rate of interest is less likely to be an effective hurdle in case of an economic downturn. In liberalised capital markets, this argument is not necessarily true because nominal interest rates depend on interest rates abroad, expected depreciation and required risk premia. As a result, financial real interest rates are not necessarily higher than those in developed economies. Although, generally speaking, real interest rates are indeed higher in emerging countries than in the majority of the developed ones, this can be attributed primarily to the fact that foreign investors require high risk premia.16 An excellent counter example is the Czech Republic, where
currently neither short-term real nor short-term nominal interest rates exceed euro interest rates at the same maturities.17
For deflation to be avoided, and in order for the optimal rate of inflation to be identified, it would, in principle, be necessary to have information on monetary transmission and the short-term correlation between inflation and output. As, however, no such information was available in Hungary, we looked to various analyses for guidance in terms of the information they had on developed economies. We then identified the differences that the characteristics of the Hungarian economy justified, relative to developed economies. Krugman (1999) and Orphanides and Wieland (1998) propose that in developed economies a 2% inflation target suited this purpose. Bernanke et al. (1999) and Mishkin (2000), however, argued that 1% inflation could serve as satisfactory insurance against the costs of deflation and the liquidity trap.
Judging from historical shocks to European economies, Vinals (2000) also claims that there is little likelihood of interest rates falling to zero, and a 1% inflation target can prevent such an event. Overall, there seems to be a widespread consensus on a 1%–2% CPI inflation.
When assessing the level of inflation that is needed to avoid deflation, one cannot tell for sure how biases in the CPI should be taken into consideration, i.e. whether the harmful effects of deflation present themselves when there are no biases in inflation or when deflation is reflected in the CPI. This issue will be further tackled in Section III-4.
As discussed above, owing to a higher real interest rate, the zero nominal rate of interest is less of an actual limit in Hungary; in consequence, the danger of the occurrence of a liquidity trap is smaller. Nevertheless, as a higher real interest rate is attributable to a higher required risk premium, and judging from the Czech example, no definitive assumption can be offered for higher real interest rates over the longer run. Based on available data, cyclical fluctuations are probably higher in Hungary than, for instance, in the euro area,18 which also increases the likelihood of the occurrence of deflation if
average inflation is very low. It is important to note that in a small, open economy the
16 Assuming that investors are risk-averse and capital flow is perfect, the real rate of interest would, in
principle, be lower in Hungary than in the euro area, as the exchange rate appreciates in real terms.
17 In April 2004, the key policy rate was 2% in both the Euro area and the Czech Republic.
nominal exchange rate may be an efficient tool for avoiding persistent deflation and the occurrence of a liquidity trap.19 Overall, if the devaluation of the nominal exchange rate is
an available tool, the emergence of neither deflation nor a liquidity trap is a real danger in Hungary. Nor are persistent deflation expectations likely to materialise. If the availability of the nominal exchange rate is limited, as is the case in, for example, ERM II, the costs of deflation may be significant. Even so, with respect to avoiding the occurrence of deflation and a liquidity trap, nothing seems to justify higher than 1%–2% inflation, i.e. a level proposed for developed economies.
III. 3
Bias in the CPI
There are several reasons why the bias in the CPI is generally greater in transition economies than in the developed ones. First and foremost, quality improvement and new products are likely to represent a more significant factor in converging economies. Second, an increase in the proportion of hypermarkets and large stores in retail consumption suggests that outlet substitution also exceeds the level common in developed economies. Some of the studies on the inflation biases in the CPIs of transition economies argue that, due to changes in relative prices, biases are stronger in transition economies than those in developed economies (e.g. Filer and Hanousek, 2000). The change in relative prices arising from the Balassa–Samuelson effect does not, however, imply greater consumer substitution. The reason for this is that, despite non-tradable/tradable inflation, the proportion of non-tradables in the consumer basket does not decrease; on the contrary: it increases consistently.20 As no empirical study on the
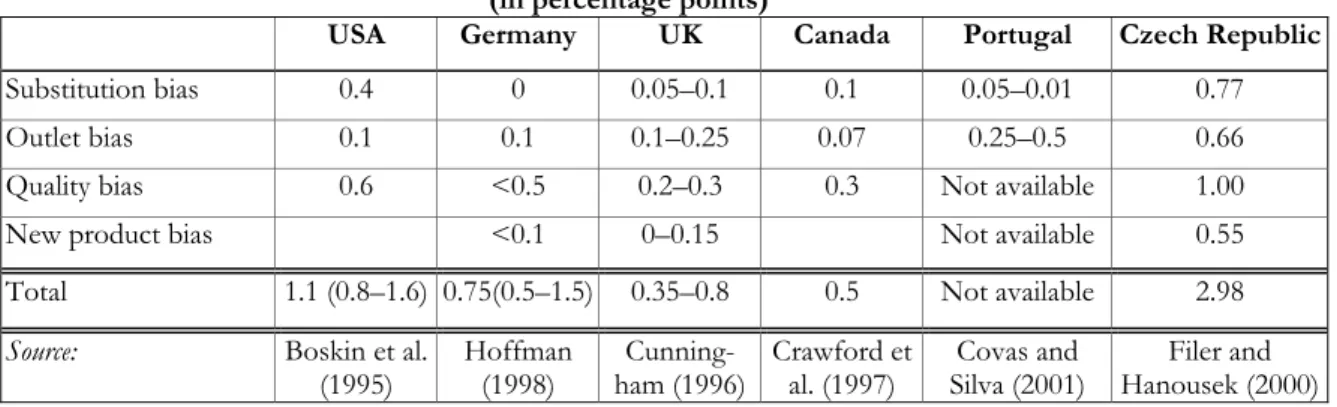
extent of the biases in the Hungarian CPI has been conducted yet, this study presents an overview of the ones conducted on biases in CPIs in various developed economies and the Czech Republic. It should be borne in mind that majority of studies with this subject matter in their focus express the extent of biases in percentage points. However, we have no knowledge of how the extent of biases depends on inflation.
The most detailed and comprehensive estimate is the one for the USA, published in the famous Boskin Report (1996). According to the report, the CPI in the USA overestimates the actual cost of living by 0.8% to 1.6% annually, the most accurate estimate being 1.1% when inflation stood at approximately 3%. No comprehensive estimate has been provided for the size of the bias in HICP in the euro area. The results
19 Svensson (2001), for instance, suggested that Japan should perform a significant one-off devaluation of
the nominal exchange rate and fix it at the resultant level. He further proposed as a ‘patented’ method of the country’s extricating itself from deflation that Japan should publicly announce the setting of an increasing price level.
20 Furthermore, change in relative prices can even lead to a downward bias in inflation. The reason for this
is that if changes in relative prices are attributable to changes in the structure of demand (e.g. changes in preferences), the proportion of certain goods may increase in the consumer basket despite rises in their relative prices. This is the case in Hungary and in most transition economies as regards increase in tradable/non-tradable prices implied in the Balassa–Samuelson effect. In spite of the non-tradable/tradable inflation differential, the proportion of non-tradables rises consistently rather than declines. As the consumer basket is based on the one of 2 years earlier, the proportion of non-tradables is, as a rule, lower than their actual proportion, which may result in a downward bias in the CPI. Overall, this downward bias is unlikely to be of any significance. If, based on recent experience, we assume that changes in the proportion of non-tradables amount to 1 percentage point and that the non-tradable/tradable inflation differential is 6%, the amount of the bias is 0.06 percentage point. In addition, they do not neutralise biases arising from changes in relative prices within the individual sectors. However, they indicate that changes in relative prices, which are more marked than those in developed economiesm, do not lead to more pronounced substitution.
of the studies on the individual EMU countries are scattered in rather a wide range, i.e. 0.3 to 1.6 percentage points annually21 (see Table 3). In addition to the above, estimates
were made for outlet and consumer substitution in Portugal. They were invariably an annual average of 0.25–0.5 and 0.05–0.1 percentage points, respectively.
Of the transition economies, the Czech Republic was studied comprehensively for bias in the CPI.22 Findings show that in 1996 and 1997, with annual inflation at 8.5%, the CPI
overestimated actual inflation by approximately 3 percentage points, of which 1.5 percentage points was attributable to the impact of new products and changes in quality. Studies by Filer and Hanousek (2000 and 2002) on the Czech CPI corroborated the existence of stronger bias in the period of transition, and found that the Czech CPIs were more biased than those in developed economies, though under high inflation. It should also be borne in mind that these estimates were made at an earlier stage of transition. Biases are likely to become weaker as convergence goes on and more sophisticated methods of corrections are worked out.
A partial estimate was made for the substitution bias in Hungary (see Ferenczi, Valkovszky and Vincze (2000)), which, however, identified a downward bias. This also suggests that a high proportion of changes in relative prices alone does not mean more marked substitution.23
Table III-2 Estimates for biases in the CPIs in a few countries (in percentage points)
USA Germany UK Canada Portugal Czech Republic
Substitution bias 0.4 0 0.05–0.1 0.1 0.05–0.01 0.77
Outlet bias 0.1 0.1 0.1–0.25 0.07 0.25–0.5 0.66
Quality bias 0.6 <0.5 0.2–0.3 0.3 Not available 1.00
New product bias <0.1 0–0.15 Not available 0.55
Total 1.1 (0.8–1.6) 0.75(0.5–1.5) 0.35–0.8 0.5 Not available 2.98
Source: Boskin et al.
(1995) Hoffman (1998) ham (1996)Cunning- Crawford et al. (1997) Silva (2001) Covas and Hanousek (2000)Filer and
The fact that we have no accurate knowledge of how bias depends on inflation imposes limitations on the direct adoption of the above estimates. The estimate for the Czech Republic is likely to be lower if inflation were also lower. Furthermore, as convergence continues, quality and new product biases are also likely to better approximate the size common in developed economies.
Based on the above considerations, we assume that, under low inflation, the size of the bias in the Hungarian CPI in the years to come will not significantly exceed 0.5% to 1%, i.e. the estimate provided for developed economies.
III. 4
Summing up the individual factors
As was discussed in Section II. 3, there seems to be no perfect consensus in technical literature on the extent to which the price index, relevant to monetary policy, should reflect changes in the cost of living, or to put it differently, to what extent biases in the
21 Wynne, Mark A., Palenzuela, Diego Rodríguez (2002).
22 Filer and Hanousek (2000).
23 Our estimate applied to the aggregate level of the group of 160 adopted by the CSO. However, the bulk
CPI should be taken into consideration. It is even less clear how biases in the CPI are related to other factors. A deflation-specific price index is unlikely to correspond to either a CPI or a perfect cost-of-living index.24 As the models referred to offered
estimates for inflation targets reflected in CPIs, if estimates are accepted, biases need not be incorporated into the proposed inflation targets. Thus, optimal inflation may, in principle, defined as an intersection of various indicators. Inflation ‘greasing’ relative price adjustment, for which we provided an estimate of 2.3% to 3.2%, is higher than the minimum level of inflation justified by other factors, i.e. this level of inflation provides satisfactory protection against deflation and can handle the bias in the CPI. It should be emphasised, however, that the optimal rate of inflation, in our calculations, refers to the concept of long-term inflation (i.e. over a 15–20 year horizon), from which the optimal rate of inflation may depart over the short term in response to a change in the cyclical position or a supply shock.
Conclusions
In developed economies, maintenance of price stability is considered to be the primary objective of central banks. The underlying reason for this is the realisation that inflation causes welfare losses. However, price stability is generally defined as a low, but non-zero rate of inflation. The rationale why positive inflation should prevail is that very low inflation, approximating zero, reduces long-term social welfare. This is explained by a number of factors such as asymmetric nominal rigidities, the risk of deflation, the zero bound of nominal interest rates and statistical measurement bias in the CPI. These factors were examined in the light of Hungary’s catching-up status. We sought to find an answer to the question as to whether or not, owing to the country’s catching-up status, optimum inflation is higher in Hungary than the 1%–2.5% inflation rate defined as optimum inflation in developed countries.
The rate of inflation corresponding to price stability should be higher in Hungary than in developed economies, mainly due to the Balassa–Samuelson effect. Relative price changes, expe