Report to the Congress on the
Availability of Credit
to Small Businesses
September 2012
On October 12, 2012, figure 2, panel A, was updated so that the data for the nonfinancial bond default rate now include the previously missing May value. In addition, in figure 5, panel C, the value for the fourth quarter of 1991 was removed from the start of the series so that the data now begin in 1992, as originally noted.
Report to the Congress on the
Availability of Credit
to Small Businesses
September 2012
This and other Federal Reserve Board reports and publications are available online at
www.federalreserve.gov/publications/default.htm.
To order copies of Federal Reserve Board publications offered in print, see the Board’s Publication Order Form (www.federalreserve.gov/pubs/orderform.pdf)
or contact: Publications Fulfillment
Mail Stop N-127
Board of Governors of the Federal Reserve System Washington, DC 20551
(ph) 202-452-3245 (fax) 202-728-5886
Executive Summary
... 1
Flows and Terms of Business Credit
... 5
Aggregate Business Financing
... 5
Financing by Nonfinancial Corporations
... 5
Financing by Small Businesses
... 8
Credit Use by Small Businesses
... 15
Small Business: Definition and Background
... 15
Risks of Lending to Small Businesses
... 17
Credit Use
... 19
Credit Application Experience
... 24
Providers of Credit to Small Businesses
... 27
Overview
... 27
Lending by Depository Institutions
... 28
Lending by Nondepository Sources
... 38
Special Issues
... 41
Government Initiatives to Support Credit Access for Small Business
... 41
Securitization of Small Business Loans
... 48
Personal Wealth and New Business Formation
... 52
References
... 55
iii
Executive Summary
Section 2227 of the Economic Growth and Regula-tory Paperwork Reduction Act of 1996 requires that, every five years, the Board of Governors of the Fed-eral Reserve System submit a report to the Congress detailing the extent of small business lending by all creditors. The act specifies that the study should identify factors that give policymakers insight into the small business credit market, including the demand for credit by small businesses, the availability of credit, the range of credit options available, the types of credit products used, the credit needs of small businesses, the risks of lending to small busi-nesses, and any other factors that the Board deems appropriate.1
Between 2007 and 2012, the years covered by this report, financial markets experienced extraordinary stresses. Conditions in financial markets began dete-riorating in 2007 and worsened dramatically in the fall of 2008. As the financial crisis intensified, the U.S. economy entered a recession. The financial crisis and the recession negatively affected credit flows to businesses for several reasons, including tight lending conditions that restricted the supply of credit by financial institutions, reduced investment opportuni-ties that depressed the demand for funds by busi-nesses, and the deterioration of the financial health of potential borrowers. Since the recession ended in the second quarter of 2009, overall lending condi-tions and credit flows have improved for businesses, but improvement has been slower for small
businesses.
The concerns of the Congress and other policymak-ing bodies about small business financpolicymak-ing largely stem from the perception that small firms have more difficulty gaining access to credit sources than do large businesses or other types of borrowers. The source of this difficulty may be that lending to small
businesses is generally considered riskier and more costly than lending to larger firms. Compared with larger firms, small businesses are much more sensitive to swings in the economy and have a much higher failure rate. In addition, lenders historically have had difficulty determining the creditworthiness of appli-cants for some small business loans. The heterogene-ity across small firms, together with widely varying uses of borrowed funds, has impeded the develop-ment of general standards for assessing applications for small business loans and has made evaluating such loans relatively expensive. Lending to small businesses is further complicated by the “informa-tional opacity” of many such firms. Little, if any, public information exists about the performance of most small businesses because they rarely have pub-licly traded equity or debt securities. Many small businesses also lack detailed balance sheets and other financial information often used by lenders in mak-ing underwritmak-ing decisions.
Up-to-date and comprehensive information about the universe of small businesses is sparse, and most evidence about financing needs and sources is derived from surveys. In response to the financial cri-sis and ensuing economic turmoil, the National Fed-eration of Independent Business (NFIB) sponsored surveys in 2009, 2010, and 2011 to gauge the credit access of small firms during this period.2The surveys show that, among small businesses, larger firms were more likely than smaller firms to use traditional sources of credit such as lines of credit and business term loans, and declines in usage between 2009 and 2011 were strongest for the smallest firms. However, whether this pattern reflects a greater need for credit at larger firms or whether lenders are simply more willing to extend credit to larger firms is unclear. The
1 As required by the law, the Board consulted with the
Comptrol-ler of the Currency, the Administrator of the National Credit Union Administration, the Administrator of the Small Business Administration, the Board of Directors of the Federal Deposit Insurance Corporation, and the Secretary of Commerce.
2 Each of the NFIB samples was drawn from the Dun &
Brad-street Market Identifier File and included between 750 and 850 small employer firms. For the surveys, small employer firms were defined as firms with between 1 and 250 employees in addition to the owner(s). The samples were stratified by employment size, and weighted responses are representative of the Dun & Bradstreet population of small employer firms in the United States in 2009, 2010, and 2011.
relationship between firm age and credit use is simi-lar to the relationship between size and use, with declines in usage between 2009 and 2011 being most apparent for the youngest firms.
In addition to traditional sources of credit, many small businesses rely on alternative means of financ-ing, including credit cards and trade credit. These widely used alternative forms of credit may be impor-tant both in financing small businesses and, as substi-tute products, in influencing the demand for tradi-tional credit by small firms. According to the NFIB surveys, just under 60 percent of small firms used a credit line or business loan in each year, but nearly 90 percent used a credit card or trade credit.
Although the vast majority of small firms used credit cards or trade credit, a large percentage of these firms paid their outstanding balances on time, sug-gesting that much of the use of these products was for convenience rather than for longer-term financing of expenses.
In some cases, small businesses may have wanted to use more credit than was reflected in the survey, but were unable to obtain it. According to the NFIB sur-veys, one-half of small businesses applied for some type of credit in 2009, and just over one-half of these applicants were successful in obtaining all or most of the credit for which they applied.3The application
rate in 2010 was similar to that in 2009, but the approval rate increased, with nearly two-thirds of firms obtaining all or most of the credit for which they applied. In 2011, the fraction of firms applying for credit increased more than 8 percentage points over 2010, but success rates declined to a level similar to that observed in 2009.
Besides the firms that were denied credit, some firms that may have wanted additional credit may not have applied for it because they anticipated that their applications would be denied. The NFIB surveys asked respondents whether they had forgone apply-ing for needed credit because of the expectation of denial. The data indicate that there may have been a large number of “discouraged borrowers” over this period; in 2009, more than one-third of the sample reported having forgone applying for credit for this reason. While this fraction declined a bit over time, it
remained at about 30 percent in 2011, a level that seems elevated relative to earlier periods.
Overall, credit use by small business has declined in recent years. This decline is likely due to a combina-tion of several supply and demand factors. First, the demand for credit started to decrease in late 2006, plummeted in 2008, and has only recovered partially since then. Second, credit generally became less avail-able as banks tightened their standards. Finally, small businesses’ financial health and their ability to pay their bills in a timely fashion have generally deterio-rated over this time, making it more difficult to bor-row, even if the firms desired to do so.
Small businesses obtain credit from a wide range of sources, including commercial banks, savings institu-tions, finance companies, nonfinancial firms, and individuals such as a family member or a friend. According to the 2003 Survey of Small Business Finances, depository institutions, which include com-mercial banks, savings institutions, and credit unions, supplied credit to more than three-fourths of the businesses that reported having outstanding credit.4 Nondepositories, which include both financial and nonfinancial firms, provided credit to about one-third of small businesses in 2003. More-current data suggest the continued importance of commercial banks as providers of credit to small businesses in recent years.
Because banks are the leading source of credit to small business, much attention has been paid to developments in banking that may influence credit availability. The substantial consolidation of the banking industry over the past 25 years is one such development. Mergers and acquisitions have dra-matically reduced the number of banks, thereby increasing the importance of large institutions and the concentration of industry assets. These changes to the structure of the industry have raised concerns about possible reductions in the availability of credit to small businesses because large banks tend to be proportionately less committed than smaller banks to small business lending.
The evidence suggests that small banks continue to account for a meaningful share of small business lending activity—measured by holdings of business loans equal to or less than $1 million (small) and
3 Credit types include a renewal of an existing line of credit, a
new line of credit, a new business loan, a credit card, or trade credit. In 2009, firms were also asked about their application for an equipment or vehicle loan, but this question was not asked in later years. For comparability, statistics reported here are only for firms that had an application other than an equipment or vehicle loan application in 2009.
4 Although somewhat dated, the 2003 Survey of Small Business
Finances provides the most currently available information on all sources of outstanding credit delineated by individual loans, amounts, and sources.
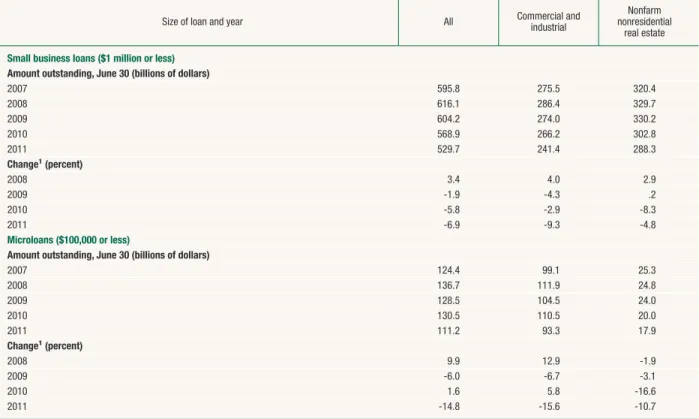
equal to or less than $100,000 (microloans).5In 2011, banks with assets of $250 million or less accounted for 66.8 percent of all banking organizations but only 4.0 percent of all banking assets. However, they held 13.7 percent of all small business loans and 13.9 per-cent of business microloans. In addition, the results of studies that directly analyze the relationship between consolidation activity and the availability of credit to small businesses tend to suggest that although mergers and acquisitions may sever existing bank–firm relationships and may introduce some short-term uncertainty, overall they have not reduced credit availability to small businesses. After a merger, any reduction in small business lending by the newly consolidated bank is generally offset by an increase in small business lending by other banks.
The relevant market for many small business loans remains local. The structure of the local banking market is particularly important because changes in concentration could affect the level of competition for small business lending, which, in turn, could influence the cost of borrowing and the quantity of credit demanded. The data show that despite the sig-nificant amount of consolidation in the banking industry, local banking markets do not appear to have become less competitive. Generally, in rural, micropolitan, and metropolitan statistical area mar-kets, the number of banks and offices has remained constant or increased somewhat, whereas the Herfindahl-Hirschman Indexes have either remained constant or decreased somewhat. Modest deconcen-tration, in conjunction with a small increase in the number of banks, suggests that a reduction in com-petition from commercial banking organizations is not likely to have been a contributing factor in the decline in the availability of credit in recent years. Savings institutions, defined as savings banks and savings and loan associations, provide much less credit to small businesses than do commercial banks. As of June 30, 2011, the value of small business loans held by savings institutions was slightly more than one-tenth of the value held by banks. The differences between the lending volumes of the two groups reflect both differences in the number of institutions (1,057 savings institutions versus 5,670 commercial
banking organizations) and differences in their busi-ness models.
Credit unions, which are not-for-profit financial cooperatives that are owned and controlled by the people who use their services, offer many of the same financial services that banks do. Like savings institu-tions, credit unions have not historically provided a great deal of credit to small businesses. However, credit unions have become a more important source of small business loans in recent years. Although out-standing small loans to businesses by credit unions remain a small fraction of those by commercial banks, they have increased steadily throughout the recession and post-recession period, while commer-cial banks’ small loans to businesses have declined. Between 2007 and 2011, credit union outstanding loans to business membersincreasedby 54.5 percent, while outstanding small loans to businesses by com-mercial banksdecreasedby 11.1 percent.6
In recent years, nondepository institutions have become increasingly important sources of financial services to small businesses. The 2009 NFIB survey reported less than 2 percent of businesses using something other than a bank, credit union, or savings and loan as their primary financial institution. This share more than doubled by 2011, when 5.0 percent of firms reported having a nondepository primary financial institution. In addition, firms may receive credit from institutions that are not their primary financial institution, likely making the shares of firms reporting them as a primary financial institution a lower bound for their total usage.
Support for small business development has been a priority of policymakers for several decades, and fed-eral, state, and local agencies have sponsored pro-grams that assist in channeling capital to small busi-ness. Several long-standing government initiatives exist to help support credit access for small busi-nesses, particularly small businesses owned by his-torically underserved groups such as women and minorities. Two such initiatives of particular impor-tance are the Community Reinvestment Act (CRA) and various loan programs sponsored by the Small Business Administration (SBA). The CRA was enacted in 1977 to encourage federally insured depository institutions to help meet the credit needs
5 Analysis of the small business lending activities of commercial
banks and savings institutions is based on midyear Reports of Condition and Income (Call Reports) and midyear Thrift Financial Reports, which are filed by commercial banks, savings banks, and savings and loan associations. These reports include information on the number and amount of business loans out-standing with original amounts of $1 million or less.
6 The outstanding business loans from credit unions are not
directly comparable with those of commercial banks because the credit union Call Reports do not allow construction and land development and agricultural loans to be taken out of the total.
of their local communities, particularly low- and moderate-income neighborhoods, consistent with safe and sound operations. The SBA provides financ-ing to young and growfinanc-ing small firms through several channels such as the 7(a) Loan Program and SBA 504 Certified Development Companies. Among the policy objectives of the SBA loan programs are the goals of promoting entrepreneurship opportunities for women and minorities.
Additional support for small businesses has come in the form of new legislation. The American Recovery and Reinvestment Act of 2009 and the Small Busi-ness Jobs Act of 2010 both provided resources to small businesses through increasing credit availability, providing capital to small business lenders, and put-ting in place tax cuts for small businesses. The most recent piece of small business legislation is the Jump-start Our Business Startups Act. Signed into law in early April of 2012, this bill is intended to make it easier for start-ups and small businesses to raise funds, especially through crowdfunding online. This legislation is a departure from the two earlier bills, as it is focused on access to finance through less conven-tional channels.
Securitization is the process of packaging individual loans and other debt instruments, converting the package into a security, and enhancing the credit sta-tus or rating to further the security’s sale to third-party investors. The securitization of small business loans has the potential to substantially influence the availability of credit to small businesses, but the obstacles to securitizing small business loans are large. Securitization generally has thrived in markets in which the costs of acquiring and communicating information to investors about loans and borrowers are low. Most small business loans cannot readily be grouped into large pools that credit agencies and investors can easily analyze: Loan terms and condi-tions are not homogeneous, underwriting standards vary across originators, and information on historical loss rates is typically limited. The information prob-lems associated with small business loans can be overcome, or offset to a degree, by some form of credit enhancement, as in the case of the SBA’s 7(a) loans. However, the more loss protection needed to sell the securities, the smaller are both the net pro-ceeds from the sale of the securities and the incentive
for lenders to securitize their loans. Small business loans are an asset for which the high transaction costs of providing credit enhancements have made many potential securitizations unprofitable. Despite these obstacles, between 2002 and 2007, securitization of small business loans increased at a moderate pace each fiscal year. Then, in late 2008, the securitization markets nearly collapsed. As the secondary markets froze and regulators attempted to restore financial stability, several actions were under-taken, with important implications for small business loan secondary markets. While the secondary mar-kets for SBA 7(a) loans and 504 debentures have largely returned to pre-crisis functionality, securities not backed by an SBA guarantee continue to struggle.
There is always a high degree of churning in the small business population, with firms going in and out of business. However, during the recent period, the rate of new business formation has declined. What has caused the lack of activity is not clear. There has been much speculation that the decrease in home prices—and consequently home equity—has con-strained potential entrepreneurs’ ability to finance new businesses. However, existing business owners consistently report that lack of demand and eco-nomic uncertainty are the largest problems facing their business in recent periods, not access to capital.7 The lack of demand, increased uncertainty, or both could have caused fewer business ideas to have a positive expected value and thus fewer businesses to be formed. Nonetheless, it does seem likely that the home price declines had some effect on the number of firms established over the recent period.
Overall, between 2007 and 2012, credit conditions for small businesses underwent substantial change. Favorable supply conditions prevailed until 2008, when such conditions tightened and demand fell. As the recession ended, supply conditions improved but demand remained weak. By 2012, credit flows to larger businesses had essentially returned to their pre-recession levels, while credit flows to small businesses, though improved, remained well below those levels.
7 For example, see Dennis (2011) and Dennis (2012).
Flows and Terms of Business Credit
Between 2007 and 2012, the years covered by this report, financial markets experienced extraordinary stresses. Conditions in financial markets began dete-riorating in 2007 and worsened dramatically in the fall of 2008.8As the financial crisis intensified, the
U.S. economy entered a recession. The financial crisis and the recession negatively affected credit flows to businesses for several reasons, including tight lending conditions that restricted the supply of credit by financial institutions, reduced investment opportuni-ties that depressed the demand for funds by busi-nesses, and the deterioration of the financial health of potential borrowers. Since the recession ended in the second quarter of 2009, overall lending condi-tions and credit flows have improved for firms, but the improvement has been slower for small businesses.
Aggregate Business Financing
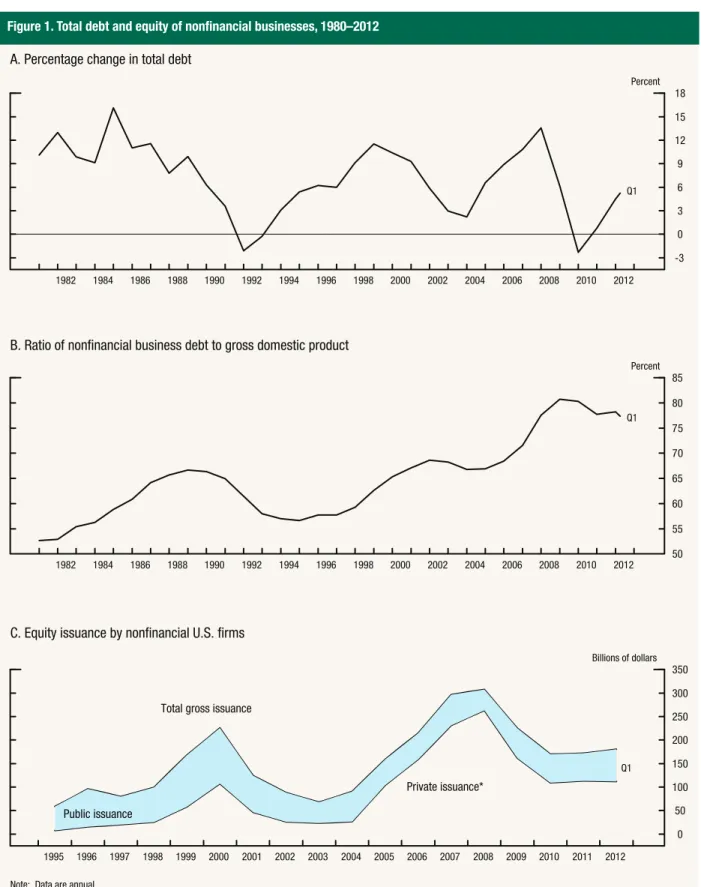
Nonfinancial business debt growth, which recorded double-digit percentage growth rates in 2006 and 2007, slowed sharply over 2008 and became negative in 2009 (figure 1, panel A).9Debt growth rebounded slowly in 2010 and has picked up more significantly since then. As a result, the ratio of nonfinancial busi-ness debt to gross domestic product reached record levels in 2008 but has since drifted down (figure 1, panel B).
Gross equity issuance by nonfinancial firms has also fallen notably since 2007 (figure 1, panel C). Public equity issuance, through both initial and seasoned offerings, which had maintained a moderate pace by historical standards from 2002 to 2007, dropped in 2008 but rebounded to its pre-crisis levels in 2009. In contrast, private equity issuance, which had increased sharply in the years preceding the financial crisis, dropped in 2009 and 2010 and has since maintained a moderate pace. In 2006 and 2007, the rate of equity retirements through cash-financed mergers and share buybacks was booming, resulting in substantially negative net equity issuance. However, equity retire-ments plummeted in 2008 and especially 2009 before rebounding in 2010 and 2011. As a result, net equity issuance, which remained negative throughout the period, returned to deeply negative levels by the end of 2011.
Financing by Nonfinancial
Corporations
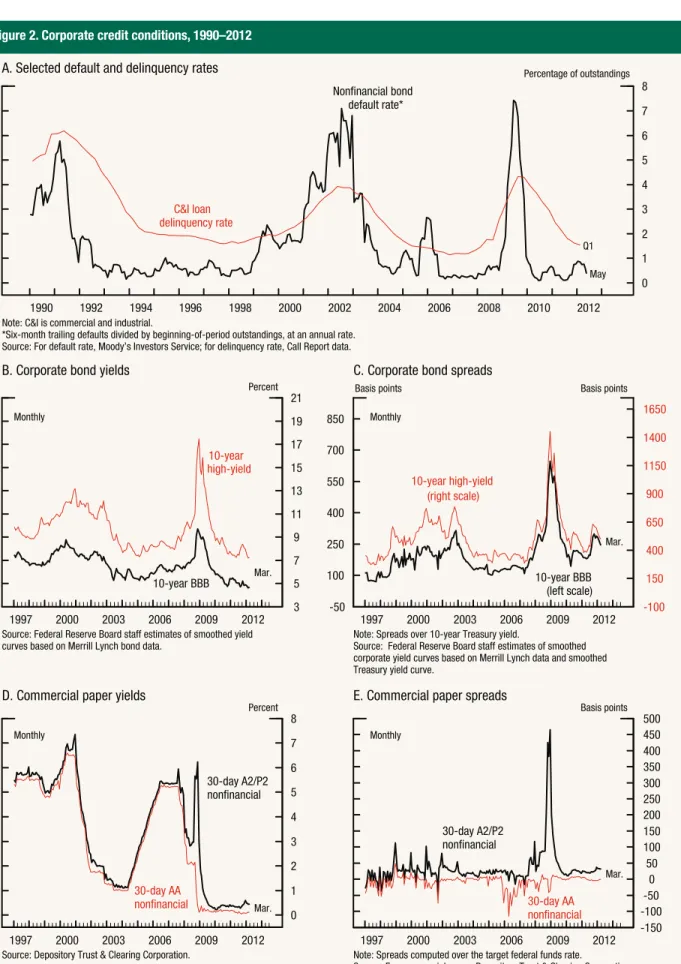
The financial crisis left a heavy imprint on the financ-ing conditions for firms in public capital markets and at banks. Default rates on corporate bonds and on commercial and industrial (C&I) loans, which had fallen to near-historical lows in 2006 and 2007, rose sharply starting in late 2008 but retraced most of their increases after 2009 (figure 2, panel A). Yields on BBB-rated and high-yield corporate bonds soared during the height of the financial crisis in late 2008 and early 2009 but fell to almost record lows in the subsequent years (figure 2, panel B). The spreads of yields on corporate bonds to those on comparable-maturity Treasury securities also rose steeply during the height of the financial crisis but declined over 2009 and have since remained a bit above pre-recession levels (figure 2, panel C). Borrowing costs for shorter-term debt issued by nonfinancial firms also increased substantially during the financial crisis. In particular, rates on commercial paper issued by
8 For an analysis of the 2007–09 financial crisis, see Bernanke
(2010).
9 Data used in this section are from the flow of funds accounts
published by the Federal Reserve Board, Consolidated Reports of Condition and Income for banks, and surveys of lenders and of small businesses. Information from the flow of funds accounts relates to organizational type rather than to size of firm. A business can be organized as a corporation (C type or S type), a proprietorship, or a partnership. Most proprietor-ships and partnerproprietor-ships are small businesses. Large, publicly traded firms are generally C corporations, which are subject to corporate income taxes and securities laws. The S type of cor-poration is designed primarily for small businesses and generally is not subject to corporate income taxes.
Figure 1. Total debt and equity of nonfinancial businesses, 1980–2012 -3 0 3 6 9 12 15 18 Percent 2012 2010 2008 2006 2004 2002 2000 1998 1996 1994 1992 1990 1988 1986 1984 1982
A. Percentage change in total debt
Q1 50 55 60 65 70 75 80 85 Percent 2012 2010 2008 2006 2004 2002 2000 1998 1996 1994 1992 1990 1988 1986 1984 1982
B. Ratio of nonfinancial business debt to gross domestic product
Q1 0 50 100 150 200 250 300 350 Billions of dollars 2012 2011 2010 2009 2008 2007 2006 2005 2004 2003 2002 2001 2000 1999 1998 1997 1996 1995
C. Equity issuance by nonfinancial U.S. firms
Total gross issuance
Private issuance* Public issuance
Q1
Note: Data are annual.
*Includes venture capital, buyouts, corporate finance, mezzanine, and other private equity investments.
Source: For panels A and B, Federal Reserve Board, flow of funds accounts; for panel C, Securities Data Company, the Private Equity Analyst, and the PricewaterhouseCoopers National Venture Capital Association MoneyTree Report.
Figure 2. Corporate credit conditions, 1990–2012 0 1 2 3 4 5 6 7 8 Percentage of outstandings 2012 2010 2008 2006 2004 2002 2000 1998 1996 1994 1992 1990
A. Selected default and delinquency rates
C&I loan delinquency rate
Nonfinancial bond default rate*
Note: C&I is commercial and industrial.
*Six-month trailing defaults divided by beginning-of-period outstandings, at an annual rate. Source: For default rate, Moody’s Investors Service; for delinquency rate, Call Report data.
May Q1 3 5 7 9 11 13 15 17 19 21 Percent 2012 2009 2006 2003 2000 1997
B. Corporate bond yields
Monthly Monthly
Monthly Monthly
10-year high-yield
10-year BBB Mar.
Source: Federal Reserve Board staff estimates of smoothed yield curves based on Merrill Lynch bond data.
-50 100 250 400 550 700 850 -100 150 400 650 900 1150 1400 1650
Basis points Basis points
2012 2009 2006 2003 2000 1997
C. Corporate bond spreads
10-year high-yield (right scale)
10-year BBB (left scale)
Mar.
Note: Spreads over 10-year Treasury yield.
Source: Federal Reserve Board staff estimates of smoothed corporate yield curves based on Merrill Lynch data and smoothed Treasury yield curve.
0 1 2 3 4 5 6 7 8 Percent 2012 2009 2006 2003 2000 1997
D. Commercial paper yields
30-day A2/P2 nonfinancial
30-day AA
nonfinancial Mar.
Source: Depository Trust & Clearing Corporation.
-150 -100 -50 0 50 100 150 200 250 300 350 400 450 500 Basis points 2012 2009 2006 2003 2000 1997
E. Commercial paper spreads
30-day A2/P2 nonfinancial
30-day AA nonfinancial
Mar.
Note: Spreads computed over the target federal funds rate. Source: For commercial paper, Depository Trust & Clearing Corporation.
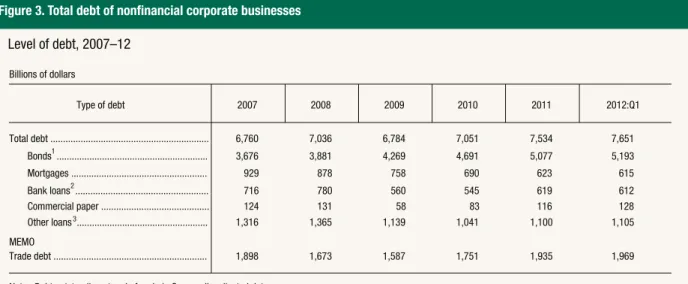
A2/P2-rated nonfinancial corporations increased sharply in 2008 but dropped in 2009 and have remained very low since then (figure 2, panel D). Similarly, the spreads of rates on A2/P2-rated com-mercial paper over the target federal funds rate moved up in 2007, skyrocketed in 2008, and retraced most of their increases in 2009 (figure 2, panel E). Nonfinancial corporate debt rose in 2007 and early 2008 and then contracted sharply during the height of the financial crisis, but it has expanded at a mod-erate pace since 2010 (figure 3). The pace of bond issuance by nonfinancial corporations, while still positive, declined sharply in the second half of 2008, but it picked up notably over the next two years, reflecting in part falling yields on corporate bonds. Commercial paper outstanding at nonfinancial firms dropped sharply in 2009 but rebounded over the next two years. In contrast, loans from banks contracted in 2009 and 2010 but have increased since then. As a result of tight lending standards and depressed real estate prices, commercial mortgage debt has declined steadily since 2007.
Financing by Small Businesses
Fully comprehensive data that directly measure the financing activities of small businesses do not exist. However, various sources of information can serve as proxies for small business activity and can be used to identify patterns of small business financing. These sources suggest that financing flows to small busi-nesses weakened considerably as a result of the finan-cial crisis and the recession, and that they have only partly recovered.
Total small business debt outstanding, estimated as the total debt of partnerships and proprietorships, increased in 2007 and for most of 2008, but it dropped from 2009 through the first half of 2011
(figure 4).10Since then, small business debt has
rebounded a bit, though at a moderate pace relative to other recent recessions. The two largest compo-nents of total small business debt are mortgage debt and loans not secured by real estate that are made by commercial banks. Bank loans extended without real estate collateral have followed a pattern similar to
that of total partnerships and proprietorships debt, falling during the financial crisis but recovering somewhat in the second half of 2011. In contrast, mortgage debt has declined since 2009 as a result of the general weakness in real estate markets. Commer-cial bank loans (both with and without real estate collateral) with principal less than or equal to $1 mil-lion, which are often extended to small firms, have also shown declines through the first half of 2011 (table 1).
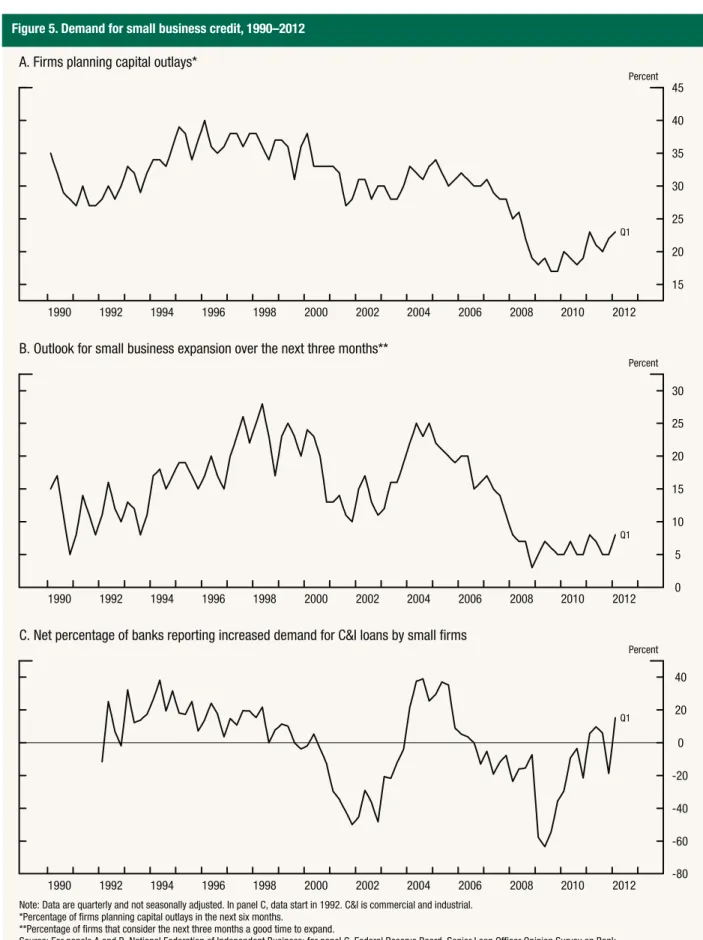
Indicators of small business financing needs suggest that demand for credit started to decline around 2006, plummeted in 2008, and has shown signs of recovery since 2010. The demand for small business financing can be inferred from small business invest-ment plans as reported in surveys conducted by the National Federation of Independent Business (NFIB).11According to the surveys, the net percent-age of firms that planned capital outlays and the net percentage that anticipated business expansions were at about their historical averages in 2005 and 2006, plummeted to record lows during the financial crisis, and have increased only slightly in recent years
(figure 5). Data on demand for C&I loans, as
reported in the Federal Reserve Board’s Senior Loan Officer Opinion Survey on Bank Lending Practices (SLOOS), show a similar decline during the financial crisis but suggest a somewhat stronger recovery after the recession.12
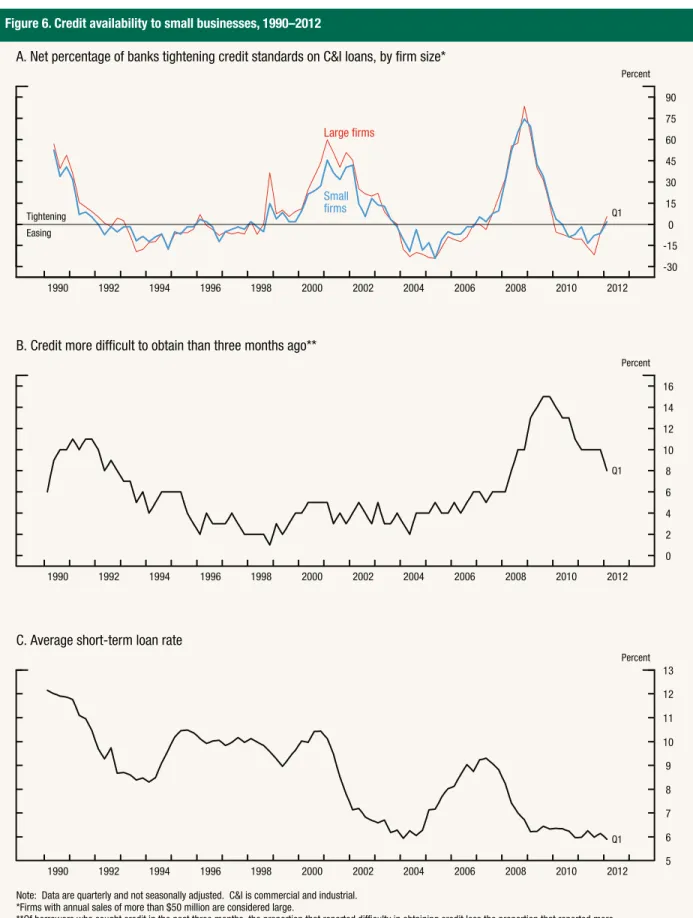
Credit conditions for small business lending by banks became substantially tighter during the financial cri-sis but have eased notably since 2010. Results from the SLOOS indicate that lending standards for small borrowers tightened substantially in 2008 and 2009 but loosened in 2010 and 2011 (figure 6). The net percentage of NFIB respondents reporting that credit had become more difficult to obtain, which had remained low by historical standards in the years prior to the financial crisis, rose in 2008 and reached its highest levels on record in 2009. Since then, it has retraced a good portion of its increases during the financial crisis, as the average short-term interest rate paid by NFIB respondents decreased from about
10In this section, data on partnerships and proprietorships are
from the flow of funds accounts published by the Federal Reserve Board, and total small business debt is approximated by unincorporated nonfinancial business debt from the flow of funds accounts. These data may include some large proprietor-ships and partnerproprietor-ships, which would not be considered small businesses.
11Each month, the NFIB polls a random sample of its members
to assess business conditions and the availability of credit for small businesses. For the first month of each quarter, roughly 11,000 firms receive questionnaires, and about 2,000 typically respond; for the remaining two months of each quarter, about 4,000 questionnaires are mailed, with around 800 responses. About 90 percent of the respondents have fewer than 40 employees.
12The SLOOS is available on the Federal Reserve Board’s website
atwww.federalreserve.gov/boarddocs/SnLoanSurvey. 8 Availability of Credit to Small Businesses
Figure 3. Total debt of nonfinancial corporate businesses Level of debt, 2007–12 2007 2008 2009 2010 2011 2012:Q1 Type of debt Billions of dollars Total debt ... Trade debt ... Bonds ... Mortgages ... Bank loans ... Commercial paper ... Other loans ... 1 2 3 3,676 929 716 124 1,316 6,760 1,898 3,881 878 780 131 1,365 7,036 1,673 4,269 758 560 58 1,139 6,784 1,587 4,691 690 545 83 1,041 7,051 1,751 5,077 623 619 116 1,100 7,534 1,935 5,193 615 612 128 1,105 7,651 1,969 MEMO
Note: Debt outstanding at end of period. Seasonally adjusted data.
1 Industrial revenue bonds and corporate bonds. 2 Extended without real estate as collateral.
3 Loans from finance companies and all other nonmortgage loans that are not extended by banks.
Source: Federal Reserve Board, flow of funds accounts.
-32 -28 -24 -20 -16 -12 -8 -4 0 4 8 12 16 20 24 28 32 36 Percent 2012 2010 2008 2006 2004 2002 2000 1998 1996 1994 1992 1990 1988 1986 1984 1982
Growth rates of bank loans and total debt for nonfinancial corporate businesses, 1980–2012 Annual
Total
Bank loans
Q1
Note: The shaded bars indicate periods of business recession as defined by the National Bureau of Economic Research. Source: Federal Reserve Board, flow of funds accounts.
Figure 4. Total debt of partnerships and proprietorships Level of debt, 2007–12 2007 2008 2009 2010 2011 2012:Q1 Type of debt Billions of dollars Total debt ... Trade debt ... Mortgages ... Bank loans ... Other loans ... 1 2 3,775 2,593 882 165 379 4,093 2,764 1,000 177 367 3,959 2,755 884 172 370 3,762 2,621 815 177 355 3,773 2,585 866 177 356 3,784 2,569 895 178 357 MEMO
Note: Debt outstanding at end of period.
1 Extended without real estate as collateral.
2 Loans from finance companies and all other nonmortgage loans that are not extended by banks.
Source: Federal Reserve Board, flow of funds accounts.
-12 -8 -4 0 4 8 12 16 20 24 28 32 36 Percent 2012 2010 2008 2006 2004 2002 2000 1998 1996 1994 1992 1990 1988 1986 1984 1982
Growth rates of bank loans and total debt for partnerships and proprietorships, 1980–2012 Annual
Total
Bank loans
Q1
Note: The shaded bars indicate periods of business recession as defined by the National Bureau of Economic Research. Source: Federal Reserve Board, flow of funds accounts.
9 percent in 2007 to about 6 percent in the first quar-ter of 2012.13Although credit conditions for small
firms tightened notably during the financial crisis, responses to other questions in the NFIB survey
sug-gest that small business owners have remained cau-tious. In particular, since 2008, respondents have appeared to remain more concerned about their out-look for sales than about credit conditions, as most cite weak product demand as the most significant problem they face.
13Data on small business loan prices (interest rates and fees) are
not publicly reported or widely available. Therefore, the analysis and discussion of pricing in this report are limited.
Table 1. Small business loan and microloan holdings of U.S. commercial banking organizations, by type of loan, 2007–11
Size of loan and year All Commercial and
industrial
Nonfarm nonresidential
real estate
Small business loans ($1 million or less)
Amount outstanding, June 30 (billions of dollars)
2007 595.8 275.5 320.4 2008 616.1 286.4 329.7 2009 604.2 274.0 330.2 2010 568.9 266.2 302.8 2011 529.7 241.4 288.3 Change1(percent) 2008 3.4 4.0 2.9 2009 -1.9 -4.3 .2 2010 -5.8 -2.9 -8.3 2011 -6.9 -9.3 -4.8 Microloans ($100,000 or less)
Amount outstanding, June 30 (billions of dollars)
2007 124.4 99.1 25.3 2008 136.7 111.9 24.8 2009 128.5 104.5 24.0 2010 130.5 110.5 20.0 2011 111.2 93.3 17.9 Change1(percent) 2008 9.9 12.9 -1.9 2009 -6.0 -6.7 -3.1 2010 1.6 5.8 -16.6 2011 -14.8 -15.6 -10.7
Note: Small business loans are business loans of $1 million or less; microloans, a subset of small business loans, are for $100,000 or less. U.S. commercial banking organizations are insured U.S. domestically chartered banks excluding credit card institutions and U.S. branches and agencies of foreign banks. Details many not sum to totals because of rounding.
1 Change is measured from June of the preceding year to June of the year indicated. Source: Call Reports (June 30), various years.
Figure 5. Demand for small business credit, 1990–2012 15 20 25 30 35 40 45 Percent 2012 2010 2008 2006 2004 2002 2000 1998 1996 1994 1992 1990
A. Firms planning capital outlays*
Q1 0 5 10 15 20 25 30 Percent 2012 2010 2008 2006 2004 2002 2000 1998 1996 1994 1992 1990
B. Outlook for small business expansion over the next three months**
Q1 -80 -60 -40 -20 0 20 40 Percent 2012 2010 2008 2006 2004 2002 2000 1998 1996 1994 1992 1990
C. Net percentage of banks reporting increased demand for C&I loans by small firms
Q1
Note: Data are quarterly and not seasonally adjusted. In panel C, data start in 1992. C&I is commercial and industrial. *Percentage of firms planning capital outlays in the next six months.
**Percentage of firms that consider the next three months a good time to expand.
Source: For panels A and B, National Federation of Independent Business; for panel C, Federal Reserve Board, Senior Loan Officer Opinion Survey on Bank Lending Practices.
Figure 6. Credit availability to small businesses, 1990–2012 -30 -15 0 15 30 45 60 75 90 Percent 2012 2010 2008 2006 2004 2002 2000 1998 1996 1994 1992 1990
A. Net percentage of banks tightening credit standards on C&I loans, by firm size*
Large firms Small firms Tightening Easing Q1 0 2 4 6 8 10 12 14 16 Percent 2012 2010 2008 2006 2004 2002 2000 1998 1996 1994 1992 1990
B. Credit more difficult to obtain than three months ago**
Q1 5 6 7 8 9 10 11 12 13 Percent 2012 2010 2008 2006 2004 2002 2000 1998 1996 1994 1992 1990
C. Average short-term loan rate
Q1
Note: Data are quarterly and not seasonally adjusted. C&I is commercial and industrial. *Firms with annual sales of more than $50 million are considered large.
**Of borrowers who sought credit in the past three months, the proportion that reported difficulty in obtaining credit less the proportion that reported more ease in obtaining credit.
Source: For panel A, Federal Reserve Board, Senior Loan Officer Opinion Survey on Bank Lending Practices; for panels B and C, National Federation of Independent Business.
Credit Use by Small Businesses
This section examines the composition and borrow-ing behavior of small firms to identify characteristics that are associated with important patterns of credit use. It also discusses the special role that small busi-ness plays in the U.S. economy and the unique chal-lenges small firms face in obtaining credit.
Small Business: Definition and
Background
Defining what is meant by “small business” is the dif-ficult first step in conducting a policy-relevant analy-sis of the financing needs of small business. The financing needs are very different for a “mom and pop” grocery store, a microenterprise in the inner city, a start-up high-tech firm, a business that is ready to expand from early-stage growth to the next higher level, or a business that has neared the point of issu-ing public debt or equity. Yet the term “small busi-ness” encompasses all of these entities. According to a broad guideline used by the U.S. Small Business Administration (SBA), a small business is a firm or enterprise with fewer than 500 employees. This defi-nition encompasses nearly all businesses in the United States.
The U.S. Census Bureau’s County Business Patterns data indicate that there were over 7.4 million active employer establishments in March 2009.14The vast
majority of these establishments were modest in size, with more than one-half of them employing fewer than 5 employees and nearly an additional one-third employing between 5 and 19 employees. In total,
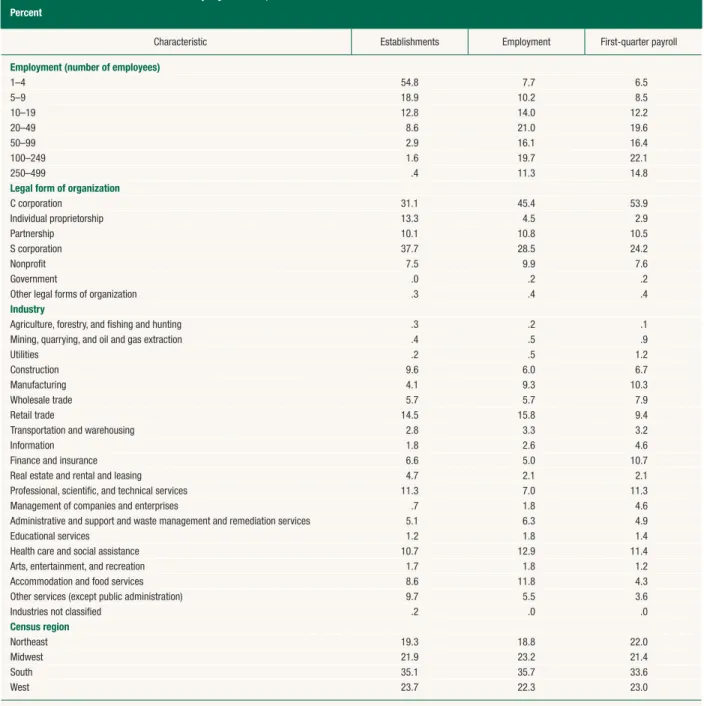
small employer establishments with fewer than 500 employees constituted 99.8 percent of all employer businesses, a fraction that is consistent with previous years (table 2).
More than one-third of small employer establish-ments were organized as S corporations (37.7 per-cent), and just under an additional one-third as C corporations (31.1 percent). The primary differ-ence between the two types of corporations is that C corporations are subject to corporate income tax, while S corporations are not. However, S corpora-tions are legally constrained to have no more than 75 shareholders; are restricted to one class of stock; and, to avoid income tax liability, must pass all income to the owners at the end of each fiscal year. The remaining small employer establishments were organized as sole proprietorships (13.3 percent), part-nerships (10.1 percent), and nonprofits (7.5 percent). Small businesses operate in every major segment of the U.S. economy. The most common industry for small employer establishments in 2009 was retail trade, which accounted for 1 out of 7 small firms. About one-half of establishments were in construc-tion, health care and social assistance, professional and technical services, accommodation and food ser-vices, and other serser-vices, each of which accounted for roughly one-tenth of small employer establishments. The remaining small establishments were principally involved in finance and insurance (6.6 percent), wholesale trade (5.7 percent), administrative support (5.1 percent), real estate and leasing (4.7 percent), manufacturing (4.1 percent), and transportation and warehousing (2.8 percent).
Geographically, small establishments were widely dis-persed throughout the nation, with 19.3 percent operating in the Northeast, 21.9 percent in the Mid-west, 23.7 percent in the West, and the remaining 35.1 percent in the South. This distribution roughly reflects the 2009 population distribution, with 18.0 percent of the population living in the North-east, 21.8 percent in the Midwest, 23.3 percent in the
14County Business Patterns data are compiled from the Business
Register, a database of all known single and multi-establishment employer companies maintained and updated by the Census Bureau. The data cover most industries, excluding crop and ani-mal production; rail transportation; national postal service; pen-sion, health, welfare, and vacation funds; trusts, estates, and agency accounts; private households; and public administration. The data also exclude most establishments reporting govern-ment employees. For more details on the data, see U.S. Census Bureau, “County Business Patterns: About the Data,” webpage, www.census.gov/econ/cbp/overview.htm.
West, and the remaining 36.9 percent in the South (U.S. Census Bureau, Population Division, 2009). Small businesses contribute significantly to the strength and vigor of the U.S. economy. Establish-ments with fewer than 500 employees accounted for nearly 80 percent of total covered sector employment and over 70 percent of first-quarter payroll.15In
addition, most large and successful companies begin as smaller firms that prosper and grow.
The concerns of the Congress and other policymak-ing bodies about small business financpolicymak-ing largely stem from the perception that small firms have more
15The data set excludes data on self-employed individuals,
employees of private households, railroad employees,
agricul-tural production employees, and most government employees. Businesses operating without an employer identification num-ber (EIN), and businesses with an EIN but without employees, are also excluded from the County Business Patterns universe.
Table 2. Characteristics of small employer firms, 2009 Percent
Characteristic Establishments Employment First-quarter payroll
Employment (number of employees)
1–4 54.8 7.7 6.5 5–9 18.9 10.2 8.5 10–19 12.8 14.0 12.2 20–49 8.6 21.0 19.6 50–99 2.9 16.1 16.4 100–249 1.6 19.7 22.1 250–499 .4 11.3 14.8
Legal form of organization
C corporation 31.1 45.4 53.9 Individual proprietorship 13.3 4.5 2.9 Partnership 10.1 10.8 10.5 S corporation 37.7 28.5 24.2 Nonprofit 7.5 9.9 7.6 Government .0 .2 .2
Other legal forms of organization .3 .4 .4
Industry
Agriculture, forestry, and fishing and hunting .3 .2 .1
Mining, quarrying, and oil and gas extraction .4 .5 .9
Utilities .2 .5 1.2
Construction 9.6 6.0 6.7
Manufacturing 4.1 9.3 10.3
Wholesale trade 5.7 5.7 7.9
Retail trade 14.5 15.8 9.4
Transportation and warehousing 2.8 3.3 3.2
Information 1.8 2.6 4.6
Finance and insurance 6.6 5.0 10.7
Real estate and rental and leasing 4.7 2.1 2.1
Professional, scientific, and technical services 11.3 7.0 11.3
Management of companies and enterprises .7 1.8 4.6
Administrative and support and waste management and remediation services 5.1 6.3 4.9
Educational services 1.2 1.8 1.4
Health care and social assistance 10.7 12.9 11.4
Arts, entertainment, and recreation 1.7 1.8 1.2
Accommodation and food services 8.6 11.8 4.3
Other services (except public administration) 9.7 5.5 3.6
Industries not classified .2 .0 .0
Census region
Northeast 19.3 18.8 22.0
Midwest 21.9 23.2 21.4
South 35.1 35.7 33.6
West 23.7 22.3 23.0
Source: Statistics calculated based on 2009 County Business Patterns data from the U.S. Census Bureau, www.census.gov/econ/cbp.
difficulty gaining access to credit sources than do large businesses or other types of borrowers. The source of this difficulty may be the greater riskiness of small firms and the associated high costs of evalu-ating and monitoring credit risks, or it may be ineffi-ciencies in markets that hinder pricing of risk or impede the effective pooling of risks. To the extent that private-market impediments or inefficiencies are the source of any difficulties for small business financing, policymakers may focus on measures that address these factors. In this case, no one policy pre-scription would likely work for all, and no one defini-tion of small business would be appropriate. As dis-cussed in this report, credit needs and borrowing sources differ widely among small businesses.
Risks of Lending to Small Businesses
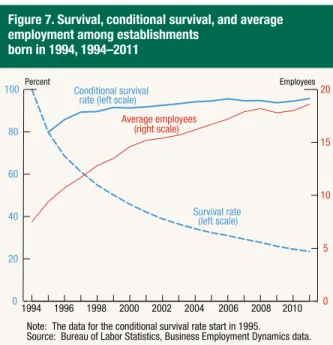
Lending to small businesses is generally considered riskier and more costly than lending to larger firms. Business Employment Dynamics data, compiled by the Bureau of Labor Statistics, provide insights into some of the risks.Figure 7depicts the survival and conditional survival rates as well as the average employment for a cohort of employer firms that were born in 1994.16Because a cohort is restricted to the
fixed group of firms initially included, the survival rate—the share of all firms that began in 1994 and
are still in business in each subsequent year—must decline over time as firms go out of business. In con-trast, the conditional survival rate—the share of firms that were in business in the previous year and continue operations in the current year—may rise or fall each year. The average employment is calculated among firms in business in each year. It, too, may rise or fall over time.
Two facets of small business dynamics can be observed in figure 7. First, the increasing average size among the surviving businesses indicates that small businesses are more apt to fail in any given year of existence than larger or growing ones. Second, the failure rate in the early years—when the firm is likely to be the smallest—is quite high relative to later years. For example, 20 percent of establishments born in 1994 failed in the first year (by 1995), but only 11 percent failed in the second. Conditional on having survived the first three years in business, more than 90 percent of establishments will continue to be in business the following year. Historically, and par-ticularly in the early life of a business, lenders have had difficulty determining the creditworthiness of applicants for small business loans. The heterogeneity across small firms, together with widely varying uses of borrowed funds, has impeded the development of general standards for assessing applications for small business loans and has made evaluating such loans relatively expensive.
Lending to small businesses is further complicated by the “informational opacity” of many such firms. Obtaining reliable information on the creditworthi-ness of a small busicreditworthi-ness is often difficult because little, if any, public information exists about the per-formance of most small businesses. Small businesses rarely have publicly traded equity or debt securities, and public information on such firms is typically sparse. Many small businesses also lack detailed bal-ance sheets and other financial information often used by lenders in making underwriting decisions. The cost to the lender does not end with the decision to grant a loan. Small business lenders typically have had to monitor the credit arrangement with indi-vidual borrowers. For very small firms, a close asso-ciation between the finances of the business and those of the owner may increase loan-monitoring costs.
Historically, the relatively elevated costs of evaluating small business applications and the ongoing costs of monitoring firm performance have made loans to
16The data in the figure are specific to establishments that first
reported having employees in 1994. The trends are similar for establishments born in later years. The 1994 cohort is used because it has the longest history available.
Figure 7. Survival, conditional survival, and average employment among establishments
born in 1994, 1994–2011 0 20 40 60 80 100 1994 1996 1998 2000 2002 2004 2006 2008 2010 0 5 10 15 20 Percent Employees Average employees (right scale) Conditional survival rate (left scale)
Survival rate (left scale)
Note: The data for the conditional survival rate start in 1995.
Source: Bureau of Labor Statistics, Business Employment Dynamics data.
small businesses less attractive for some lenders, espe-cially because, when expressed as a percentage of the (small) dollar amount of the proposed loan, these noninterest costs are often quite high compared with loans to middle-market or large corporate borrowers. Financial institutions, especially commercial banks, are believed to have an advantage in dealing with information problems. Through interactions with a firm that uses its financial services, the lending insti-tution can obtain additional information about the firm’s activities, ownership, financial characteristics, and prospects that are important in deciding whether to extend credit.17Lenders can use information
gath-ered over time through longterm relationships with business owners and other members of the local com-munity to monitor the health of the business and to build appropriate incentives into loan agreements.18
The role of relationship lending will likely continue to be significant, even as developments such as auto-mated banking, credit scoring, and bank consolida-tion influence the competitive structure of the bank-ing industry.19
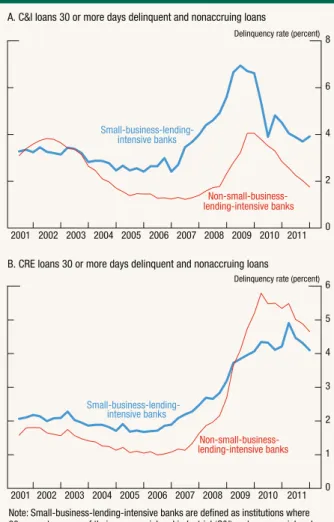
Insights on the risks of lending to small businesses may be gained by examining delinquency rates at banks that primarily do small business lending, small-business-lending-intensive (SBLI) banks. Dur-ing the recent financial crisis and ensuDur-ing recession, these risks became much more obvious as small busi-nesses struggled to keep current on their outstanding debt.Figure 8shows the delinquency rates for C&I and commercial real estate (CRE) loans for SBLI banks compared with other banks.20In the early part of the decade, delinquency rates at these SBLI banks
were similar to such rates at other banks for C&I loans. However, in 2007, delinquency rates at SBLI banks began to rise for C&I loans faster than delin-quency rates at other banks. The rate peaked at nearly 7 percent in 2009 at SBLI banks, compared with about 4 percent at other banks. Since then, the rate has come down but remains elevated and above the rate at other banks. For CRE loans, the story was slightly different. Until 2009, the delinquency rate at SBLI banks was slightly above the delinquency rate at other banks. In 2011, the delinquency rate at SBLI banks peaked slightly below the rate at other banks
17Banks typically provide multiple products to small businesses
that borrow from them. The 2003 Survey of Small Business Finances indicates that small firms that obtained at least one product at a commercial bank averaged 2.1 products at that bank. The comparable average number of products at nonbanks was 1.3. Small firms with at least one product at a bank had one or more other products at that bank almost 60 percent of the time. In contrast, more than 80 percent of small firms that had a product with a nonbank provider obtained no other products from the nonbank.
18A detailed description of the process of relationship lending
and the way it differs from nonrelationship lending is provided by Berger and Udell (2002). Boot (2000) and Berger and Udell (1998) include detailed discussions of the costs and benefits of relationship lending, including a review of the literature.
19Recent information on community banks and relationship
lend-ing is in Critchfield and others (2004) and Avery and Samolyk (2004).
20Bank Call Reports do not provide information on delinquency
rates by size of borrower or size of loan. We look at delin-quency rates on all C&I loans and all CRE loans at banks that
have a high concentration of small loans to businesses as prox-ies for performance on small C&I and small CRE loans.
Figure 8. Delinquency rates at commercial banks, 2001–11
0 2 4 6 8 Delinquency rate (percent)
2001 2002 2003 2004 2005 2006 2007 2008 2009 2010 2011
A. C&I loans 30 or more days delinquent and nonaccruing loans
Small-business-lending- intensive banks Non-small-business- lending-intensive banks 0 1 2 3 4 5 6 Delinquency rate (percent)
2001 2002 2003 2004 2005 2006 2007 2008 2009 2010 2011
B. CRE loans 30 or more days delinquent and nonaccruing loans
Small-business-lending- intensive banks
Non-small-business- lending-intensive banks
Source: The data are constructed from special tabulations of Call Reports (Consolidated Reports of Condition and Income for U.S. Banks, Schedule RC-C, Part II: Loans to Small Businesses and Small Farms) dated June 30, 2001, to December 31, 2011.
Note: Small-business-lending-intensive banks are defined as institutions where 80 percent or more of their commercial and industrial (C&I) and commercial real estate (CRE) loans have initial values of $1 million or less.
but continues to be considerably higher than pre-recession levels.
Credit Use
Up-to-date and comprehensive information about the universe of small businesses is sparse, and most evidence about financing needs and sources is derived from surveys. In light of this reality, the NFIB sponsored surveys in 2009, 2010, and 2011 to gauge the credit access of small firms during the financial crisis and ensuing economic turmoil. Each of the three NFIB samples was drawn from the Dun & Bradstreet Market Identifier File and included between 750 and 850 small employer firms. For the surveys, small employer firms were defined as firms with between 1 and 250 employees in addition to the owner(s). The samples were stratified by employment size, and weighted responses are repre-sentative of the Dun & Bradstreet population of small employer firms in the United States in 2009, 2010, and 2011.21
These three surveys quantify the use of and access to credit by small employer firms in the 12 months prior to each survey.22Respondents were asked to provide
information about their applications for and current use of four distinct types of credit: new credit lines, renewal of existing credit lines, business loans from financial institutions, and credit cards (including per-sonal cards used for business purposes). Small busi-ness owners were also asked about their real estate holdings and whether those properties are used by the business as collateral for business borrowing. Data from the NFIB surveys describe patterns of credit use by small businesses. Although credit use is ultimately the intersection of demand and supply fac-tors, it is nonetheless very useful in developing a pic-ture of the demand for credit by small businesses. The data reveal patterns at both the aggregate and firm levels. It is important to keep in mind that the surveys are not following the same firms in each year, so it is not possible to say what happened to the credit demand and use of aparticularfirm over time,
but it is possible to say what happened to the credit demand and use of a representativesampleof small firms over time.23
Types of Credit Used
Small businesses use a variety of types of credit to fulfill their financial needs, including loans taken down under lines of credit, other term loans, trade credit, and credit cards. Patterns for each product are discussed here.
Credit Lines
Credit lines were more commonly used than term loans by small businesses in each year, with just under one-half of firms reporting having such a line
(table 3). Between 2009 and 2011, the fraction of
firms with lines of credit varied little. Among firms with at least one line of credit, the median firm had a single line. The average number of lines per firm steadily increased from 1.4 in 2009 to 1.7 in 2011. Substantial variation exists in the use of credit lines by size of firm. Roughly one-third of the firms with fewer than two employees reported using a line of credit in each year, compared with two-thirds of firms with at least 50 employees. The usage pattern by size holds up over time, but usage rates are a bit higher in 2010 than in either 2009 or 2011.
The usage pattern by age of firm is less clear. In gen-eral, usage seems to increase until the firm reaches 10 to 20 years old, and then holds steady or drops off slightly. Between 2009 and 2011, an increasing frac-tion of older firms had lines of credit. For example, 48.4 percent of firms 30 or more years old had a line of credit in 2009, while 64.6 percent of them did so in 2011. The same is not true of the youngest firms, whose usage peaked in 2010. For all but the oldest firms, the average number of lines was highest in 2011 among firms with at least one line of credit. Credit line usage by industry over this period reveals no obvious pattern. In 2009, firms in “other” indus-tries were most likely to use lines of credit, with nearly 6 out of 10 such firms reporting having at least one line of credit. This fraction falls over time to 4 out of 10 in 2011. The next most frequent users in 2009 were construction and manufacturing firms, with one-half of firms in both industries reporting having lines of credit. However, their paths go in
21For more information on the 2009, 2010, and 2011 surveys, see
Dennis (2010), Dennis (2011), and Dennis (2012), respectively.
22Each of the surveys was conducted in the fourth quarter of the
year, so the reference period was the first three quarters of the survey year and the last quarter of the prior year. For ease of exposition, this report will refer to the period with the year of the survey. Figures reported in this report are calculated from the microdata provided by the NFIB.
23A portion of the differences in patterns observed across the
three years of data may be attributable to sampling variability.
opposite directions over time. While an increasing fraction of manufacturing firms report lines of credit in 2010 and 2011, the opposite is true of construction firms. This divergence is likely partially attributable to difficulties in the housing market, which employs a fair share of small construction firms. Five out of 10 firms in professional services and 4 out of 10 firms in nonprofessional services report having lines of credit in 2009. Over time, increasing fractions of firms in professional services and decreasing frac-tions of firms in nonprofessional services report hav-ing lines of credit. Over two-fifths of firms in whole-sale and retail trade and one-third of firms in finance and real estate have lines of credit in 2009; in 2011, one-half of firms in wholesale and retail trade and two-fifths of firms in finance and real estate have them.
The surveys do not provide information on either the size of the line of credit or the amount by which the line has been taken down.
Business Loans
Business loan usage trended down between 2009 and 2011. In 2009, nearly 36 percent of small employer firms reported that they had at least one business loan; in 2011, less than 30 percent of such firms so reported (table 4). This overall trend is not consistent when looking at firms according to size, age, and industry.
The more employees a firm has, the more likely it is to have at least one business loan. For example, in 2009, roughly 1 in 5 of the smallest firms reported having a business loan, compared with nearly 1 in 2 of the largest firms. The number of loans also varied substantially, with the number generally increasing with the size of the firm. Over the recent period, business loans generally became less common among the smallest firms and more common among the largest firms.
Table 3. Use of credit lines, 2009–11
Category of firm
2009 2010 2011
Percent that use a credit line
Number of lines among
firms with a credit line Percent that use a credit line
Number of lines among
firms with a credit line Percent that use a credit line
Number of lines among firms with a credit line
Mean Median Mean Median Mean Median
All firms 45.6 1.4 1 46.8 1.5 1 45.4 1.7 1 Number of employees 0–1 33.8 1.5 1 39.0 1.3 1 33.7 1.9 1 2–4 39.6 1.2 1 43.5 1.4 1 43.7 1.5 1 5–9 53.5 1.6 1 42.4 1.8 1 56.3 2.3 1 10–19 57.3 1.7 1 59.3 1.5 1 44.1 1.4 1 20–49 66.0 1.5 1 68.6 1.6 1 56.7 1.5 1 50–250 71.2 1.6 1 76.6 1.6 1 65.4 1.8 1
Age groups (years)
Less than 4 30.6 1.4 1 37.5 1.6 1 26.0 1.8 1 4–6 41.8 1.4 1 30.4 1.2 1 47.3 1.4 1 7–9 46.7 1.4 1 42.2 1.3 1 53.1 2.1 1 10–14 51.7 1.6 1 50.8 1.4 1 38.0 2.4 1 15–19 48.0 1.5 1 53.0 1.6 1 59.2 1.7 1 20–29 46.6 1.4 1 51.4 1.5 1 53.2 1.8 1 30 or more 48.4 1.4 1 49.0 1.6 1 64.6 1.4 1 Industry
Construction and mining 51.6 1.5 1 47.1 1.7 1 45.5 2.5 1
Manufacturing 51.6 1.3 1 51.8 1.2 1 63.6 1.1 1 Wholesale/retail trade 44.3 1.5 1 51.6 1.4 1 49.9 1.5 1 Finance/real estate 33.0 1.3 1 43.3 1.7 1 39.6 2.8 1 Nonprofessional services 41.1 1.4 1 41.6 1.5 1 35.4 1.8 1 Professional services 49.0 1.6 1 47.5 1.4 1 53.0 1.3 1 Other 58.1 1.4 1 44.8 1.6 1 41.1 1.4 1
Note: Data are representative of small employer firms with 1 to 250 employees in addition to the owner(s) in the year of the survey. Source: National Federation of Independent Business, annual finance surveys of 2009, 2010, and 2011.
By age, there is roughly an inverted-U-shaped pat-tern, with use being lowest among the youngest firms, increasing as firms age, and dropping off among the oldest firms. As firms age and grow, the need for business loans may increase, which may reflect a life-cycle growth pattern; once firms get to a certain age, most have reached their optimal size and have less need for loans to grow and expand. Over the recent period, usage rates fluctuated significantly by age of firm. For example, 20.4 percent of the youngest firms reported having a business loan in 2009; this proportion increased to 36.2 percent in 2010 and then fell to 14.5 percent in 2011. In con-trast, 32.1 percent of firms aged 15 to 19 reported having a business loan in 2009; this proportion increased to 41.5 percent in 2010 and then fell back some to 37.7 percent in 2011.
Business loan usage varies substantially by industry. In 2009, business loan usage was lowest among firms in professional services (26.7 percent) and highest among firms in manufacturing (55.4 percent). While
usage remained fairly constant for firms in profes-sional services, the share of manufacturing firms using business loans decreased markedly from 2009 to 2011, with only 29.2 percent of manufactur-ing firms reportmanufactur-ing havmanufactur-ing a business loan in 2011. Although not as large as the decline among manufac-turing firms, a decrease in the share of firms in con-struction and nonprofessional services that reported having business loans between 2009 and 2011 was also observed.
Alternatives to Traditional Credit
Small business owners may turn to alternative forms of credit if they find themselves unable to obtain tra-ditional forms or if they find the terms of these other products more favorable. Two such alternatives— credit cards and trade credit—can be examined using data from the 2009–11 NFIB surveys. These widely used alternative forms of credit may be important both in financing small businesses and, as substitute products, in influencing the demand for traditional
Table 4. Use of business loans, 2009–11
Category of firm
2009 2010 2011
Percent that use a business loan
Number of loans among
firms with a business loan Percent that use a business loan
Number of loans among
firms with a business loan Percent that use a business loan
Number of loans among firms with a business loan
Mean Median Mean Median Mean Median
All firms 35.9 1.9 1 31.4 2.0 1 29.1 2.0 1 Number of employees 0–1 21.6 1.8 1 13.0 1.7 1 15.7 1.8 2 2–4 34.3 1.6 1 32.6 1.4 1 23.4 1.6 1 5–9 45.1 1.9 1 34.5 2.5 2 36.6 2.5 1 10–19 45.3 2.4 2 41.9 2.1 1 42.0 1.8 1 20–49 45.9 1.9 1 49.4 2.6 2 51.0 2.2 2 50–250 48.0 4.6 3 51.3 3.0 2 56.8 3.0 2
Age groups (years)
Less than 4 20.4 1.6 1 36.2 1.4 1 14.5 1.5 1 4–6 34.7 1.5 1 23.8 1.8 1 25.9 1.9 1 7–9 38.2 1.8 1 26.9 2.5 2 39.6 1.9 1 10–14 39.9 1.8 1 36.2 1.9 1 35.8 2.6 1 15–19 32.1 2.9 2 41.5 1.6 1 37.7 2.2 1 20–29 44.4 1.9 1 29.2 1.9 2 32.0 2.0 2 30 or more 36.3 2.2 2 29.4 2.5 1 37.8 2.2 1 Industry
Construction and mining 38.2 3.2 1 36.8 1.9 1 30.8 2.5 2
Manufacturing 55.4 2.3 2 45.8 1.7 1 29.2 2.9 2 Wholesale/retail trade 30.1 1.6 1 30.1 1.6 1 28.8 1.6 1 Finance/real estate 33.7 1.9 1 25.0 2.5 2 28.3 3.6 2 Nonprofessional services 39.8 1.6 1 37.6 1.9 1 27.8 1.9 1 Professional services 26.7 1.8 2 24.8 1.9 1 26.2 1.5 1 Other 40.0 1.8 1 26.7 3.1 2 35.3 1.9 2
Note: Data are representative of small employer firms with 1 to 250 employees in addition to the owner(s) in the year of the survey. Source: National Federation of Independent Business, annual finance surveys of 2009, 2010, and 2011.
credit by small firms. According to the NFIB surveys, just under 60 percent of small firms used a credit line or business loan in each year, but just under 90 per-cent used a credit card or trade credit.
Credit Cards
Credit cards can serve as a convenient alternative to paying expenses by cash or check if a business pays balances on time and in full each month. They can also be a substitute for traditional forms of credit when balances are carried month to month. Survey evidence from earlier periods suggests that credit cards are used primarily for convenience.24
Credit cards used for business purposes can be issued to the firm itself (business cards) or to the owners of the firm (personal cards).Table 5shows the percent-age of small businesses that used personal credit cards, business credit cards, or either personal or business credit cards to pay for business expenses in 2009, 2010, and 2011.25The fraction of firms that
use either a personal or business card declined some-what over this period but remained near 80 percent in 2011. There seems to be a slight decline in the frac-tion using business cards and a slight increase in the fraction using personal cards. This decline in business
24Data from the 1998 and 2003 Surveys of Small Business
Finances indicate that in 1998, 76 percent of small businesses that used either business or personal credit cards paid off their
balances each month; in 2003, this figure was 70.7 percent. For more information, see Mach and Wolken (2006) and Bitler, Robb, and Wolken (2001).
25Detailed usage information is not available for 2009 due to an
error in the questionnaire pattern that caused cell sizes to be very small and detailed statistics to be unreliable.
Table 5. Use of credit cards, 2009–11
Category of firm
2009 2010 2011
Percent that use a credit card, by type of card
Percent that use a credit card, by type of card
Percent that use a credit card, by type of card
Personal credit card for
business purposes Business credit card Personal or business credit card Personal credit card for
business purposes Business credit card Personal or business credit card Personal credit card for
business purposes Business credit card Personal or business credit card All firms 40.3 63.8 82.7 39.7 57.5 76.1 43.5 58.8 79.1
Share of card users that carry a balance 26.1 18.3 n.a. 24.8 22.6 n.a. 32.2 20.3 n.a.
Number of employees 0–1 n.r. n.r. n.r. 42.9 42.9 70.1 44.9 55.1 77.5 2–4 n.r. n.r. n.r. 43.5 53.6 73.2 45.5 53.9 77.8 5–9 n.r. n.r. n.r. 34.5 66.9 80.6 45.8 66.2 83.1 10–19 n.r. n.r. n.r. 31.4 71.0 82.4 36.4 63.2 79.3 20–49 n.r. n.r. n.r. 34.6 73.5 84.5 39.7 66.0 79.2 50–250 n.r. n.r. n.r. 39.2 75.2 88.7 29.9 74.9 83.2
Age groups (years)
Less than 4 n.r. n.r. n.r. 24.0 49.3 64.0 39.3 51.8 71.7 4–6 n.r. n.r. n.r. 25.5 59.1 72.7 44.1 60.0 78.2 7–9 n.r. n.r. n.r. 41.8 60.5 78.7 54.3 57.9 84.4 10–14 n.r. n.r. n.r. 43.4 54.3 76.1 38.2 63.7 83.4 15–19 n.r. n.r. n.r. 43.5 61.4 80.4 49.5 68.2 85.6 20–29 n.r. n.r. n.r. 43.3 56.2 78.6 49.3 56.7 85.5 30 or more n.r. n.r. n.r. 43.0 62.9 77.3 39.7 61.8 76.7 Industry
Construction and mining n.r. n.r. n.r. 40.3 63.3 78.2 47.0 69.8 87.5
Manufacturing n.r. n.r. n.r. 43.0 75.0 86.5 39.1 72.5 85.3 Wholesale/retail trade n.r. n.r. n.r. 34.1 52.5 69.6 43.9 65.6 83.6 Finance/real estate n.r. n.r. n.r. 44.6 69.6 84.6 33.6 57.7 74.6 Nonprofessional services n.r. n.r. n.r. 35.6 43.9 67.5 49.0 51.3 76.7 Professional services n.r. n.r. n.r. 43.0 63.3 84.3 42.5 58.2 78.6 Other n.r. n.r. n.r. 45.4 55.2 74.3 41.8 49.7 71.8
Note: Data are representative of small employer firms with 1 to 250 employees in addition to the owner(s) in the year of the survey. n.a. Not available.
n.r. Not reliable. Due to a skip-pattern problem in the administration of the 2009 questionnaire, detailed statistics on the use of credit cards by firm category are not reliable. Source: National Federation of Independent Business, annual finance surveys of 2009, 2010, and 2011.