MPRA
Munich Personal RePEc Archive
Charter Value and Risk-taking: Evidence
from Indian Banks
Saibal, Ghosh
Reserve Bank of India
01. August 2009
Online at
http://mpra.ub.uni-muenchen.de/19543/
Charter Value and Risk‐taking:
Evidence from Indian Banks
Saibal
Ghosh
1. Introduction
A central problem with banks is that of moral hazard: with deposit rates being
less responsive to bank risk‐taking owing to deposit insurance, banks could be tempted
to lower capital asset ratios and increase asset risk, thereby increasing the probability of
default and extracting wealth from the deposit insurance system.
However, the prediction of moral hazard theory that banks assume extreme risks
contrasts with the behavior of banks in real world. First, banks typically hold capital
buffer in excess of the regulatory minimum capital requirements. And second, the
majority of banks seem to have a low probability of default and therefore, they extract
virtually no wealth from the deposit insurance system.
These findings have inspired the literature to search for an incentive that could
moderate the moral hazard behavior of banks. Such an incentive has been found in
banks charter value (Marcus, 1984). The charter value is the net present value of future
rents. This value would be lost in case of bankruptcy and hence, represents the bank’s
private cost of failure. In case of over‐extension by a bank, equity holders can sell their
shares, putting pressure on share prices and placing bank management under increased
scrutiny. Therefore, charter value is also referred to as self‐discipline in the literature
(Agusman et al., 2006).
An increasing number of articles have examined the disciplining effect of charter
value on banks’ risk‐taking, which is measured either as default risk, asset risk or
leverage risk. Keeley (1990) finds that US banks with higher charter value have a low
leverage risk (measured as capital to asset ratio on a market‐value basis) and lower
default risk, as reflected in lower risk premia on large, uninsured CDs. Demsetz et al.
‐‐2‐‐
measure of default being based on banks’ stock return volatility. Gropp and Vesala
(2004) uncover evidence that EU banks with higher charter values have lower leverage
risk (defined as book value of liabilities over market value of assets). More recent
evidence for US banks also confirms the disciplining effect of charter value (Furlong and
Kwan, 2005).1
In addition to examining the nexus between charter value and bank risk, the
literature has also studied the effect of competition on charter value. Hellmann et al
(2000) present a theoretical model which shows that if competition erodes the bank’s
charter value, banks decrease capital‐to‐asset ratios and increase asset risk. Keeley (1990)
provides empirical evidence supporting this hypothesis: the liberalization of branching
restrictions and multi‐bank holding company expansion laws in US had a negative effect
on banks’ charter value. The conclusion reached veers towards the view that increased
competition diminishes charter value.
A number of factors make the banking sector in India an interesting case to study
the interlinkage between bank risk and charter value. First, over the 1990s, India has
undergone liberalization of the banking sector with the objective of enhancing efficiency,
productivity and profitability (Government of India, 1991). Second, the banking sector
witnessed important transformation, driven by the need for creating a market‐driven,
productive and competitive economy in order to support higher investment levels and
accentuate growth’ (Government of India, 1998). Third, most studies on charter value
pertain to developed country markets (Keeley, 1990; Gropp and Vesala, 2004; Furlong
and Kwan, 2005). The issue as to the interplay between charter value and bank risk in
emerging markets as India where the financial system is pre‐dominantly bank‐based
and government‐owned remains a moot issue. Fourth, in tandem with the process of
financial sector reforms, the capital base of state‐owned banks has been broad‐based
1 Another strand of the literature argues that depositor discipline is a useful alternate to curb bank risk‐taking, since banks
perceived to be risky from the depositors’ standpoint would pay higher deposit interest rates. Evidence on this count suggest that banks hold adequate capital buffers to compensate for possible risk of default (Nier and Baumann, 2006). More recently, Ghosh (2008) finds that charter value, depositor discipline and bank risk‐taking are intertwined: whereas charter value is a nonlinear determinant of market discipline, the latter is found to positively impact charter value. Additionally, higher risk‐taking is found to exert a weakening effect on market discipline.
‐‐3‐‐
through infusion of equity capital from the market, while still retaining majority
government holding, a process commonly referred to as equity privatization (Boubakri et
al., 2005). The issue as to whether such privatizations impact charter value is as yet an
unexplored aspect and is empirically explored in the paper. Finally, prudential norms in
India have gradually been brought on par with international best practices. Therefore,
whether and as to how regulatory changes impact charter value in an emerging
economy remains an interesting topic of empirical research. The findings so obtained
may have implications for the design of regulatory policies in other emerging
economies.
The present article contributes to the empirical literature in several distinct ways.
First, it is perhaps the first study to explore the interlinkage between charter value and
bank risk‐taking for India. Second, in addition to investigating the disciplining effect of
charter value on banks’ risk taking, we also examine the determinants of charter value,
placing a particular emphasis on competition. To do so, we use a two‐step approach. In
the first‐step, we regress banks’ charter value on bank‐specific variables approximating
the degree of competition. In the second step, we regress banks’ risk‐taking on charter
value. Hence, this approach models the link between competition and banks’ charter
value explicitly. Finally, in addition to conventional measures of risk, we employ an
accounting measure of the distance to default, the Z‐score (Furlong and Kwan, 2005;
Mercieca et al, 2007). 2 Since the number of standard deviations that an institution is
away from risk can measure insolvency risk, we also employ the Z score to assess the
insolvency risk.3
The reminder of the article continues as follows. Section 2 provides an overview
of Indian banking. Section 3 describes the empirical model and the methodology. The
variable definitions and their expected effect on risk‐taking are provided in Section 4,
followed by the data (Section 5) and results (Section 6). The final section concludes.
2 De Nicolo (2000) employs the term ‘insolvency risk’ instead of Z‐score.
3
Let μ ≡ expected earnings, σ ≡ standard deviation and k ≡ capital to asset. Then Z‐score≡(k+μ)/σ is the number of standard deviation below the mean earnings that just wipes out capital. A higher Z score indicates improved risk‐ adjusted performance.
‐‐4‐‐
2. Indian banking sector: An overview
The Indian banking system is characterized by a large number of banks with
mixed ownership1. The commercial banking segment presently comprises 28 public
sector banks in which Government has majority ownership of over 51%, 27 private
sector banks and 29 foreign banks. Total bank assets constituted a little over 80% of GDP
in 2005‐06. Public sector banks had roughly three‐quarter share in the assets of the
banking system in 2005‐06, while private and foreign banks constituted the remaining.
In 1991, public sector banks share in the total assets of the banking system was over 90%.
Prior to the initiation of financial sector reforms in 1992, the Indian financial
system essentially catered to the needs of planned development where the Government
sector had a predominant role in every sphere of economic activity. The pre‐emption of
a large proportion of bank deposits in the form of reserves and an administered interest
rate regime resulted in high cost and low quality financial intermediation. The existence
of a complex structure of interest rates arising from economic and social concerns of
providing concessional credit to certain sectors resulted in cross subsidization, which
implied that higher rates were charged from non‐concessional borrowers. The system of
administered interest rates was characterized by detailed regulatory prescriptions on
lending and deposit, leading to a multiplicity of interest rates. As a result, the spreads
between deposit and lending rates of commercial banks increased, while the
administered lending rates did not factor in credit risk. The lack of recognition of the
importance of transparency, accountability and prudential norms in the operations of
the banking system led also to a rising burden of non‐performing assets. On the
expenditure front, inflexibility in licensing of branches and management structures
constrained the operational independence and functional autonomy of banks and raised
overhead costs. The environment in the financial sector during this period was
characterized by segmented and underdeveloped financial markets. This resulted in
‐‐5‐‐
The period 1992‐97 laid the foundations for reforms in the banking system. It
witnessed the implementation of prudential norms pertaining to capital adequacy,
income recognition, asset classification, provisioning and exposure norms. While these
reforms were being implemented, the world economy also witnessed significant
changes, ‘coinciding with the movement towards global integration of financial services’
(Government of India, 1998). Against such backdrop, a second Government‐appointed
Committee on banking sector reforms provided the blueprint for the current reform
process (Government of India, 1998).
Critical and noteworthy reforms in the financial system during the reform period
included (Bhide et al., 2001; Mohan, 2004; Reddy, 2006):
(a) Lowering of statutory reserve requirements from their erstwhile high levels;
(b) Liberalizing the interest rate regime, allowing banks the freedom to choose their
deposit and lending rates;
(c) Infusing competition by allowing more liberal entry of foreign banks and
permitting the establishment of new private banks;
(d) Introducing micro‐prudential measures (capital adequacy requirements, income
recognition, asset classification and provisioning norms for loans, exposure norms,
accounting norms);
(e) Diversifying ownership of public sector banks by enabling the state‐owned
banks to raise up to 49 per cent of their capital from the market. Nineteen state‐owned
banks accessed the capital market and raised around Rs 110 billion till end‐March 2006.
As a consequence of the reforms, the share of public sector banks in total assets
of the banking system reduced from 90% to less than 75% between 1991 and 2006. The
five bank asset concentration ratio declined from 0.51 in 1991‐92 to 0.44 in 1995‐96 and
thereafter to 0.42 in 2005‐06 (Table 1).
‐‐6‐‐
Table 1: Summary of the banking industry: 1990‐91 to 2005‐06
Year / Bank Group
1990‐91 1996‐97 2005‐06
SOB Pvt. Forgn. SOB Pvt. Forgn. SOB Pvt. Forgn.
No. of banks 28 25 23 27 34 42 28 28 29
Total asset 2929 119 154 5563 606 561 20149 5716 1994
Total deposit 2087 94 85 4493 498 373 16225 4285 1137
Total credit 1306 50 51 2202 281 265 11063 3130 976
Credit‐deposit ratio 0.63 0.52 0.60 0.49 0.56 0.71 0.68 0.73 0.86
Share (in per cent)
Total asset 92 4 4 83 9 8 72 21 7 Total deposit 92 4 4 84 9 7 75 20 5 Total credit 93 4 3 80 10 10 73 21 6 Total income 246 11 15 536 74 76 1598 433 177 of which: interest income 239 9.3 12.7 465 64 62 1379 352 123 Total expenditure 241 10.7 13 540 61 56 1432 383 146 of which: interest expenses 183 6.3 8.9 309 31.7 32 805 215 51 Net profit 5 0.3 2 71 13 20 165 50 46 Amount in Rs. billion
SOB. State‐owned Banks; Pvt. Private Sector Banks; Forgn: Foreign Banks Source: RBI
3. Empirical specification
The econometric analysis proceeds in two stages. First, it examines the effect of
banks’ charter value on their risk‐taking behavior, appropriately taking on board the
Indian market realities. And second, it analyzes the determinants of banks’ charter value
and hence, the factors that ultimately drive banks’ risk‐taking. Accordingly, we employ
a two‐stage regression procedure: where the determinants of charter value are studied
(step 1) and subsequently, the impact of charter value on banks’ risk‐taking (step 2) is
examined.
Since the charter value of banks mirrors market power, which is built up over
several periods, we employ a dynamic specification for bank i at time t as given by (1):
t i t i t i o t i
q
X
u
q
,=
α
+
α
1 ,−1+
,β
+
, (1)where q is the charter value of the bank, X is a vector of bank‐specific and
macroeconomic variables. The error term is assumed to comprise of a bank‐specific
component μi and white noise, εi,t, such that ui,t= μi + εi,t where μi ~IID (0, σu2) and εi ~IID
‐‐7‐‐ In the second stage, we regress banks’ risk‐taking on their charter value and a set
of controls. As banks may adjust risk over several periods, the following specification is
postulated as given by (2): t i t i t i t i o t i
RISK
q
Z
w
RISK
3 , , ^ , 2 1 , 1 ,=
γ
+
γ
−+
γ
+
γ
+
(2) where RISK is the measure of bank risk,^
q
(q‐hat) is the predicted charter value asobtained from (1), Z is a vector of bank‐specific control variables. The error term, as
earlier, is assumed to comprise of a bank‐specific component ηi and white noise, νi,t, such
that wi,t= ηi + νi,t where ηi ~IID (0, ση2) and νi ~IID (0, σν2), independent of each other and
among themselves. In order for bank charter value to discipline bank risk taking,
charter value in (2) is expected to have a positive effect on BUF, CAP, LLP and Z‐score
and a negative effect on NPL and RISK.
In the first step, we test whether more efficient banks have higher charter value
and whether banks generate rents in the deposit or loan market. The main hypothesis is
that competition decreases banks’ charter values. Therefore, taking as null the
hypothesis that competition does not affect banks’ charter value, we test the following
hypothesis:
H1: Competition has a negative effect on banks’ charter value
Besides, following from our previous discussion, we also test the following
hypothesis.
H2: Tightening of prudential regulations has a negative effect on banks’ risk taking.
With respect to the second‐step regressions, we test whether charter value has a
moderating effect on banks’ risk‐taking behavior. In line with the empirical literature
(Keeley, 1990; Gropp and Vesala, 2004), we test whether banks with higher charter
‐‐8‐‐
asset risk. Hence, taking as the null hypothesis that charter value does not have an effect
on banks’ capital and asset risk, we test the following hypothesis:
H3: Banks charter value has a positive (negative) effect on capital (asset risk)
Since several state‐owned banks have been privatized at different time points
over the sample period, we examine whether the process of partial privatization has had
any impact on bank charters. To the extent that induction of private shareholding has
implications for shareholders’ values, such as market capitalization, representation on
the board and interests of minority shareholders, it seems likely that such a process
would tend to contain bank risk taking. This leads to the following hypothesis for state‐
owned banks:
H4: The extent of partial privatization has a salutary effect on banks’ risk taking
Given the empirical model in (1) and (2), we employ dynamic panel data
techniques that control for bank‐specific effects μi and ηi . We present only the two‐step
GMM estimates, since they are asymptotically more efficient. Finally, as bank’s charter
value may be endogenous, we use the GMM‐style instruments for q. The first‐step
regressions justify this procedure, as lagged q is found to be significant in the regression
for qi. Hence, lagged levels of qi contain information on qi and can serve as instruments
for qi.
4. Variables and methodology
In the present analysis, a bank’s charter value (CV) is defined as the net present
value of future rents that a bank earns while in business. Definitionally, it equals the
market of a bank’s assets minus its replacement cost. We take the aggregate of market
value of equity (MVE) and book value of liabilities as a proxy for market value of assets,
since the latter is not readily available,. Likewise, the replacement cost of assets is
proxied by their book value. Accordingly, the definition of bank’s charter value in the
‐‐9‐‐ value book t i value book t i calue market t i t
i Equitycapital Liabilities Assets
CV, = , + , − , (3) After some re‐arrangement, (3) can be re‐written as:
value book t i value book t i calue market t i value book t i t i t i Assets s Liabilitie capital Equity Assets CV q , , , , , , 1 + = + = (4)
where all measures are taken at end of year t.
The assumption is that the charter value is capitalized into the market value of
equity, but not into the book value of assets. Hence, a bank with high charter value
should have higher q. Notwithstanding the limitations, it provides a operational
measure of a bank’s charter value, as it takes on board both the asset and liabilities sides
of the balance sheet: greater market power in loan (asset) and deposit (liabilities)
markets would be reflected in higher q.4
With respect to risk‐taking, we use several measures that capture different
aspects of risk. First, we use the banks’ absolute capital buffer BUF. The idea is that BUF
is a measure of banks’ distance to default. In addition, we decompose the absolute
capital buffer into capital and risk‐weighted assets, as they measure two different
aspects of banks’ risk‐taking. Fourth, banks’ asset risk is also determined by the quality
of its loan portfolio. Hence, we use the ratio of gross non‐performing loans to total loans
(NPL). And finally, we use the banks’ Z‐score as a measure of bank soundness (Boyd and
Runkle, 1993; Beck and Laeven, 2006). The relevance of this measure stems from the fact
that it is directly related to the probability of a bank’s insolvency, i.e., the probability that
the value of its assets becomes lower than the value of the debt.
In step 1, we regress banks’ charter value on its determinants. To account for
bank efficiency, we include the banks cost‐income ratio, CIR. As banks with higher
efficiency are expected to earn higher rents, CIR is included with an expected negative
4
It needs to be borne in mind that such a measure is not without its shortcomings. The first is possible measurement errors in both the numerator and denominator. For instance, the book value of liabilities is a good proxy for market value of equity when liabilities comprise primarily of short‐term debt. If banks rely more on market‐based sources of funding, the market value of liabilities could become more sensitive to interest rate changes, not captured in the book value. Second, the book value of assets is measured as historical cost, not at current replacement costs. Hence, when q is observed to be different from unity, the difference may be due to asset return realization rather than to banks’ market power.
‐‐10‐‐
sign (Berger and DeYoung, 1997). Second, we use the ratio of current and savings
deposits to total assets (CORE) and loans to asset (LOAN) ratio to test whether banks
extract rents in the deposit and loan markets. We include the variable NIC to capture
whether banking organizations earn rents from providing financial services that
generate non‐interest revenues (Furlong and Kwan, 2005). Finally, bank size may affect
charter value, as large banks may have greater market power. To incorporate this
possible, the natural logarithm of total bank asset SIZE is included with an expected
positive sign (De Nicolo, 2000).
In order to explore the effect of competition on charter value, we include the
Herfindahl index of concentration in the deposit market.5 This variable has been
employed by Petersen and Rajan (1995) as a measure of loan market power. As market
concentration increases, economic theory suggests that competition declines. This line of
discussion derives from the economics of increased market power with a larger share of
the market concentrated in one or a few firms. As a result, Herfindahl is inversely related
to the degree of competition. Therefore, for hypothesis H1 to be valid, the coefficient on
the concentration variable is expected be positive. We also control for monetary policy
conditions by employing the yield on 364‐day T‐bills (YLD364). At the macro level, we
include the real GDP growth rate and the orientation of the financial system (Ergungor,
2004).
In the second‐step regressions (eq. 2), we regress risk‐taking on charter value and
bank‐specific control variables. The impact of the bank‐specific variables on the measure
of risk‐taking can be summarized as follows.
Financial liberalization is expected to exert a direct effect on bank risk‐taking:
banks retain part of their earnings, thereby increasing their ratio of capital to assets and
their capital buffer. Hellmann et al. (2000) contend that financial market liberalization
reduced profitability and franchise value of domestic banks and prompted greater risk
5 The Herfindahl index is defined as the sum of squares of market shares. Another possibility could be to utilize the
‐‐11‐‐
taking, which was an important factor behind the East Asian crisis. To address this
aspect, we include the banks’ net interest margin (NIM) with an expected negative sign.
Bank size can have direct effect on their risk‐taking behavior. On the one hand,
since large banks are assumed to have general capability to diversify their risks, this
would suggest a negative relationship (Demsetz et al, 1996). On the other hand, the ‘too‐
big‐to‐fail’ theory suggests that large banks have a higher probability of being bailed out
in distress given the possible systemic ramifications (Galloway et al., 1997). These
considerations prompt us to include the natural logarithm of total asset SIZE with
ambiguous expectations regarding the estimated sign.
Market discipline may exert a moderating effect on banks’ risk‐taking, as
uninsured debtors may force banks to have more capital, less risk‐weighted assets,
higher capital buffers, better asset quality and better overall soundness (Park and
Peristiani, 1998; Goldberg and Higgins, 2002). We approximate this by employing the
ratio of sub‐ordinated debt to total asset (SDEBT).
We also control for the impact of banks’ risk‐management skills. The idea is that
banks with higher charter values may have superior skills in risk management and
therefore, better control their probability of default. Hence, they can afford to have less
capital, lower capital buffers, asset quality and soundness as also higher risk‐weighted
assets (Casu and Molyneux, 2003). The ratio of off‐balance sheet activities to total assets
(OBS) is included to capture this aspect with an expected positive sign on banks’ risk‐
taking.
Apart from indirect effects through charter value, efficiency could have a direct
effect on risk‐taking, as banks with a low degree of efficiency may also exhibit higher
default probability. Therefore, following from Agusman et. al. (2006) and Furlong and
Kwan (2005), we include the banks’ cost income ratio CIR with an expected negative
sign. Finally, year dummies (not reported) are included to capture year‐specific effects
not directly incorporated into the analysis.
‐‐12‐‐
5. Data description
The time period of the study spans 1996‐2006 and comprises of 33 banks
including 19 state‐owned, 4 de novo private and 10 old private banks, comprising, on
average around 85% of banking sector assets over the sample period. The data for the
analysis are drawn primarily from Statistical tables relating to banks in India, a yearly
publication by the Indian central bank that reports bank‐wise balance sheet and profit
and loss numbers. The prudential ratios for banks are culled out from Report on trend and
progress of banks in India, a statutory publication by the Indian central bank that provides
bank‐level prudential and financial ratios. Taken together, these two publications
account for almost all of the bank‐level variables employed in the analysis. The macro
variables for the study come from the Handbook of Statistics on Indian economy, another
annual central bank publication that reports time‐series data on monetary and macro
variables.
As explained earlier, the computation of charter value involves calculating the
market value of equity, which is extracted from the Prowess database, a firm‐level
database of manufacturing and services companies (CMIE, 2007). We extract the NSE
closing share price and multiply it by the number of outstanding shares of listed banks,
which yields the market value of equity.6 Given that banks became listed at different
time points over the sample, we are consequently left with an unbalanced panel of
banks, comprising of a minimum of 9 in the beginning year of the sample to a maximum
of 33 in 2006.
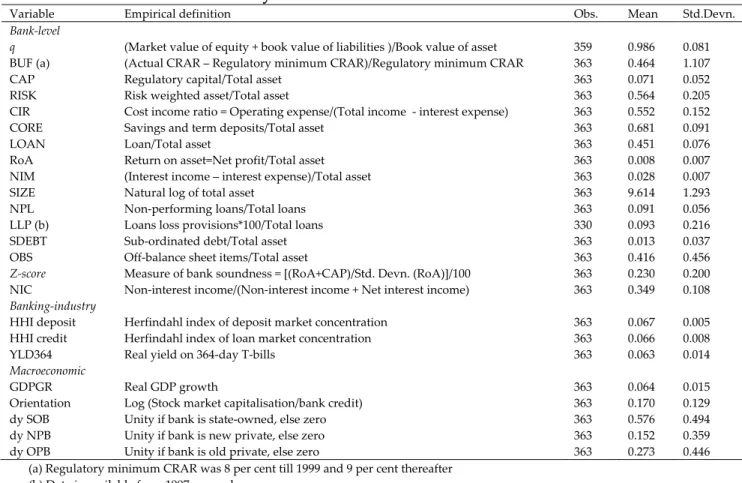
The empirical definition of the variables along with the summary statistics is
provided in Table 2. The table shows that banks’ average charter value ranges equals
1.05 with high standard deviation. Hence, the average bank seems to exhibit a low
degree of market power.
6 National Stock Exchange (NSE) is the state‐of –the‐art exchange for listed companies in India, which commenced
‐‐13‐‐
Table 2: Variables and summary statistics
Variable Empirical definition Obs. Mean Std.Devn.
Bank‐level
q (Market value of equity + book value of liabilities )/Book value of asset 359 0.986 0.081
BUF (a) (Actual CRAR – Regulatory minimum CRAR)/Regulatory minimum CRAR 363 0.464 1.107
CAP Regulatory capital/Total asset 363 0.071 0.052
RISK Risk weighted asset/Total asset 363 0.564 0.205
CIR Cost income ratio = Operating expense/(Total income ‐ interest expense) 363 0.552 0.152
CORE Savings and term deposits/Total asset 363 0.681 0.091
LOAN Loan/Total asset 363 0.451 0.076
RoA Return on asset=Net profit/Total asset 363 0.008 0.007
NIM (Interest income – interest expense)/Total asset 363 0.028 0.007
SIZE Natural log of total asset 363 9.614 1.293
NPL Non‐performing loans/Total loans 363 0.091 0.056
LLP (b) Loans loss provisions*100/Total loans 330 0.093 0.216
SDEBT Sub‐ordinated debt/Total asset 363 0.013 0.037
OBS Off‐balance sheet items/Total asset 363 0.416 0.456
Z‐score Measure of bank soundness = [(RoA+CAP)/Std. Devn. (RoA)]/100 363 0.230 0.200
NIC Non‐interest income/(Non‐interest income + Net interest income) 363 0.349 0.108
Banking‐industry
HHI deposit Herfindahl index of deposit market concentration 363 0.067 0.005
HHI credit Herfindahl index of loan market concentration 363 0.066 0.008
YLD364 Real yield on 364‐day T‐bills 363 0.063 0.014
Macroeconomic
GDPGR Real GDP growth 363 0.064 0.015
Orientation Log (Stock market capitalisation/bank credit) 363 0.170 0.129
dy SOB Unity if bank is state‐owned, else zero 363 0.576 0.494
dy NPB Unity if bank is new private, else zero 363 0.152 0.359
dy OPB Unity if bank is old private, else zero 363 0.273 0.446
(a) Regulatory minimum CRAR was 8 per cent till 1999 and 9 per cent thereafter (b) Data is available from 1997 onwards
6. Regression Analysis
6.1 Charter value
In both specifications (1)and (2), the inclusion of lagged dependent variable
(LDV) renders static panel estimation inconsistent. As a consequence, we resort to the
Generalised Method of Moments (GMM) estimator in Arellano and Bond (1991) to
obtain consistent estimates of the above model. Such data techniques enables to control
for potential endogeneity of privatization and the persistence in performance measures.
Following the recommendation by Arellano and Bond (1991), their two‐step GMM
estimator is applied for interference on model specification. Specifically, with respect to
the validity of instruments, we conduct a Sargan test for the null hypothesis that the
over‐identifying restrictions are valid. We use the lags of all variables (in levels) from the
‐‐14‐‐
The consistency of the estimates also depends on the absence of serial correlation
in the error terms. This will be the case if the differenced residuals display significant
negative first order serial correlation and no second order serial correlation. We present
tests for first‐order and second‐order serial correlation related to the estimated residuals
in first differences. The test statistics are asymptotically distributed as standard normal
variables. The null hypothesis here relates to insignificance, so that a low p‐value for the
test on first‐order serial correlation and a high p‐value for the test on second‐order serial
correlation suggest that the disturbances are not serially correlated.
We first detail the first‐step regressions, which study the determinants of banks’
charter value. The results, reported in Table 3 show that we are not able to reject the
Sargan test. Moreover, we are not able to reject the null hypothesis of no second‐order
serial correlation. In other words, this suggests that the GMM model is well specified.
As one of the reasons for running the first‐step regressions is to see whether
lagged levels of q are suitable instruments for q in the second‐stage regressions, we first
estimate a pure autoregressive model. Specification 1 shows that the coefficient on
lagged q is positive and significant at the 0.01 level, with a point estimate equal to 0.37,
suggestive of a persistence effect. A Wald test rejects the hypothesis that the coefficient
equals one, indicating that banks charter value does not follow a random walk. Hence,
lagged values of q seem to provide information on q and are, thus, suitable instruments
for q.
Models 2‐6 sequentially introduces the concentration measures for deposit and
loans (Models 2 and 3) financial market conditions (Model 4), macroeconomic variables
(Model 5) and bank‐specific factors (Model 6). The idea is to ascertain the effect of each
of these variables on banks’ charter value in isolation, uncontaminated by other factors.
Higher values of HHI deposit, which is tantamount to lower competition,
dampens charter value, consistent with H1 (Model 2). Given that retail deposits are the
mainstay of banks’ funding, greater reliance on stored liquidity is viewed as banks being
better equipped to handle exigencies, with a positive effect on charter values. On the
‐‐15‐‐
3). This is consistent with the structure‐conduct‐performance hypothesis which argues
that high competition allows for non‐competitive behavior and greater intermediation
margin, that results in higher profits for firms. Besides the economic significance, the
magnitude is important as well. In case of deposit, a one standard deviation increase in
HHI deposit produces a 0.06 standard deviation decline in charter value. In case of HHI
loans on the other hand, a one standard deviation rise in HHI loan improves charter
value by 0.04 standard deviation.
Table 3: Determinants of banks’ charter value
Variable (1) (2) (3) (4) (5) (6) Lag q 0.365 (0.005)*** 0.339 (0.0006)*** 0.319 (0.001)*** 0.336 (0.001)*** 0.321 (0.001)*** 0.258 (0.012)*** HHI deposit ‐1.029 (0.048)*** HHI credit 0.403 (0.061)*** YLD364 0.406 (0.006)*** GDPGR 0.253 (0.011)*** Orientation 0.014 (0.001)*** CIR ‐0.062 (0.012)*** CORE ‐0.002 (0.007) LOAN ‐0.149 (0.039)*** SIZE ‐0.028 (0.004)*** NIC 0.047 (0.015)*** dy SOB ‐0.002 (0.0006)*** ‐0.002 (0.0006)*** ‐0.003 (0.0005)*** ‐0.003 0.0005)*** ‐0.002 (0.0006)*** ‐0.002 (0.001)** dy NPB 0.003 (0.0008)*** 0.003 (0.0007)*** 0.004 (0.0006)*** 0.003 (0.0007)*** 0.004 (0.0005)*** 0.008 (0.002)*** Constant 0.012 (0.0007)*** 0.004 (0.0002)*** 0.002 (0.0004)*** 0.001 (0.0004)*** 0.0007 (0.0003)** 0.022 (0.002)***
Year dummies Yes No No No No Yes
Observations 293 293 293 293 293 293
# banks 33 28 33 33 33 33
Sargan test 0.998 0.893 0.897 0.901 0.902 0.978
AR (1) test 0.084 0.070 0.065 0.079 0.081 0.079
AR (2) test 0.186 0.204 0.179 0.218 0.238 0.233
Standard errors within parentheses
***, ** and * denote statistical significance at 1, 5 and 10%, respectively
AR (1) and AR (2) are the first‐and second‐order autocorrelation and follow N(0, 1)
In Model 4, the coefficient on YLD364 is positive and significant. In other words,
a monetary tightening (increase in yields), negatively impacts charter value. The
macroeconomic variables, GDPGR and Orientation both exhibit correct signs, as
expected.
Regarding the relationship of traditional banking activities with charter value,
the empirical results indicate that higher share of core deposits (CORE) boost charter
‐‐16‐‐
of transactions deposits contributed to higher Q‐values (Keeley, 1990). The effect of
lending on charter value indicates that banks with higher loan portfolio exhibit lower
charters. While this may be odds with the theory that banking firms have information
advantage in relationship lending to their business borrowers, it is consistent with
competition faced by these organizations serving larger businesses with access to money
and capital markets.
CIR has a highly significant and negative effect, indicating that inefficient banks
have lower charter values. The results may reflect the ability of more efficient (lower
cost) organizations to retain rents. It also may be because more efficient firms are
viewed as more likely to survive and continue to earn rents. Indeed, Berger and Mester
(2003) found that better performance of US banks during the 1990s was, among others,
the outcome of their improved efficiency. Non‐interest income (NIC) shares appear to
have had a strong and growing positive effect on charter value ratios, indicating that
banking firms earn rents from providing financial services that generate non‐interest
revenues.
Bigger banks are observed to have lower charter values. If monopoly rents are
sufficiently high for small banks, then the component of charter value driven by
monopoly rent would be high, suggestive of an inverse relation between size and
charter value. The evidence is in line with the cross‐country evidence by De Nicolo
(2000) which observes a negative size‐charter value relationship for European and to a
lesser extent, for US banks.
Finally, the coefficients on the dummy variable for state‐owned banks (dy_SOB)
is consistently negative, whereas that on de novo private banks (dy_NPB) is consistently
positively across all specifications. This suggests that the charter value of the latter
category is higher, whereas that of the former is uniformly lower as compared to old
private banks (the omitted category). The results are materially unaltered when all
variables are included together (Model 7).
‐‐17‐‐
6.2 Risk‐taking
To control for potential endogeneity of q, charter value is modeled as an
endogenous variable, as set out in Table 4. On capitalization, the fitted charter value is
found to have a significantly positive effect on CAP, suggesting that banks with high
charter values tend to hold higher capital. In general, the results show that q is highly
significant and positive in the BUF and CAP specification, and negative and significant
in the other specifications.
The effect of q on CAP is significant not only in a statistical sense, but also in the
economic sense as well. More specifically, if q increases by 1 standard deviation, CAP
decreases by 0.2 standard deviation. While these magnitudes are not substantial, this
suggests that banks have been pro‐active in augmenting their capital base. In case of
BUF, a one standard deviation movement in q produces a 0.02 standard deviation rise in
the capital buffer. As q does not have a significant effect on RISK, the effect of q on BUF
seems to come through the positive effect of q on CAP, but not on RISK. Regarding
credit risk, the fitted charter value is found to have a significantly negative effect on
NPL: the magnitude of the point estimate equals ‐0.13. In other words, a rise in NPL by a
percentage point lowers bank charter value by roughly 0.13 percentage points. The
coefficient on q in both the LLP and Z‐score equations are positive. Taken together, the
regression results confirm that banking firms with higher charter values tend to take
lower risk, consistent with earlier evidence on this aspect (Furlong and Kwan, 2005;
Agusman, 2006).
The significance of the lagged endogenous variable supports the dynamic
specification. By subtracting 1 and multiplying by ‐1, the coefficient estimates can be
interpreted as the speed of adjustment in the endogenous variable. Thus, the estimated
speed of adjustment of BUF is about 0.8 and a Wald test indicates that the speed is
highly significant.
‐‐18‐‐
Table 4: Charter value and bank risk‐taking
Variable BUF CAP RISK NPL LLP Z‐score
LDV 0.175 (0.015)*** ‐0.075 (0.027)*** 0.554 0.078)*** 0.785 (0.044)*** 0.933 (0.004)*** 0.576 (0.052)*** q – hat 0.209 (0.094)** 0.110 (0.040)*** ‐0.099 (0.078) ‐0.130 (0.037)*** 1.093 (0.075)*** 0.315 (0.098)*** RoA 0.824 (0.418)** 0.179 (0.198) 0.329 (0.370) ‐0.830 (0.312)*** 0.134 (0.184) 0.619 (0.198)*** CIR ‐0.844 (0.206)*** ‐0.051 (0.008)*** ‐0.151 (0.086)* 0.082 (0.018)*** ‐0.021 (0.035) 0.102 (0.036)*** SIZE 0.055 (0.092) 0.041 (0.003)*** ‐0.131 (0.060)** ‐0.032 (0.010)*** 0.129 (0.040)*** 0.025 (0.028) SDEBT 0.005 (0.155) 0.033 (0.007)*** 0.158 (0.083)** 0.021 (0.010)** 0.092 (0.030)*** 0.054 (0.045) OBS ‐0.202 (0.027)*** ‐0.012 (0.002)*** 0.0006 (0.016) ‐0.004 (0.003) ‐0.029 (0.007)*** ‐0.008 (0.010) dy_REG 0.112 (0.022)*** ‐0.006 (0.003)*** 0.043 (0.025)* … … 0.021 (0.008)*** dy SOB ‐0.007 (0.012) ‐0.0005 (0.001) ‐0.0008 (0.006) 0.002 (0.0009)*** ‐0.006 (0.002)*** 0.003 (0.001)* dy NPVT 0.034 (0.018)* 0.006 (0.001)*** 0.025 (0.012)** ‐0.007 (0.002)*** ‐0.022 (0.007)*** ‐0.016 (0.006)*** Constant ‐0.121 (0.049)*** 0.015 (0.003)*** ‐0.020 (0.033) ‐0.009 (0.001)*** 0.031 (0.007)*** ‐0.037 (0.010)***
Year dummies Yes Yes Yes Yes Yes Yes
N. Obs; banks 260, 33 260; 33 260; 33 260; 33 260; 33 260; 33
Sargan test 0.987 0.935 0.941 0.907 0.872 0.930
AR (1) test 0.136 0.219 0.025 0.101 0.032 0.081
AR (2) test 0.693 0.527 0.387 0.228 0.317 0.511
Standard errors within parentheses
***, ** and * denote statistical significance at 1, 5 and 10%, respectively
AR (1) and AR (2) are the first‐and second‐order autocorrelation and follow N(0, 1)
The findings with respect to control variables also provide interesting insights.
RoA has a positive impact on BUF and Z‐score, indicating that banks rely on retained
earnings to increase capital. Further, RoA has a negative effect on NPL, which would
suggest risk‐averse behavior on the part of profitable banks and thereby, lower
proportion of impaired loans. SIZE has a negative impact on RISK and NPL and a
positive effect on capital. This indicates that credit risk is typically lower in bigger banks,
perhaps because of diversification benefits. Evidence for the US banking industry is also
supportive of such findings (Kwan and Eisenbis, 1997).
Sub‐ordinated debt is found to have a positive and highly significant effect on
BUF and CAP. Hence, banks that face higher market discipline seem to hold higher
capital, although they also exhibit higher NPL. Banks’ risk management skills proxied by
OBS, is negative, whenever significant. This implies that banks more engaged in off‐
balance sheet activities tend to have lower asset risk.
All the regressions contain a dummy for regulation, dy_REG which equals one
from 2004 onwards, else zero. This is because effective from that year, the 90‐day norms
for classification of loans as non‐performing were introduced. The evidence presented in
‐‐19‐‐
negative for CAP; in other words, a tightening of prudential norms led banks to
increased risk taking (greater loan extension), so much so that, notwithstanding the
lowering of capital, the net effect was a rise in capital buffers. Since all the regressions
include year dummies (not reported), it seems unlikely that the result could be driven by
movements in the business cycle.
6.3 Partial privatization and risk taking: State‐owned banks
To test the impact of partial privatization on risk taking by state‐owned banks,
we introduce three indicator variables. The first is PGO1, a dummy variable that equals
one from the year the bank is privatized, else zero. PGO1 measures the effect of the
privatization itself. The second variable, following Boubakri et al. (2005), is PGO2 that
equal to the number of years since the year of privatization. While PGO2 is included to
capture the immediate effects of privatization, PGO3 captures the average yearly
performance trend in the wake of privatization. The final variable PGO3 is the fraction of
equity divested by the Government in the concerned bank. In case of state‐owned banks,
the average level of divestment has been to the extent of 25%.
We repeat the earlier analysis, and sequentially introduce the three variables, as
indicated above. The results are set out in Table 5. In the second specification where we
examine persistence of privatization, the evidence indicates that incorporating the trend
variable consequent upon listing generates a significant coefficient in the CAP
specification. This indicates that the managerial and operational autonomy provided to
banks in the wake of privatization provided them the necessary leeway to improve
efficiency; the upshot of the process was an improvement profitability and thereby
improved capital ratios.7
7 In terms of Section 17 of the Banking Regulation Act, 1949 which governs the functioning of banking companies in India,
every banking company incorporated in India is required to create a reserve fund and transfer a sum equivalent to not less than 25 per cent of its disclosed profits, to the reserve fund every year.
‐‐20‐‐
Table 5: Partial privatization and risk‐taking – State‐owned banks
Dep var = BUF Dep. Var = CAP Dep. Var = RISK
Variable (1) (2) (3) (4) (5) (6) (7) (8) (9) LDV 0.193 (0.09)** 0.243 (0.09)*** 0.203 (0.09)** 0.549 (0.13)*** 0.335 (0.08)*** 0.417 (0.08)*** 0.454 (0.096)*** 0.457 (0.102)*** 0.379 (0.102)*** q – hat 0.992 (0.49)** 0.820 (0.37)*** 0.641 (0.37)* 0.020 (0.005)*** 0.023 (0.007)*** 0.119 (0.06)** ‐1.89 (0.638)*** 1.631 (1.23) ‐1.647 (0.729)** RoA 0.526 (0.30)* 0.515 (0.31)* 2.001 (1.60) 1.316 (0.39)*** 1.505 (0.99) 1.142 (0.47)*** ‐1.014 (0.780) ‐1.080 (0.867) ‐0.761 (0.670) CIR 1.077 (0.78) 0.996 (0.80) ‐0.149 (0.40) ‐0.013 (0.02) 0.005 (0.02) ‐0.008 (0.02) ‐0.311 (0.133)** ‐0.338 (0.135)*** ‐0.280 (0.110)*** SIZE 1.083 (0.47)** 1.059 (0.48)** 0.269 (0.16)* 0.031 (0.005)*** 0.029 (0.014)** 0.029 (0.007)*** ‐0.602 (0.139)*** ‐0.627 (0.161)*** ‐0.569 (0.117)*** SDEBT ‐1.111 (1.33) ‐1.122 (1.38) 0.229 (0.09)*** 0.003 (0.004) 0.008 (0.003)*** 0.005 (0.003)* ‐0.129 (0.024)*** ‐0.171 (0.124) ‐0.159 (0.056)*** OBS 0.010 (0.24) ‐0.019 (0.24) ‐0.428 (0.17)*** ‐0.012 (0.009) ‐0.017 (0.009)* ‐0.002 (0.010) 0.056 (0.051) 0.027 (0.052) 0.082 (0.059) dy_REG 0.060 (0.04)* 0.050 (0.03)* 0.168 (0.03)*** 0.003 (0.001)** 0.003 (0.002) 0.006 (0.002)*** 0.036 (0.015)*** 0.029 (0.028) 0.0002 (0.018) PGO 1 0.065 (0.04) ‐0.002 (0.002) 0.003 (0.018) PGO 2 0.009 (0.02) 0.002 (0.0005)*** ‐0.014 (0.018) PGO 3 0.449 (0.16)*** 0.025 (0.010)*** 0.030 (0.049) Constant ‐0.158 (0.08)** ‐0.156 (0.08)** ‐0.159 (0.04)*** 0.004 (0.002)*** 0.006 (0.004) 0.0008 (0.003) 0.061 (0.029)** 0.084 (0.045)* 0.091 (0.033)***
Year dummies Yes Yes Yes Yes Yes Yes Yes Yes Yes
N. Obs; banks 148; 19 148; 19 148; 19 148; 19 148; 19 148; 19 148; 19 148; 19 148; 19
Sargan test 0.403 0.388 0.395 0.933 0.511 0.750 0.747 0.593 0.782
AR (1) test 0.002 0.001 0.003 0.196 0.198 0.176 0.103 0.128 0.145
AR (2) test 0.281 0.210 0.865 0.238 0.302 0.156 0.270 0.286 0.250
Standard errors within parentheses
***, ** and * denote statistical significance at 1, 5 and 10%, respectively
AR (1) and AR (2) are the first‐and second‐order autocorrelation and follow N(0, 1)
Finally, when we consider the quantum of privatization, the evidence indicates
that the coefficient on PGO3 is positive and significant in the BUF equation with a point
estimate equal to 0.45. This indicates that the higher the extent of privatization, the
greater the capital buffer. As earlier, the positive effect of the extent of privatization on
the buffer works through its effect on capital, and not through its effect on RISK (PGO3
is statistically significant in the CAP equation, but not in the RISK equation). On balance,
the evidence appears to indicate that the process of partial privatization exerted a
beneficial impact on risk‐taking behavior by state‐owned banks.
‐‐21‐‐
7. Concluding remarks
The analysis provides empirical evidence on the determinants of banks’ charter
value and the effect of charter value on risk‐taking behavior by banks. Towards this end,
the study investigates which banking industry level and institution‐specific factors
influenced bank charter values, using annual data on publicly traded banks for the
period 1996 through 2006.
The empirical results suggest that deposit or loan market concentration both
exert a perceptible influence on banks’ charter value, indicating that the link between
competition and charter value is quite strong. Among the traditional banking activities,
it seems that bank size and operating efficiency appear to be strongly related to bank
charter value. As to the bank characteristics, we find non‐interest revenue shares to be a
significant determinant of bank charters. These observations suggest that banking firms
might be gaining some market power in non‐traditional banking activities, consistent
with temporary rents associated with successful innovations.
In the second‐step regressions, the results provide strong evidence that bank
charter value disciplined bank risk taking, consistent with the evidence for developed
country banking markets. As well, the tightening of prudential regulations is found to
have exerted a beneficial effect on bank charter value ratios. Focusing specifically on
state‐owned banks, the evidence appears to suggest that the process of partial
privatization exerted a beneficial impact on their risk‐taking behavior.
In terms of policy concerns, two consistent findings emerge:. The first is the
negative effect of size on charter value. This assumes relevance in view of the current
spate of consolidation and amalgamations that have been voiced for the banking sector.
In addition, efficiency is observed to exert a strong and consistent impact on charter
value. In other words, the relentless cost cutting by banking firms and their widespread
adoption of newer technology platforms seem to be associated with higher rents. In
effect therefore, this provides support to the role for competition in the banking sector.
‐‐22‐‐
References
Agusman, A., D.Gasbarro and J.K.Zumwalt (2006). Bank moral hazard and the
disciplining factors of risk taking: evidence from Asian banks during 1998‐2003.
FMA European Conference, Stockholm.
Arellano, M., and S. Bond (1991). Some tests of specification for panel data: Monte Carlo
evidence and an application to employment equation. Review of Economic Studies
58, 277‐97.
Beck, T., and L. Laeven (2006). Resolution of failed banks by deposit insurers: Cross
country evidence. World Bank: Washington DC.
Berger, A.N. and R.DeYoung (1997). Problem loans and cost efficiency in commercial
banks. Journal of Banking and Finance 21, 849‐70.
Berger, A.N. and L. J. Mester (2003). Explaining the dramatic changes in performance of
US banks: Technological change, deregulation and dynamic changes in
competition. Journal of Financial Intermediation 12, 57‐95.
Bhide, M.G., A.Prasad and S.Ghosh., (2001). Banking sector reforms: A critical overview.
Economic and Political Weekly (Special Issue on Money, Banking and Finance).
February, 399‐408
Boubakri, N., J.Cosset, O.Guedhami and K. Fischer, (2005). Privatization and bank
performance in developing countries. Journal of Banking and Finance 29, 2015‐41.
Boyd, J., and D.Runkle (1993). Size and performance of banking firms. Journal of
Monetary Economics 31, 47‐67.
Casu, R., and P.Molyneux (2003). A comparative study of efficiency in European
banking. Applied Economics 35, 1865‐76.
Centre for Monitoring the Indian Economy (2007). Prowess database (Release 2.4). CMIE:
Mumbai.
De Nicolo, G. (2000). Size, charter value and risk in banking: An international
perspective. IFC Discussion Paper No.689. Board of Governors of the Federal
Reserve: Washington DC.
Demsetz, R., M.Saidenberg and P.Strahan (1996). Banks with something to lose: the
disciplinary role of franchise value. FRBNY Economic Review 2, 1‐14 (October).
‐‐23‐‐
Demsetz., R.S., M.Saidenberg and P.E.Strahan (1996). Banks with something to lose: The
disciplinary role of franchise value. Economic Policy Review – The Federal Reserve
Bank of New York 2 (October), 1‐14.
Ergungor, O.E. (2004). Market‐ versus bank‐based financial system: Do rights and
regulations really matter? Journal of Banking and Finance 28, 2868‐87.
Furlong, F., and S.Kwan (2005). Market‐to‐book, charter value and bank risk‐taking: A
recent perspective. Paper presented at the Basel Committee Research Task Force
Conference. Vienna, April 2005.
Galloway, T., W.Lee and D.Roden (1997). Banks’ changing incentives and opportunities
for risk taking. Journal of Banking and Finance 21, 509‐27.
Ghosh, S. (2009). Bank risk, charter value and depositor discipline: A simultaneous
equations approach. Applied Financial Economics Letters 16, 239‐44.
Goldberg, L.G. and S.C. Higgings,(2002). Depositor discipline and changing strategies
for regulating thrift institutions. Journal of Financial Economics 63, 263‐74.
Government of India (1991). Report of the Committee on the Financial System (Chairman:
Shri M.Narasimham). New Delhi.
Government of India (1998). Report of the Committee on Banking Sector Reforms (Chairman:
Shri M.Narasimham). New Delhi.
Gropp, R., and J.Vesala (2004). Deposit insurance, moral hazard and market monitoring.
ECB Working Paper No.302. ECB: Frankfurt.
Hellmann, T. F., K. C. Murdock and J. E. Stiglitz (2000). Liberalization, moral hazard in
banking, and prudential regulation: Are capital requirements enough?. American
Economic Review 90, 147‐65
Keeley, M. (1990). Deposit insurance, risk and market power in banking. American
Economic Review 80, 1183‐1200.
Kwan, S., and R.Eisenbis (1997). Bank risk, capitalization and operating efficiency.
Journal of Financial Services Research 12, 117‐31.
Marcus, A. (1984). Deregulation and bank financial policy. Journal of Banking and Finance
8, 557‐65.
‐‐24‐‐
Mercieca, S., K.Schaeck and S.Wolfe (2007). Small European banks: Benefits from
diversification? Journal of Banking and Finance 31, 1975‐98.
Mohan. R., (2004). Financial sector reforms in India: Policies and performance analysis.
Lecture Delivered at the IMF, Washington DC. Available at <www. rbi.org.in>
Nier, E., and U.Baumann (2006). Market discipline, disclosure and moral hazard in
banking. Journal of Financial Intermediation 15, 332‐61.
Park, S., and S. Peristiani (1998). Market discipline by thrift depositors. Journal of Money,
Credit and Banking 30, 347‐64.
Petersen, M., and R.G.Rajan (1995). The effect of credit market competition on lending
relationships. Quarterly Journal of Economics 110, 407‐43.
Reddy, Y.V. (2006), Reforming Indiaʹs financial sector: Changing dimensions and
emerging issues. Address Delivered at the International Center for Monetary and
Banking Studies, Geneva, May. Available at <www. rbi.org.in>
Reserve Bank of India. Report on Trend and Progress of Banking in India (various years).
RBI: Mumbai.